And forthcoming Based on: Free
←
→
Page content transcription
If your browser does not render page correctly, please read the page content below

Changes in the global income distribution and their
              political consequences

                   Branko Milanovic
                   Oslo, August 2018

                       Branko Milanovic

Based on:                       And forthcoming…

                                          Capitalism, alone

                                                              2
Structure of the talk
       • Uniqueness of the current period: Capitalism rules alone + the
         reemergence of Asia (bringing the distribution of economic activity
         within Eurasia to the way it looked around 1500)
       • Emergence of the global “middle/median class” and shrinkage of
         national middle classes
       • Political/philosophical issues brought up by looking at global, as
         opposed to only national, inequalities
       • The past 25 years in the rich world

  Long run                                 Estimated global income inequality over the past two centuries, 1820-
                                                                 2013 (using 2011 PPPs)
                                  80

                                  75                                                 WW2 and US dominance

                                  70

                                  65                                                                         The rise of
                                                                             WW1 and the                     Asia
                                  60                                         Great Depression
                     Gini index

                                  55
                                                   IR and the rise
                                  50               of the West

                                  45

                                  40

                                  35

                                  30
                                    1800              1850            1900             1950           2000                 2050
                                                                              Year

1820-1980 recalculation of Bourguignon-Morrisson; 1992-2013: Lakner and Milanovic with extensions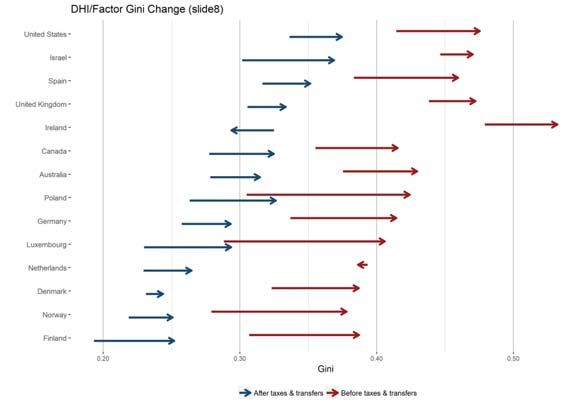
La longue durée: From Karl Marx to Frantz Fanon
                  and back to Marx?
               80
           Location

                                                                                          Forecast
                         60
            Gini index

                                                                 Location
                                                                                          Location
                         40
                                     Location

                         20

                                         Class

                                                                                                Class
                                                                       Class

                          0
                                        1850                          2011                      2050

                                                           Branko Milanovic

                                                 Resurgent Asia
                         China's and India's GDP per capita as percent of British GDPpc from
                          the Industrial Revolution to today (Indonesia vs. the Netherlands)
          50

          45

          40

          35
                                                                                        China
          30
percent

          25
                                                                                          Indonesia
          20
                                                                                         India
          15

          10

           5

           0
            1800                    1850            1900              1950       2000                   2050
Going beyond the averages: Convergence of
Chinese incomes
US and Chinese income distributions around 2002 US and Chinese income distributions in 2013
1.5
1.5
USA USA
China
1
China
1
.5
.5
0
1000 10000 100000 0 1000 10000 100000
Disposable per capita income in PPP dollars
Disposable per capita income in PPP dollars
23% of Chinese population within US income range 70% of Chinese population within US income range
chinausa.ppt
• In the long-run inequality is determined by the spread
of the technological revolutions: the West in the 19th
century, Asia today
• In the medium-run global inequality is determined by:
• What happens to within-country income distributions?
• Is there a catching up of poor countries?
• Are mean incomes of populous & large countries (China,
India) growing faster or slower that the rich world?
Branko MilanovicPast twenty-five years in the world
Past twenty-five years in the world
The emergence of the “global middle/median class”
Figure 3. Global income dstribution in 1988 and 2011
.8
1988
Emerging global “middle
2011 class” between $3 and $16
.6
density
.4
.2
0
1000
3000
10000
50000
300
log of annual PPP real incomeReal income growth at various percentiles of global
income distribution, 1988-2008 (in 2005 PPPs)
80
$PPP2
X “China’s middle class”
70
Real PPP income change (in percent)
$PPP 180
60
$PPP4.5 $PPP12
50
40
30
20
Branko Milanovic
10 X “US lower middle class”
0
0 20 40 60 80 100
Percentile of global income distribution
From twenty_years\final\summary_data Estimated at mean-over-mean
Real income growth over 1988-2008 and 1988-2011 (based on
2011 PPPs)
140
1988-2011
120
Cumulative real per capita growth in % between 1988 and 2008
100
80
1988-2008
60
40
20
0
0 10 20 30 40 50 60 70 80 90 100
Percentile of global income distribution
Branko MilanovicGlobal growth incidence curve, 2008-13 (preliminary)
50,0
40,0
Annual growth rate (%) of real PPP income
30,0
20,0
10,0
0,0
0 10 20 30 40 50 60 70 80 90 100
-10,0
-20,0
Percentile of global income distribution
g08_13
Branko Milanovic
There was no “elephant” in the previous (pre-globalization) period
Cumulative quasi non-anonymous rate of growth 1970-1992 Cumulative quasi non-anonymous rate of growth 1988-2008
in percent; Bourguignon-Morrisson data in percent; Lakner-MIlanovic data
200
200
150
150
Asian median
100
100
50
50
rich countries' poor
0
0
0 5 10 15 20 0 20 40 60 80 100
1970 ventile 1988 percentile
kernel = epanechnikov, degree = 0, bandwidth = .8
kernel = epanechnikov, degree = 0, bandwidth = 3Global political or philosophical implications
• Does global equality of opportunity matter? Is
“citizenship rent” morally acceptable?
• What is the “optimal” global income distribution?
• Can something “good” (global middle class) be the
result of something “bad” (shrinking of national middle
classes and rising income inequality)? Are we back to
Mandeville?
Position of national income percentiles in global distribution
10 20 30 40 50 60 70 80 90 100
USA
percentile of global income distribution
Russia
Brazil
China
India
1
1 20 40 60 80 100
percentile of country distribution
All countries with income data; year 2013; preliminary data (i.e. not a full sample of countries)Quasi impossibility of having regressive transfers from very rich
and egalitarian countries to very poor countries
100
Norway
90
80
70
60
50
40
30
20
Tanzania
Mali Madagascar
10
1
1 20 40 60 80 100
country percentile
Using calcul11.do and fnal11.dta
The past twenty-five years in the rich worldIncome stagnation and shrinkage in the size of the western middle classes
Income share of the middle four deciles 1980-2013
in percent
34 USA UK
34
32
32
30
30
28
28
1980 1990 2000 2010 2020 1980 1990 2000 2010 2020
year year
Germany Canada
34
34
32
32
30
30
28
28
1980 1990 2000 2010 2020 1980 1990 2000 2010 2020
year year
c:\branko\voter\dofils\define_variables using data_voter_checked.dta
Percentage of population considered middle class in early
1980s and 2013
Finland 50
43
Netherlands 45
42
UK 40
33
Germany 40
37
Canada * 36
35
Spain 34
30
USA 32
27
0 10 20 30 40 50 60
around 1980s 2013
The middle class defined as population with income between +/-25% of national median income (all in per
capita basis; disposable income; LIS data)Redistribution in face of rising market income
inequality
• It is neither globalization/technological change alone, nor is it only
redistribution policy (taxes, transfers)
• Essentially, policy failed to counteract the rising market income
inequality, coming probably from globalization, technological change,
deregulation (which is indeed a policy), monopolization,
reinforcement of the elite power, etc. (topic of my Capitalism, alone)
Branko Milanovic
The headwinds of rising market income inequality
Market (“factor”) income and disposable household income, Ginis,
non-elderly households – change, approx. 1985 to approx. 2013
Data source:
LIS Database
Luxembourg Income Study;
Janet GornickThe role of economic policies in offsetting the increase in marketP
income inequality
USA 1969-2016 Germany 1973-2015
.5
.5
market1 income
.45
.45
gross income
market1 income
.4
.4
disposable income
Gini
Gini
gross income
.35
.35
.3
.3
disposable income
.25
.25
1970 1980 1990 2000 2010 2020 1980 1990 2000 2010 2020
year year
Market income inclusive of state pensions (social security) considered as deferred wages. Calculated from LIS data
Ginis of capital and labor income and
quasi automatic transmission of rising capital
share into greater inter-personal inequalityUSA, 1974-2016 UK, 1979-2013
1,0 1,0
0,9 0,9
0,8
Capital
Capital 0,8
Gini coefficient
0,7
0,7
0,6
0,6
0,5
Labor 0,5
0,4 Labor
0,4
0,3
1970 1980 1990 2000 2010 2020 0,3
1970 1980 1990 2000 2010 2020
Year
Norway, 1979-2013 Germany, 1984-2015
1,0 1,0
0,9 Capital 0,9
0,8
Gini coefficient
0,8
Gini coefficient
Capital
0,7 0,7
0,6 0,6
0,5 Labor
0,5
0,4 0,4 Labor
0,3
0,3
1970 1980 1990 2000 2010 2020
1980 1985 1990 1995 2000 2005 2010 2015 2020
Year
Year
5. Issues of justice and politics
1. Citizenship rent
2. Migration and national welfare state
3. Hollowing out of the rich countries’ middle
classes
Branko MilanovicIncreased inequality of both labor and capital incomes
Gini coefficients of capital and labor income: US UK income inequality 1969-2013
1,0
1974-2013 1,0
Capital
Capital
0,9
0,9
0,8
0,8
Gini coefficient
0,7 0,7
0,6 0,6
0,5 Labor 0,5
Labor
0,4 0,4
1970 1980 1990 2000 2010 2020 1960 1970 1980 1990 2000 2010 2020
Year
1. Is citizenship a rent?
• If between 2/3 and ¾ of our lifetime income is
determined by citizenship, then there is little equality of
opportunity globally and citizenship is a rent (unrelated
to individual desert, effort)
• Key issue: Is global equality of opportunity something
that we ought to be concerned or not?
• Does national self-determination dispenses with the
need to worry about GEO? Rawls’ and statists’ point.
• Migration is an attempt to “dilute” or share the
rent/premium => implication for migration policies
Branko Milanovic2. Optimal global distribution:
the Rawlsian world
•For Rawls, global optimum distribution of
income is simply a sum of national optimal
income distributions
•Why Rawlsian world will remain unequal?
Branko Milanovic
Global inequality in Real World, Rawlsian World, Convergence World…and Shangri-La
World (Theil 0; year 2011)
Mean country
incomes
All equal Different (as now)
Individual incomes
within country
All equal 0 54
(all country Theils=0; all
mean incomes as now)
Different (as now) 23 (all mean incomes 77
equalized; all country
Ginis as now)
Branko Milanovic3.Back to Mandeville
• Possible crowding out of national middle classes, and the creation of a
global one
• But the middle class is presumably a force for stability when there is a
political community. There is no political community at the global level.
What does global middle class mean?
• Would global middle class create a global polity?
• Or, global plutocracy: in the longer-term, reversal to the pre World War I
situation
• Can something that is bad nationally (increased inequality) be good
globally (decreased inequality)?
• Can national vices produce global virtue?
Branko Milanovic
China All-China estimated Gini (1985-2015)
0,60
0,50
0,40
Gini
0,30
0,20
1985-2002 Wu and Perloff
2003-2015 NSB official
0,10 estimates
0,00
1985 1990 1995 2000 2005 2010 2015India Income inequality around year 2011 (household per capita income
or NSS consumption)
70
67
60
51
48 50
50 48
42
40
Gini points
36
30
20
10
0
India NSS Russia USA China Brazil India South Africa
(another) Trilemma of globalization
• You cannot have (A) large differences in mean country incomes, (B)
globalization and (C) no structural migration.
• If A + B as today then migration.
• If A + C then no globalization.
• If B + C then you have to have homogeneous countries like EU15.
• EU, because of significant East-West and North-South income
differences is, in a very modest way, a replica of the world
• EU migration problems stem from moving, as result of enlargement,
from B+C to B+A.Trade-off between citizenship rights and
extent of migration
Full
citizen
rights
Seasonal workers
(almost 0 rights)
0 13% of
Migration flow
world
population*
* People who would like to migrate according
to a world-wide Gallup poll
Branko Milanovic
Why tools from the 20th century will not work?
• Education in quantitative sense will have much less of a “bang for a
buck” and will not by itself reduce the skill premium
• Trade unions are on the decline because the nature of work, in
service-oriented and globalized economy has changes
• Increases in taxation of current income are unlikely because the trust
in the government is less
• New transfers cannot be financed; aging of the population and anti-
migrant feelings further limit what can be done
• And one unlikely danger: more meritocratic capitalism where top
wage earners are also top K earners (and the reverse)What could possibly be done? • Improved quality of education and much easier access to education for all—that is, investing for stronger public education rather than the opposite trend of ever stronger private education • Deconcentraton of ownership and income from capital through the use of tax incentives; a long and arduous process • Employee-stock ownership plans • Higher taxation of inheritance (not current income) • Change in the rules re. financing of political campaigns (especially in the United States) Ok, what are the messages? • Maintain globalization, but do not expect that it will help everybody • Improve domestic redistribution precisely because globalization is not good for all • Expect that the shift of relative economic power to Asia will continue • Improve quality and access to education • Broaden ownership of capital • Tax inheritance • Do not “kill” migration but make it politically more palatable (by reducing migrants’ rights) • Realize that Europe is also part of the Greater Middle East • Reform the funding of political parties and elections
You can also read