Q1-FY2021 Results Presentation - July 2020

Page created by Lawrence Smith
 
CONTINUE READING
Q1-FY2021 Results Presentation - July 2020
Q1-FY2021
Results Presentation
July 2020
Q1-FY2021 Results Presentation - July 2020
Safe Harbor Statement

This document contains certain forward-looking statements with respect to the financial condition, results of
operations and business of UPL Limited (UPL) and certain of the plans and objectives of UPL with respect to these
items. Examples of forward-looking statements include statements made about our strategy, estimates of sales
growth, future EBITDA and future developments in our organic business. Forward-looking statements can be
identified generally as those containing words such as “anticipates”, “assumes”, “believes”, “estimates”, “expects”,
“should”, “will”, “will likely result”, “forecast”, “outlook”, “projects”, “may” or similar expressions. By their nature,
forward-looking statements involve risk and uncertainty because they relate to future events and circumstances
and there are many factors that could cause actual results and developments to differ materially from those
expressed or implied by these forward-looking statements. These factors include, but are not limited to, domestic
and global economic and business conditions, the successful implementation of our strategy and our ability to
realize the benefits of this strategy, our ability to develop and market new products, changes in legislation, legal
claims, changes in exchange and interest rates, changes in tax rates, raw materials and employee costs, our ability
to identify and complete successful acquisitions and to integrate those acquisitions into our business, our ability to
successfully exit certain businesses or restructure our operations, the rate of technological changes, political,
economic and other developments in countries where UPL operates, industry consolidation and competition. As a
result, UPL’s actual future results may differ materially from the plans, goals and expectations set forth in such
forward-looking statements. For a discussion of factors that could cause future results to differ from such forward-
looking statements, see also Risk management, of our Annual Report.

 Q1FY2021 Results Presentation, July 2020
Q1-FY2021 Results Presentation - July 2020
Q1-FY2021
Business Update
   Diego Casanello
Q1-FY2021 Results Presentation - July 2020
Q1 Financial Highlights

                                     In line with previous year                                 Reduced by 31days
      ₹ 7,833 cr.                                                               84 days
                                                                              Net Working
                                                                              Capital (days)
      Revenue

                                                                                 ₹ 22,000 cr.   Maintained at March’20 level
                                     Growth of 3%
       ₹ 1,704 cr
                                                                                 Net Debt
         EBITDA

                                                    EPS of ₹ 7.20 per share vs. ₹ 3.74 per share last year
 Q1FY2021 Results Presentation, July 2020                                                                                      4
Q1-FY2021 Results Presentation - July 2020
Q1 Performance Highlights
                                                                                                       ₹ crore
Particulars                                                 Q1               Q1                B/(W) LY
                                                          FY 2021          FY 2020                               • Robust revenue performance almost at prior year level
                                                                          Proforma                                 and EBITDA margin expansion in a turbulent
Revenue                                                    7,833           7,906                 -1%               environment driven by COVID-19

Gross Margin                                                43%             43%                +20 bps           • Significant improvement by 31 days of Net Working
                                                                                                                   Capital vs. last year
Fixed OH                                                   1,604           1,739                 -8%
Business EBITDA                                            1,779           1,659                 7%              • Strong growth in India, South East Asia driven by good
                                                                                                                   rains
Business EBITDA %                                            23%            21%                +200bps

Special Items ₁                                               75             -                    -              • Gross Margins above last year thanks to cost and
                                                                                                                   portfolio mix improvements
EBITDA                                                     1,704           1,659                 3%
% Revenue                                                    22%            21%                +100 bps          • Fixed cost reduction well ahead of plan, capitalizing on
Proforma considering PPA adjustment of 340cr. in gross margin                                                      COVID-19 contingency plans
1 Special items include contribution to PM Cares Fund for Covid

Revenue Development by Region
                                                                  27%
                                                                          Revenue Variance                       • COVID-19 related supply chain disruptions in most
                                                                                                                   regions delayed sales from Q1 to Q2

                                    10%                                                                          • Brazilian Real devaluation led to postponement of
                                                                                                                   orders from Q1 to later quarters, closer to demand
                       1%                                                        0%                               (4,02 BRL/USD on Jan 1st vs. 5,17 BRL/USD on July 30th)
                                                                                                       0%
      Latin         Europe        Rest of       North             India                                          • North America impacted by COVID-19 related pre-
     America                      World        America
                                                                                         -1%                       buying in Q4 2019/20
       -16%                                       -14%

     Q1FY2021 Results Presentation, July 2020
Q1-FY2021 Results Presentation - July 2020
Q1 Regional Highlights                                                                                                                        ₹ crore

              LATIN AMERICA                                        NORTH AMERICA                                             EUROPE
                   -16%                                                -14%                                                    1%
                           2,400
                                                                                 1,195                                    1,703
                2,015                                                                                                                 1,687
                                                                     1,027

                Q1FY21      Q1FY20                                   Q1FY21      Q1FY20                                   Q1FY21      Q1FY20

    Fx volatility postponing orders                          Slow Q1 driven by COVID-19                           Robust despite COVID-19
           to later quarters                                    related pre-buy in Q4                                  supply delays

 • Good agronomic conditions across most of            • Good agronomic conditions                           • Good herbicide campaign in N. Europe
   LATAM with increase in soy and corn acreage
                                                       • COVID-19 related pre-buying at the end of Q4        • Robust crop prices in Russia and Central Europe
 • Teams continue to successfully increase prices in     impacted revenues in Q1                               due to lower yields
   local currencies to gradually compensate for the
   significant devaluation especially of BRL           • China-USA tariff war remains a tailwind to UPL      • Impact from shipping and supply chain delays
                                                         by helping customers hedge risk for the full year     moving revenues to Q2
 • Strong currency fluctuations have led to
   postponement of orders in Brazil from Q1 to         • Well positioned to capitalize on glufosinate        • South Europe experienced a challenging Q1
   later in the year and closer to demand                demand growth in USA                                  mainly in Spain, France and Italy due to COVID-
                                                                                                               19 uncertainties
 • Covid19 related Supply chain delays shifted sales
   from Q1 to Q2

   Q1FY2021 Results Presentation, July 2020                                                                                                                      6
Q1-FY2021 Results Presentation - July 2020
Q1 Regional Highlights (contd.)
                                                                                                                                                        ₹ crore

                                    INDIA                                                                   REST OF WORLD
                                     27%                                                                         10%
                                                                                                              1,578
                               1,511
                                              1,193                                                                       1,431

                                Q1FY21        Q1FY20                                                          Q1FY21       Q1FY20

             Strong Performance in Growing Market                                            Strong business growth in S.E. Asia

  • 15%+ market growth                                                         • Strong business growth in S. East Asia thanks to return of rains and synergies
  • Branded business grew by 36% with strong performance in Insecticides and   • Demand recovering after earlier covid19 openings
    Herbicides
                                                                               • Growth in Vietnam from increased herbicides sales
  • Continued adoption of pronutiva packages driving growth in BioSolutions
                                                                               • Adverse impact from Fx in Africa
  • Despite the impact of the coronavirus in the region, India had record
    collections in Q1

   Q1FY2021 Results Presentation, July 2020                                                                                                                       7
Q1-FY2021 Results Presentation - July 2020
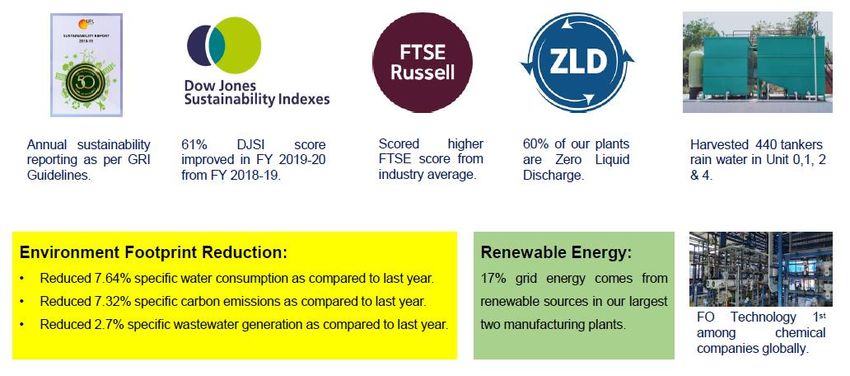
Sustainability Performance

                                             68%

   FY2020 Key Achievements

  Q1FY2021 Results Presentation, July 2020         8
Q1-FY2021 Results Presentation - July 2020
Living and Working UPL in a Virtual World

        UPL Brazil invests in Lives and Webinars to   UPL Argentina holds its first virtual convention
           disseminate technical information

                                                      Initiatives such as Rapid Response Customer
                                                        Service, Customer Engagement Initiative,
                                                      Virtual Sales Conventions, Partner Meetings,
                                                        Learning and Development Webinars and
                                                        many more have allowed UPL to operate
                                                             successfully during the pandemic
      UPL Spain launched a virtual Vine tradeshow
Q1FY2021 Results Presentation, July 2020                                                                 9
Q1-FY2021 Results Presentation - July 2020
Center
Smart R&D: a new approach to technology development

• Development program driven by market and
  portfolio needs that is technology agnostic
• No large-scale fixed research infrastructure
• Attracts the best partner technologies through
  agility and responsiveness
• Unmatched expertise in IP, field development and
  registration drives faster project decisions to get to
  market quicker

         Q1FY2021 Results Presentation, July 2020          10
                                                                10
Q1 FY2021
Financial Results Update
        Anand Vora
Profit and Loss Account – As Reported                                                                                                          ₹ crore
                                                                            Q1 FY21                              Q1 FY20                   Change
                             Particulars
                                                                    Reported                  %         Reported                  %              %

             Total Revenue from operation                                  7,833            100%               7,906            100%               -1%
             Variable Cost                                                  4,451              57%              4,848              61%
             Gross Margin                                                  3,382              43%              3,058              39%             11%
             Fixed Overheads                                                1,679              21%              1,739              22%
             EBITDA                                                        1,704              22%              1,319              17%             29%
             Other Income / (Loss)                                           194                                   33
             Amortization / Depreciation                                     522                                  446
             Finance Cost                                                    551                                  398
             PBT                                                             825              11%                508                6%            63%
             Tax                                                             143                                   77
             PAT                                                             682                9%               430                5%            58%
             Income/(Loss) from Associate Co.
                                                                                 (5)                                 (4)
             and JV
             Minority Interest                                                 102                                  69
             Profit After Tax, Associate
                                                                              575               7%               357                5%            61%
             Income & Minority Interest
             Exceptional Cost                                                  25                                 72
             Net Profit                                                       550               7%               286                4%            92%
           Note: In Q1FY2020 PPA impact of 340cr in EBITDA; adjusted EBITDA 1,659cr, and adjusted PAT after Associates Income minority and exceptional cost 626cr.
  Q1FY2021 Results Presentation, July 2020                                                                                                                           12
Cost and Revenue synergy targets and achievements
          Cost Synergy Target, run rate, USD Mn            Cost Synergies Achieved, USD Mn

                                                  200+

                                                                                        ₹ 83cr
                       120+

                      Year 1                  Year 2

                       75%                        60%                   75%                                60%
          Revenue Synergies Target, run rate, USD Mn
                                                           Revenue Synergies Achieved, USD Mn
                                                  350+

                                                                                           ₹ 53cr

                        100

                      Year 1                      Year 3
Q1FY2021 Results Presentation, July 2020
                                                                  Actual synergies accrued to P&L in FY2020 and Q1FY2021
Working Capital Analysis
                                                                                                            (no. of days)
                                                                Q1 FY21    Q1 FY20

                                                                                     138

                                                               124
                                                         116                               115              115
                                      106 106

                                                                                                       84

                                   IN V EN TO RY      REC EIV A BL ES            PAY ABL ES        N ET W O RKIN G
                                                                                                      C A P ITA L
                                   Q1FY21: 10,243cr     Q1FY21: 11,259cr        Q1FY21: 13,338cr
                                   Q1FY20: 9,758cr      Q1FY20: 11,427cr        Q1FY20: 10,573cr

  Q1FY2021 Results Presentation, July 2020                                                                                  14
Cash Flow Statement (1st April 2020 to 30th June 2020)

                                                                      ₹ Crore

                                                                                 •Cash flow from operating activities of 1,886 crore

                                              3,615
                                                                                 •Working capital changes of (644) crore
                                                             -
                                                            776
                                                 -
                           871
                            -
                                                                                 •Net borrowings of 3,778 cr. 10 year bond raised in
                                                                       10,462

       6,752
                                                                                  June 2020 and repayment of 619 cr. 5 year bond

                                                                                  tendered in the tender offer
      Opening           Cash from            Cash from   Cash from     Closing
                        Operations           Financing    Investing
                                                                                 •Capex spent of 532 crore

  Q1FY2021 Results Presentation, July 2020                                                                                             15
FY2021 Outlook

• Good agronomic conditions in most key markets expected to drive robust demand

• Despite covid19-related challenges in Q1, we remain well positioned to deliver
  revenue and EBITDA growth for the full year

• Raw material savings and COGS synergies, as well as portfolio/regional mix
  improvements supporting gross margins

• Significant fixed cost saving opportunity from synergies and covid19 contingency
  measures driving efficiency gains in SG&A

• Strong liquidity in place to meet debt maturities in the next 18-24 months

• Committed to debt reduction and to maintain investment grade credit rating

 Q1FY2021 Results Presentation, July 2020                                            16
Appendix
Profit and Loss Account                                                                                         ₹ crore
                                                    Q1 FY21              Q1 FY20          Change   Q1 FY20     Change
                           Particulars                                                              Before
                                                Reported      %      Reported      %         %                   %
                                                                                                     PPA 1

             Total Revenue from operation          7,833      100%      7,906      100%      -1%     7,906            -1%
             Variable Cost                          4,451      57%       4,848      61%               4,508
             Gross Margin                          3,382      43%       3,058      39%       11%     3,398            0%
             Fixed Overheads                        1,679      21%       1,739      22%               1,739
             EBITDA                                1,704      22%       1,319      17%       29%     1,659            3%
             Other Income / (Loss)                   194                    33                           33
             Amortization / Depreciation             522                   446                          446
             Finance Cost                            551                   398                          398
             PBT                                     825      11%         508       6%       63%       848            -3%
             Tax                                     143                    77                           77
             PAT                                     682       9%         430       5%       58%       770           -12%
             Income/(Loss) from Associate Co.
                                                       (5)                  (4)                          (4)
             and JV
             Minority Interest                       102                   69                            69
             Profit After Tax, Associate
                                                     575       7%         357       5%       61%       697           -18%
             Income & Minority Interest
             Exceptional Cost                         25                   72                           72
             Net Profit                              550       7%         286       4%       92%       626           -12%

  Q1FY2021 Results Presentation, July 2020                                                                                  18
You can also read