Marine/Offshore Industry Outlook Conference - Terry Bonno, SVP Industry and Community Relations March 22, 2018 - Marine Technology ...
←
→
Page content transcription
If your browser does not render page correctly, please read the page content below
Marine/Offshore Industry Outlook
Conference
Terry Bonno, SVP Industry and Community Relations
March 22, 2018
LEGAL DISCLAIMER
The statements described in this presentation that are not historical facts are forward-looking statements within the meaning of Section 27A of the Securities Act of 1933, as amended,
and Section 21E of the Securities Exchange Act of 1934, as amended. These statements contain words such as "possible," "intend," "will," "if," "expect," or other similar expressions.
Forward-looking statements are based on management’s current expectations and assumptions, and are subject to inherent uncertainties, risks and changes in circumstances that are
difficult to predict. As a result, actual results could differ materially from those indicated in these forward-looking statements. Factors that could cause actual results to differ materially
include, but are not limited to, estimated duration of customer contracts, contract dayrate amounts, future contract commencement dates and locations, planned shipyard projects and
other out-of-service time, sales of drilling units, timing of the company’s newbuild deliveries, operating hazards and delays, risks associated with international operations, actions by
customers and other third parties, the future prices of oil and gas, the intention to scrap certain drilling rigs, the expected timing of the completion of the acquisition of Songa Offshore SE
(the “Transaction”); regulatory or other limitations imposed as a result of the Transaction; the success of the business following completion of the Transaction; the ability to successfully
integrate the Transocean and Songa businesses; the risk that the completion of the Transaction could have adverse effects on the ability of Transocean or Songa to retain customers,
retain or hire key personnel, maintain relationships with their respective suppliers and customers, and on their operating results and businesses generally; the risk that Transocean may be
unable to achieve expected synergies from the Transaction or that it may take longer or be more costly than expected to achieve those synergies; and other factors, including those and
other risks discussed in the company's most recent Annual Report on Form 10-K for the year ended December 31, 2017, and in the company's other filings with the SEC, which are
available free of charge on the SEC's website at: www.sec.gov, and in Songa’s annual and quarterly financial reports made publicly available. Should one or more of these risks or
uncertainties materialize, or should underlying assumptions prove incorrect, actual results may vary materially from those indicated. All subsequent written and oral forward-looking
statements attributable to the company or to persons acting on our behalf are expressly qualified in their entirety by reference to these risks and uncertainties. You should not place
undue reliance on forward-looking statements. Each forward-looking statement speaks only as of the date of the particular statement, and we undertake no obligation to publicly update
or revise any forward-looking statements to reflect events or circumstances that occur, or which we become aware of, after the date hereof, except as otherwise may be required by law.
All non-GAAP financial measure reconciliations to the most comparative GAAP measure are displayed in quantitative schedules on the company’s website at: www.deepwater.com.

This presentation is being issued pursuant to and in accordance with Rule 135 under the Securities Act of 1933, as amended. This presentation does not constitute an offer to sell, or a
solicitation of an offer to buy, any securities, and it does not constitute an offering prospectus within the meaning of article 652a or article 1156 of the Swiss Code of Obligations. Investors
must rely on their own evaluation of Transocean Ltd. and its securities, including the merits and risks involved. Nothing contained herein is, or shall be relied on as, a promise or
representation as to the future performance of Transocean Ltd.

                                                                                                                                                                                              2
OUR LEADERSHIP POSITION

       49 Floaters – 84% UDW & HE

    $12.8 Billion in Backlog

      $5.8 Billion in Liquidity

Unmatched UDW & HE Experience
                                                      3
INVESTMENT THROUGH THE CYCLE

  DIVEST         UPGRADE       ACQUIRE

                                         4
COST EFFECTIVE STRATEGIC UPGRADE

     UDW Floater Ranking
 Pre-Upgrade    Post Upgrade
                                                    MPD-Ready

   75              50
                                             DP Class 3
        ~$12M CapEx

                                  Dual Annular BOPs
                               Acoustic Backup Controls

DISCOVERER INDIA
ENHANCED ENTERPRISE CLASS DRILL
SHIP                                                            5
ACQUISITION OF SONGA OFFSHORE
                                   $3.7B in Contract Backlog into
                                               2024

    Four New Contracted
     Fit-for-NCS Purpose                               At least $40M in
      Harsh Environment                               Annual Synergies;
Semisubmersibles Designed by                      Improved Revenue Efficiency
             Statoil                                    Opportunities

                                             Accretive on an EBITDA,
          Perfectly Aligned with             Operating Cash Flow, and
              Asset Strategy                 Net Debt / EBITDA Basis
                                                                         6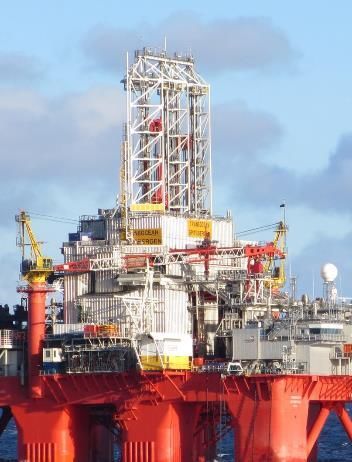
FLEET TRANSFORMATION TO UDW AND HE FLOATERS
      January 2014*            Current Fleet*

                                                                      UDW & HE Floaters
                    16     8                                          DW & MW

                                                                      HS Jackups
 34
          45%                       84%                          41
         UDW & HE                UDW & HE

                      41

                                 * Includes rigs under construction

                                                                                     7
MOST CAPABLE FLOATER FLEET

                50   49

                     12                                  Harsh Environment Floaters
                40
                                                         Ultra-Deepwater Floaters

                                                         Ultra-Deepwater Under Construction
                30
# of Floaters

                            27     26
                                                         Deepwater & Midwater Floaters
                     27      8
                20                       17
                                   19         14    14
                                                     2
                                         11
                10    2     19                                   8          7
                                              13    9                                  6
                                    2                                                                      4
                      8                                          7          7          5
                                    5    6                                                                 4
                                              1     3            1                     1
                0
                     RIG   SDRL*   ESV   DO   NE   ORIG      Maersk     PACDQ         ODL               RDC
                                                                                         Source: Company filings
                                                                                                 * Seadrill Group

                                                                                                                    8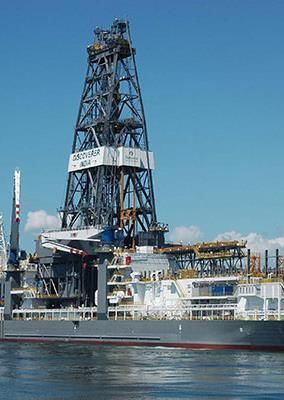
TRANSOCEAN’S INDUSTRY-LEADING BACKLOG
                                         $12.8 Billion Contract Backlog*
                                 Over 90% with Investment Grade Companies
               2.5
                       $2.3                                                                                                                              $2.3
                                  $2.1                                                       Harsh Environment
               2.0
                        0.8                  $1.8                                            Ultra-deepwater**
                                                                        $1.7
                                  0.8
                                                                                                   $1.5
               1.5
USD billions

                                              0.8
                                                                         0.8                                                 $1.1
                                                                                                    0.7                                                    2.3
               1.0
                                                                                                                               0.4
                        1.5
                                  1.3
               0.5                            1.0                        0.9                        0.8                        0.7

               0.0
                     Remaining   2019        2020                      2021                        2022                       2023                    2024-28
                       2018                   * Contracted operating dayrate multiplied by the contract duration for future periods as of 2/19/18 Fleet Status Report
                                                                                                              ** Ultra-deepwater includes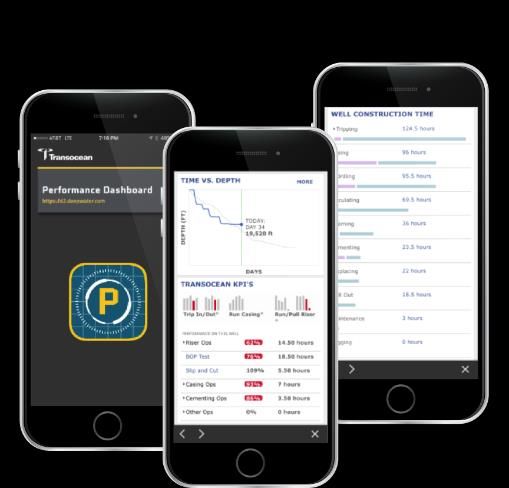
BACKLOG >3x NEAREST COMPETITOR
  RIG

SDRL*

   NE

  ESV

  DO

  ODL

 ORIG

  RDC

PACDQ

        $0.0   $2.0   $4.0   $6.0                  $8.0   $10.0   $12.0                  $14.0
                                    USD billions
                                                                   Sources: Company filings
                                                                    * Seadrill Group, estimated

                                                                                                  10
BACKLOG CONVERTED TO CASH
REVENUE EFFICIENCY REVENUE & EBITDA
Three-year Average - 97% Adjusted Normalized
100% 7,200 50%
6,600
98%
6,000
96%
5,400 40%
94%
4,800
USD millions
92% 4,200
90% 3,600 30%
88% 3,000
2,400
86%
1,800 20%
84%
1,200
82%
600
80% 0 10%
2015 2016 2017
2015 2016 2017
Total Fleet Ultra-Deepwater Adj Normalized Revenue Adj Normalized EBITDA Adj Normalized EBITDA Margin
11PROGRESS IN DE-LEVERING – NET DEBT
7.5
7.1
7.0
6.5
5.9
USD billions
6.0
5.5 5.2
5.0
4.3
4.5
4.0
12/31/2014 12/31/2015 12/31/2016 12/31/2017
12STRONG LIQUIDITY
Major Accomplishments
6.0
Potential Future Revolving Credit • Acquired
Facility and
5.0 Secured Financing Capacity • Songa Offshore
• Transocean Partners
4.0 ~$0.7B-$0.9B • Sold jackup fleet
~$0.4B
USD Billions
~$0.9B
~$2.8B* • Added ~$320M in cash
3.0
• Removed ~$1B in shipyard obligations
2.0
~$2.2B - $2.4B • Raised ~$3.6B through five separate debt
transactions since July 2016
1.0 • Opportunistically repurchased
• ~$2.6B in debt via tender offers
0.0 and early redemptions since July 2016
Cash at Operations CapEx through Debt Due Projected Pro
• ~$1.0B open market repurchases
12/31/2017, Cash Flow 2019 through 2019 Forma
Pro Forma* through 2019 Liquidity @
since July 2015
12/31/19 • Deferred ~$1B in shipyard obligations into 2020
* Pro forma post-Songa closing
13UNMATCHED EXPERIENCE – SUPERIOR PERFORMANCE
Rig Years Ultra-deepwater Rig Years Harsh Environment
350 700
300 600
250 500
200 400
150 300
100 200
50 100
0 0
Source data © 2018 IHS. All rights reserved. No IHS data/deliverables may be reproduced, reused, or otherwise distributed in
any form without IHS’ prior written consent.
14PREDICTABLE & RELIABLE DRILLING
98%
Improvements in Uptime
97%
96%
95%
94%
93%
2011 2012 2013 2014 2015 2016 2017
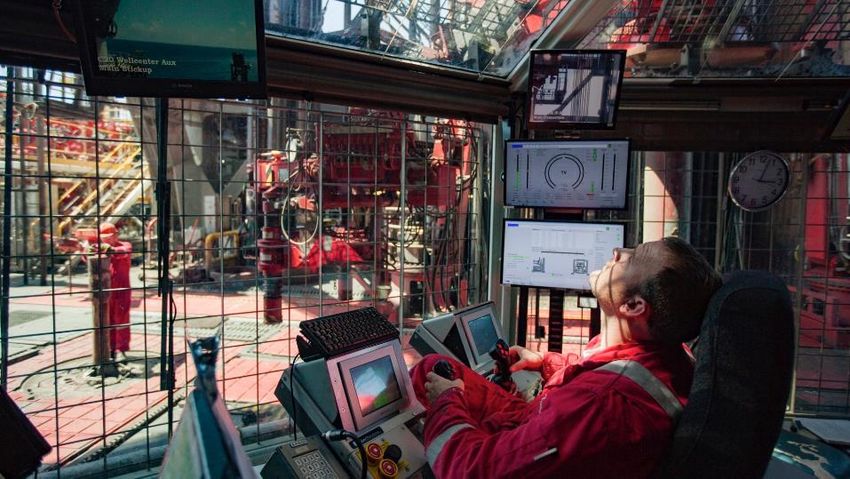
15PERFORMANCE THROUGH DATA
16REDUCED UDW TRIPPING TIME
Ave Rate Benchmark Rate Trendline
~47%
Improvement
in UDW
Performance Dashboard
Phase I Launched Tripping Out
Rate Ft/Hr
Tableau Reports Time
Dedicated Ops
Efficiency Calls
Q1 ‘16 Q2 ‘16 Q3 ‘16 Q4 ‘16 Q1 ‘17 Q2 ‘17 Q3 ‘17 Q4 ‘17
17OFFSHORE EXPLORATION MUST INCREASE
*Liquids only. Replacement ratio calculated as trailing 3yr average offshore barrels
sanctioned divided by annual offshore production
Source: Rystad Energy, Clarksons Platou Securities, January 2018
18IMPACT OF REDUCED BREAKEVEN LEVELS
New offshore project commitments rose 65% in 2017 and are forecasted to rise ~140% in 2018, and 95% of discovered but
undeveloped offshore resources breakeven below $70/bbl.
Source: Rystad Energy, Clarksons Platou Securities, January 2018
19INCREASED FLOATER CONTRACTING
Historical Offshore Rig Contracts Awarded
35
IOCs Nationals Independents
30
25
20
15
10
5
200
0 0
Q…
Q…
Q…
Super Major National Independent
Source data © 2018 IHS. All rights reserved. No IHS data/deliverables may be reproduced, reused, or otherwise distributed in
any form without IHS’ prior written consent. January 2018
20FLOATER OPPORTUNITIES – NEXT 18 MONTHS
U.K. / Norwegian North Sea – Two Most Active Markets Today
6
17
1
3
2 1 1 1
2 2
3 1
1 3
1 2
1 1
3 years 1
31 rig years to be awarded 2
# Number of programs
Source data © 2018 IHS. All rights reserved. No IHS data/deliverables may be reproduced, reused, or otherwise distributed in
any form without IHS’ prior written consent. January 2018; and Transocean
21HARSH ENVIRONMENT ACTIVITY ACCELERATING
60 90
Hi-Spec HE Pricing Trajectory (incl. bonus) HE New Fixtures 2010-2017
80
50
Fixtures 70
40 Rig Years Awarded 60
# of Floater Fixtures
Rig Years Fixed
50
30
40
20 30
20
10
10
0 0
2010 2011 2012 2013 2014 2015 2016 2017
Source data © 2018 IHS. All rights reserved. No IHS data/deliverables may be reproduced, reused, or otherwise distributed in
any form without IHS’ prior written consent.
22OUR LEADERSHIP POSITION
49 Floaters – 84% UDW & HE
$12.8 Billion in Backlog
$5.8 Billion in Liquidity
Unmatched UDW & HE Experience
23You can also read