COVID-19 Implications for the Residential Market - June 2020 - Efront
←
→
Page content transcription
If your browser does not render page correctly, please read the page content below
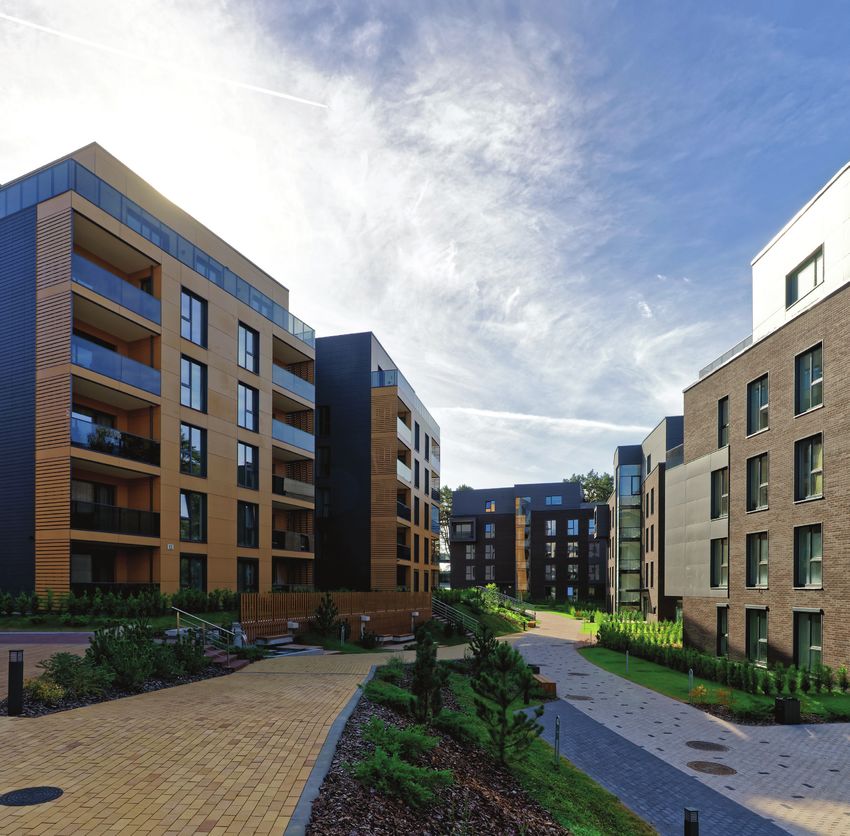
COVID-19 Implications for
the Residential Market
June 2020
Demand
                                                                                    Key Demand Driver- Population Growth
                                                                                    Population growth in Australia has been relatively
                                                                                    consistent, ranging from 1.1% to 2.1% per annum since
                                                                                    June 1999. This steady growth was a contributing
                                                                                    factor in Australia avoiding recession during the GFC
                                                                                    and major housing markets experiencing good growth
                                                                                    over the years.
                                                                                    The chart on the right shows forecasts for the key
                                                                                    components of population growth. Following the
                                                                                    announcement of the COVID-19 pandemic, borders
                                                                                    were closed and net interstate and overseas migration
                                                                                    forecasts were significantly impacted. As a result of
                                                                                    the pandemic, the following forecasts have been

Overview
                                                                                    adopted in our analysis:
                                                                                    » Migration from May until October 2020 significantly
                                                                                      slows. Government forecasts 30% fall in FY2020
There are many factors impacting supply and demand for residential                  » Significant slow down post FY2020, with a fall of            Australia is forecast to see
property at current. With government announcements changing daily,                    85% in FY2021, compared to FY 2019                          overall population growth of
                                                                                    » The recovery is unlikely to be immediate after
the direction of supply and demand is difficult to predict. We expect low
                                                                                      State borders open due to underlying employment
                                                                                                                                                  207,000 people during year
population growth, high unemployment rates and government safety                      conditions, which will take time to return to normality       to June 2021 a reduction
and stimulus initiatives, to have an impact on all residential indicators.          » Net migration is forecast to improve, returning to
                                                                                                                                                      of 220,000 people in
Based on our expectations for these indicators and assuming we avoid                  levels achieved pre COVID-19 in July 2021.
a second wave of the virus as state borders re-open, we have forecast               Applying the same assumptions to the States, the              comparison to pre COVID-19
the supply-demand gaps and median prices for the major markets.                     expected population growth rates by State change                        forecasts.
                                                                                    substantially for FY2020 and FY2021. For the year
                                                                                    to June 2021, the Australian Capital Territory tops
Supply                                                                              the forecast annual population growth with Victoria
                                                                                    traditionally having been the highest growth State.
Residential dwelling supply will depend mainly on policies, planning and
market conditions within each State. Key factors influencing supply across
                                                                                    Total Net Migration (Persons)
the States at current include:
                                                                                                                              2018-2019         2019-2020          2020-2021            2021 - 2022
» Projects delivered over the next 12 months from supply approved prior to
                                                                                     Australian Capital Territory (ACT)           5,008           3,506                  751                  4,767
  COVID-19
» Short-stay property owners converting premises to long-term accommodation
                                                                                     Victoria (VIC)                              105,335          73,735               15,800                94,028
» Planning applications fast-tracked to stimulate state economies and provide
  employment opportunities                                                           Queensland (QLD)                             54,294          38,006                8,144                53,200
» Supply chain issues which could extend building times for some projects
» Difficulties to fund projects due to soft presale markets and increased cost of    New South Wales (NSW)                       88,081           61,657               13,212                78,638
  capital
                                                                                     Western Australia (WA)                        7,131          4,992                 1,070                 17,236
» The longevity of the medical/economic crisis.

                                                                                     South Australia (SA)                         6,143           4,300                  921                  7,581

                                                                                                                                                    Page 3 | COVID 19 - Implications on Resdential Market
Demand Supply Gap
New South Wales South Australia
Queensland
Demand in NSW is likely to match supply by mid- New South SA is set to remain in a state of undersupply in FY2020,
Financial Under/
2021 and start to outstrip supply from early 2022. Western Year Over Supply Wales before supply outstrips demand in FY2021 due to
Given reduced migration over 2020 and early-2021,
Australia 2020 + 3,496 Financial Under/
reduced population growth, resulting from declines
and economic uncertainty, demand is set to remain Year Over Supply in overseas migration estimates. A minor state of
Financial Under/ 2021 + 14,263
lower than dwelling supply in these years. The 2022 Year Over Supply 2020 + 31,949 oversupply will remain through FY2022 and FY2023
2022 - 124
and 2023 financial years are forecast to witness 2020 + 17,454 2021 + 28,934 as the market absorbs the excess supply of stock that
2023 - 10,327
undersupply levels accelerate. However, the NSW 2021 + 21,840 2022 -1,988 entered the market over the previous year. However,
Government’s Planning System Acceleration Program 2022 + 6,562 2023 -16,957 increased population growth over this period (2022–
is now likely to see this undersupply reduced. The 2023 - 3,335 2023), together with the average number of people per
Government Program includes fast-tracking of over household trending downwards, is likely to support
50 major projects in stage one and two that can be healthy demand levels.
approved and underway in six months. Stage one will
contain more than 5,400 dwellings and tranche two
Western Australia
over 3,600 new homes. WA has witnessed a long period of oversupply
brought about by reduced demand following the
Victoria mining boom. Demand caught-up to supply in
Victoria is expected to continue to be undersupplied FY2019, and while oversupply remained, it was
over the next three years with the demand-supply starting to be absorbed from the second half of 2019
gap likely to start reducing by mid-2021 before to March quarter 2020. Reduced population growth
widening again from early 2022 when we begin is forecast to result in an oversupply of dwellings
to see the population growth returning back to now until FY2022 in WA. Demand is then likely to
previous forecasts. Given the reduced migration start rising again, absorbing the excess supply and
forecast over the remainder of 2020 and early-2021, leading to undersupply over FY2023.
demand is set to decline. The 2022 and 2023
financial years are forecast to witness undersupply
Australian Capital Territory
South Australia
levels accelerate. Undersupply is likely to generally continue in the
Financial Under/ Australian
ACT over FY2020 as the Government controls most
Queensland
Year Over Supply Victoria Capital Territory
2020 -1,923 of the land supply and land is released according to
Financial Under/ Financial Under/
After peaking during FY2017, the number of 2021 +1,317 Year Over Supply expected population growth. Further, with forecast
Year Over Supply
dwellings supplied per year in Queensland has 2022 +1,022 2020 - 26,833 population growth within the ACT likely to be higher
2020 +22,952
steadily reduced. The slowdown is forecast to 2023 +751 2021 - 7,391 than the other states over FY2021 and expected
2021 +60,364
continue until FY2021, before projects approved 2022 - 30,562 stimulus through government employment,
2022 - 26,781
start to increase the level of supply again. With 2023 - 56,706 demand should continue in the Territory, albeit
2023 - 91,710
demand falling over FY2020 and FY2021 due tracking slightly below supply. A very slight
to reduced population growth and economic oversupply is, therefore, forecast for FY2021 due
uncertainty, dwelling supply is likely to exceed to migration slowing population growth compared
demand over the following two fiscal years. An to pre-COVID-19 expectations and some of the
uplift in demand is projected to ensue in FY2022 as employment created during the crisis being scaled
migration levels revert to normality and confidence back in that year.
returns in a low interest rate environment.
| Page 4 Page 5 | COVID 19 - Implications on Resdential Market
Dwelling prices in May reflected a decline of -0.4% according to Core Logic’s house value index, however, this
Median Dwelling Prices                                                   is based on early COVID-19 data with true impacts yet to materialise in the indicators. Interest rates are low
                                                                         and Australian Banks are trying to assist mortgage holders over the COVID-19 crisis period, which will result
                                                                         in less distressed properties coming to market in the short-term. However, once mortgage breaks end and
                                                                         unemployment impacts are known, dwellings may start to be offered to the market at discounted prices, it
                                                                         negatively impacting prices. The length of the crisis is going to determine the depth of the downturn.

 Year to

                                          New South Wales                            Victoria                      Queensland                    South Australia               Western Australia
                                                                                                                                                                                                                   Australian Capital
                                                                                                                                                                                                                       Territory

  June - 2020                          9% to 11%                            10% to 12%                          0 to 3%                       0% to 3%                        -1% to 1%                         -1% to 1%

  June - 2021                           -6% to-9%                           -5% to -10%                       -3% to -5%                      -5% to 0%                      -3% to -5%                        -2% to -4%

  June - 2022                           1% to 3%                              0% to 3%                         1% to 3%                       0% to 3%                        1% to 3%                          1% to 2%

 June - 2023                            6% to 8%                             4% to 7%                         4% to 6%                        0% to 3%                       3% to 5%                           5% to 7%

 Median House Price Growth                       27.87%                              43.84%                            20.73%                         13.74%                          -12.05%                              30.06%
 (Mar-2015 to Mar-2020)

 Outlook
 Period of Weak Market Conditions           12 - 18 months                      12 - 18 months                    12 - 18 months                  6 - 12 months                  12 - 18 months                       6 - 12 months

 Median Prices Recovery                       End of 2021                         End of 2021                       End of 2021                    End of 2021                     End of 2021                         End of 2021

 Demand Exceeds Supply                           FY 2023                            FY 2021 *                         FY 2023                         FY 2020                        FY 2023                              FY 2023

                                    » With supply being pushed            » With demand supply gap            » Most of the decline in        » The impact of COVID-19       » After four years of             » Canberra usually has
                                      forward by the NSW                    increasing again, FY2022 is         median prices is expected       is expected to be more         oversupply, dwelling prices       relatively moderate cycles
                                                                                                                                                                                                                 due to the considered
                                      government and demand                 forecast to be a recovery           in FY2021 when the bulk         restrained in SA when          finally started to recover
                                                                                                                                                                                                                 release of land for
                                      flat, FY2021 is likely to see an      year in Victoria, with dwelling     of potentially distressed       compared to the eastern        over the second half of           development.
                                      oversupply driven decline             prices expected to remain           properties come onto the        states.                        2019. The rise was cut short    » However, the unexpected
                                      in median dwelling prices in          stable or have minimal              market.                       » SA markets have                due to COVID-19.                  events over 2020 are likely
                                      Sydney.                               growth.                           » By FY2022, the economic         historically been less       » The rebalancing of supply         to result in development
                                                                                                                                                                                                                 land having been released
                                    » Strong median price growth is » Price growth is expected                  recovery should                 volatile, and while it         should produce a return to
                                                                                                                                                                                                                 based on expected larger
                                      expected in FY2023 as vacancy   when the undersupply                      be underway; and                has not witnessed the          growth in median dwelling         population growth.
                                      declines.                       expands again in FY2023.                  unemployment rates              strong gains in values         prices over FY2022, before
                                                                                                                are likely to be falling,       over recent years, it is       strengthening in FY2023.
                                                                                                                resulting in a favourable       also unlikely that it will
                                                                                                                market, stronger growth in      experience strong falls
                                                                                                                dwelling prices is expected     over the forecast period.
 *Demand supply gap shrinks                                                                                     over the following year.
                   | Page 6                                                                                                                                                                Page 7 | COVID 19 - Implications on Resdential Market
Conclusions

                                                                           Key Contacts
 • NSW, QLD and WA are forecast to be in oversupply in FY2020.
                                                                                Key Contacts
 By FY2021 all states, are likely to be oversupplied, except
 Victoria, which will be in undersupply.

                                                                                 Luana Kenny                              Jarrod Morgan                           Ben Toole
 • Demand is likely to be weak in FY2021 due to economic                         Vic | Managing Director                  NSW | Director                          NSW | Director
                                                                                 +61 3 9605 1071                          +61 2 8234 8117                         +61 2 8234 8105
 uncertainty resulting in many people putting investment and                     luana.kenny@m3property.com.au            jarrod.morgan@m3property.com.au         ben.toole@m3property.com.au

 house purchasing decisions on hold.

 • The residential property market will be impacted by COVID–19
 for the balance of 2020 and the first half of 2021. During this time,          Kym Dreyer                               Robyn Cowie                              Josh Johnston
                                                                                                                                                                  Vic | Associate Director
                                                                                SA | Managing Director                   Vic | Associate Director

 we anticipate residential prices will decrease, with a recovery                +61 8 7099 1800                          +61 3 9605 1025                          +61 3 9605 1015
                                                                                kym.dreyer@m3property.com.au             robyn.cowie@m3property.com.au            josh.johnston@m3property.com.au

 not occurring until the latter half of 2021. This recovery will be
 impacted by the high level of unemployment, however, in part
 will be offset by improving population growth. Once market
                                                                                Stephen Linanne
 confidence is restored, we anticipate slow recovery. Growth is                 QLD | Senior Valuer
                                                                                                                         Lani Rogers                             Jennifer Williams
                                                                                                                         SA |Senior Valuer                       NSW | National Director
 not expected until mid to late 2022 and is forecast to accelerate              +61 7 3620 7905
                                                                                stephen.linanne@m3property.com.au
                                                                                                                         +61 8 7099 1819
                                                                                                                         lani.rogers@m3property.com.au
                                                                                                                                                                 +61 2 8234 8116
                                                                                                                                                                 jennifer.williams@m3property.com.au

 in FY2023.

                                                                               Amita Mehra                               Casey Robinson                           Zoe Haskett
                                                                               VIC | Research Director                   QLD | Research Director                  SA | Research Manager
                                                                               +61 3 9605 1075                           +61 7 3620 7906                          +61 8 7099 1807
                                                                               amita.mehra@m3property.com.au             casey.robinson@m3property.com.au         zoe.haskett@m3property.com.au

                                                                         m3property.com.au                      /m3property

                                                                         DISCLAIMER © m3property Australia. Liability limited by a scheme approved under Professional Standards Legislation. This report is for information
                                                                         purposes only and has been derived, in part, from sources other than m3property Strategists and does not constitute advice. In passing on this information,
                                                                         m3property Strategists makes no representation that any information or assumption contained in this material is accurate or complete. To the extent that this
                                                                         material contains any statement as to the future, it is simply an estimate or opinion based on information available to m3property Strategists at that time and
                                                                         contains assumptions, which may be incorrect. m3property makes no representation that any such statements are, or will be, accurate. Any unauthorised
                                                                         use or redistribution of part, or all, of this report is prohibited.


You can also read