Accuracy of Air Traffic Forecasts - Causes and Consequences - FABEC
←
→
Page content transcription
If your browser does not render page correctly, please read the page content below
Accuracy of Air Traffic Forecasts
Causes and Consequences
Agenda

1. The Need to Forecast

2. Traffic Forecasts Framing and Inputs

3. Traffic Forecasts Performance Assessment

4. Way Forward

5. Wrap Up

 The Accuracy of STATFOR Forecasts – Webinar InterFAB ExpertTalks
 TU Dresden, Institute of Logistics and Aviation / Dr. Hartmut Fricke, Thomas Standfuß Slide 2
 ATM performance data - can we do better? // 02.03.2021
The Need to Forecast
Why and how to predict air traffic demand?

Background
• Air Navigation Service Providers (ANSPs)
 responsibility:
 − Efficient deployment of resources
 − To ensure service provision at minimum
 costs to Stakeholders.
• Resource planning relies on expected strategic
 demand. The optimum competes with
 − Sufficient resources for robust operations,
 − Minimum resources for cost effectiveness.
• Crucial resource: the ATCO
 A prediction horizon of 5 Years is required.
• Poor forecasting leads to either capacity
 shortage or extra production costs

 The Accuracy of STATFOR Forecasts – Webinar InterFAB ExpertTalks
 TU Dresden, Institute of Logistics and Aviation / Dr. Hartmut Fricke, Thomas Standfuß Slide 3
 ATM performance data - can we do better? // 02.03.2021
Traffic Forecast Framing and Inputs Economic

How are forecasts built?
 Growth

 Events and
 Other Inputs
 Trends

STATFOR predictions
• Forecast horizons:
 − Short-Term (2 years)
 − Medium Term (7-years)
 High Speed Traffic Low Cost
 published in spring and autumn every year Train Network
 Forecast Market

 − Long Term (20 years)
• STATFOR provides predictions for both
 flights and service units.
• Main (typical) Input parameters shown right Airport
 Load Factors
 Capacity
STATFOR Strategy and Claim:
• Generating large number of forecasts (low-, base-, Demography

 high scenarios) to be both user-specific and robust
 − Over large series – started in 1990
 − better than linear extrapolation on average See also: EUROCONTROL: ”Seven-Year Forecast February 2019 Main Report”
 − Assumably better than FAA’s figures in the U.S.
 The Accuracy of STATFOR Forecasts – Webinar InterFAB ExpertTalks
 TU Dresden, Institute of Logistics and Aviation / Dr. Hartmut Fricke, Thomas Standfuß Slide 4
 ATM performance data - can we do better? // 02.03.2021
Traffic Forecasts Performance Assessment
How did STATFOR evaluate the perfomance? (2015-2019)
STATFOR’s Accuracy (Relative Performance, RP), Risk (R) and Overall Performance (KPI) metrics
 STATFOR high = 4.1%
Accuracy (for base scenario): CI
 STATFOR base = 3.9%
 Flights STATFOR low = 3.7%
Error EFC = 3.2% - 3.9% = -0.7%
 real = 3.2%
Absolute Error AEFC = |-0.7%| = 0.7%
Absolute Error AENAI = 3.2% - 2.0% = 1.2% naïve = 2.0%
Accuracy (RP) = AENAI / AEFC = 1.7
Risk (Forecast-range accuracy):
With Confidence Interval (CI) Year
to catch CI = 50% forecasts 2014 2015 2016 2017 2018 2019

Be 30% inside, then R = CI – 30% = 20% (more forecasts than we wanted outside) -0.5 < R < 0.5
Overall Performance KPI (combination of base and forecast-range accuracy):
KPI = RP - | R | = 1.7 – 0.2 = 1.5 with KPITARGET > 2.0 and RPTARGET > 1.5
 The Accuracy of STATFOR Forecasts – Webinar InterFAB ExpertTalks
 TU Dresden, Institute of Logistics and Aviation / Dr. Hartmut Fricke, Thomas Standfuß Slide 5
 ATM performance data - can we do better? // 02.03.2021
Traffic Forecasts Performance Assessment 4.200

How to deal with uncertainties?
 4.000
 CI (5 years)
 3.800

 Flights ('000)
 13.2%
 3.600 ≈450,000 flights
Consequences of the Used Boundaries 3.400

• STATFOR high- (blue line) to low-scenario difference (CI) revert 3.200
 directly to uncertainty in the predicted flight numbers 3.000
 2019 2020 2021 2022 2023 2024 2025
• Example: Germany - spring report 2019.
 High Base Low
 • 5-year CI equals 13.2 %. Source: STATFOR Seven-Year Forecast February 2019, Germany
 • The STATFOR prediction thus induce an uncertainty of
 450,000 flights for Germany in 2023 (2019 + 5 years).
 25%

• CIs change massively over time, impacting performance metrics. 20%

 Confidence Interval
 (Percentage Points)
• Reasons are 15%

 • various adaptations to the scenario building technique and 10%

 • major turning points in European traffic 5%
 (e.g., 2009 economic crises - traffic decline & fuel price surge)
 0%

• CI however has consequences for ANSPs.
 France Germany Spain UK
 Data: STATFOR Seven-Year Forecasts Reports, Spring 2006-2019

 The Accuracy of STATFOR Forecasts – Webinar InterFAB ExpertTalks
 TU Dresden, Institute of Logistics and Aviation / Dr. Hartmut Fricke, Thomas Standfuß Slide 6
 ATM performance data - can we do better? // 02.03.2021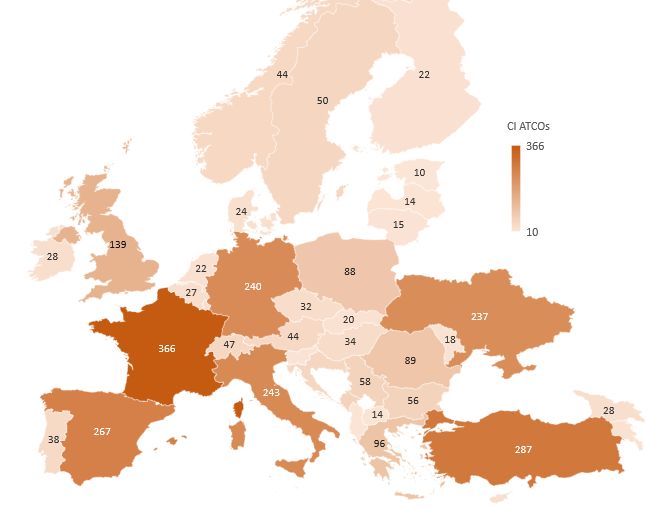
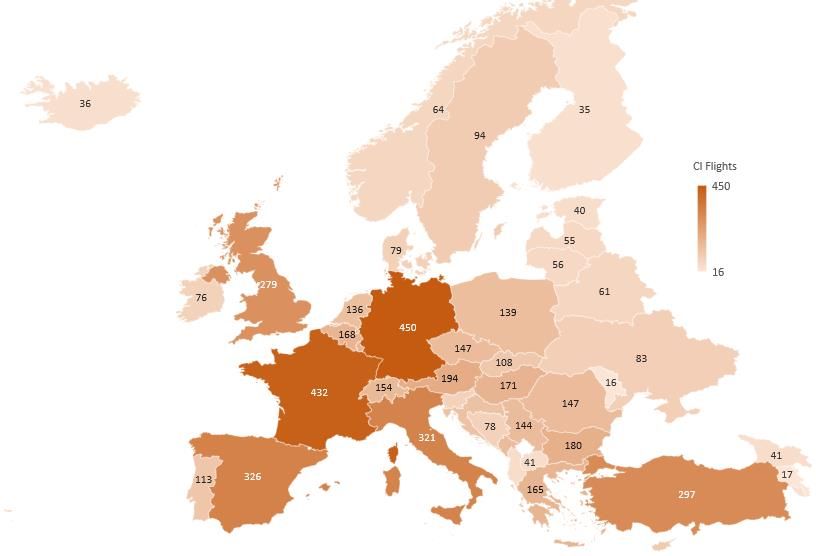
Traffic Forecasts and Implications
How does it affect the output (flights controlled)?

From Germany to whole Europe: CI to flights (in ‘000) conversion on country / FAB level (STATFOR spring report
02/2019, 5-year prediction, 2019-2023). Fact: Significant uncertainty with regards to flights for all countries:

 900

 788
 800
 Sum FABs: 2.95 Mio. Flights

 Confidence Interval (‘000 flights)
 700
 Sum Europe: 5.59 Mio Flights
 600

 495
 500

 386

 362
 400

 286
 300

 209

 160

 141
 200

 124
 100
 78
 126 0

 42

Data: Spring Report 2019. Illustration: IFL Data: Spring Report 2019. Illustration: IFL

 The Accuracy of STATFOR Forecasts – Webinar InterFAB ExpertTalks
 TU Dresden, Institute of Logistics and Aviation / Dr. Hartmut Fricke, Thomas Standfuß Slide 7
 ATM performance data - can we do better? // 02.03.2021

Traffic Forecasts and Implications
What does it mean for ANSP / FAB input (staffing)?

 Demand triggers number of required human resources both on ANSP and FAB level. The figures illustrate CI
 conversion to required ATCOs / FTEs (Approximation based on ACE-data. 5-year prediction, 2019-2023).
 Fact: Linear interdependency assumed (as such neglecting e.g., dis-/economies of scale) specific to each unit:
 800

 733

 659
 700

 Confidence Interval (ATCOs / FTEs)
 Sum FABs: 2,203 FTEs
 600
 Sum Europe: 2,862 FTEs
 500

 392
 MUAC: 32 400

 306
 300

 194

 167

 145
 200

 103

 90

 74
 15 100
 49

 0
 13 18

Data: Spring Report 2019. Illustration: IFL Data: Spring Report 2019. Illustration: IFL

 The Accuracy of STATFOR Forecasts – Webinar InterFAB ExpertTalks
 TU Dresden, Institute of Logistics and Aviation / Dr. Hartmut Fricke, Thomas Standfuß Slide 8
 ATM performance data - can we do better? // 02.03.2021

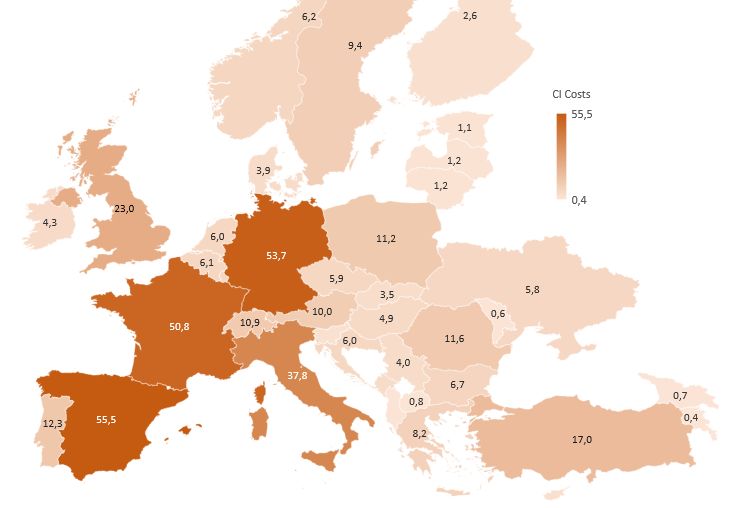
Traffic Forecasts and Implications
How does it affect costs of ANSPs?

CI Spreads lead to relevant uncertainty regarding costs for ANSPs (and FABs). The figures illustrate the CI
conversion to ATCO employment costs in Mio. € (5-year prediction, 2019-2023).
Fact: High uncertainties in costs for some ANSPs, e.g., for DFS, DSNA, ENAIRE and ENAV.
 160

 136
 Confidence Interval (Employment Costs)
 140

 Sum FABs: 369 Mio. €
 120
 MUAC: 8.8 Sum Europe: 399 Mio €
 100

 80

 68
 60

 51
 40

 32

 29
 27

 18

 13
 20

 12

 11
 0
 0,6

Data: Spring Report 2019. Illustration: IFL Data: Spring Report 2019. Illustration: IFL

 The Accuracy of STATFOR Forecasts – Webinar InterFAB ExpertTalks
 TU Dresden, Institute of Logistics and Aviation / Dr. Hartmut Fricke, Thomas Standfuß Slide 9
 ATM performance data - can we do better? // 02.03.2021

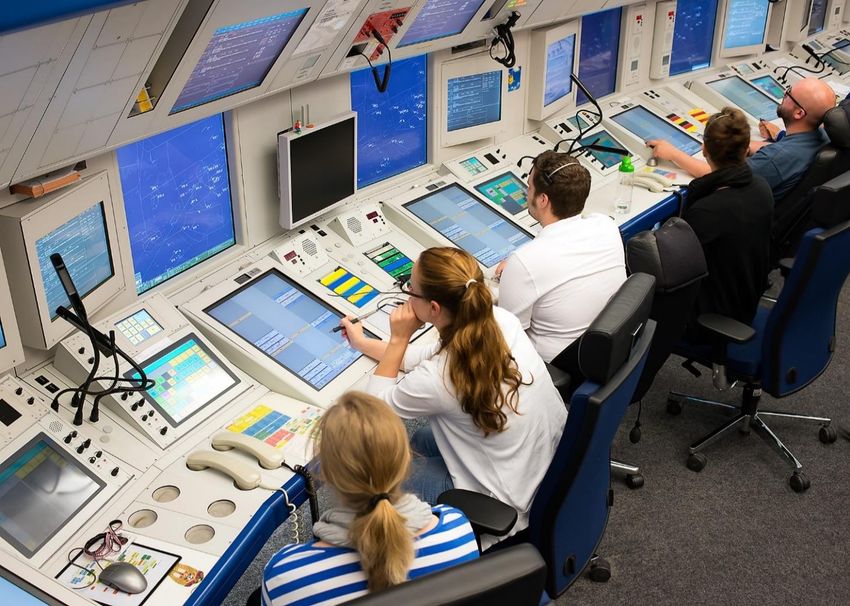
Lessons learnt and and optional way forward
Throughput vs. confidence interval – the Risk

Recall: CI is a preset target (since 2015: 50%) leading to
said “manageable” uncertainties / risks (R) for ANSP /
FAB in resource and cost planning.
 MUAC: 63%
The right figure depicts how many actual flight cases did
reside within CI in the past (5-year horizon, eight
observations based on the spring reports 2006-2013).
The share of ANSP related flight counts / year laying in
the CI:
 90%
 80%
 Share of ANSPs within CI

 70%
 60% 25% Overall
 50% Performance: 39%
 40%
 30%
 Overall/Mean Performance: 39%
 20% Risk R: 50% -39% = 11%
 13%

 10%
 0%
 2011 2012 2013 2014 2015 2016 2017 2018
 Predicted Year
Illustration: IFL Illustration: IFL

 The Accuracy of STATFOR Forecasts – Webinar InterFAB ExpertTalks
 TU Dresden, Institute of Logistics and Aviation / Dr. Hartmut Fricke, Thomas Standfuß Slide 10
 ATM performance data - can we do better? // 02.03.2021
Lessons learnt and an optional way forward
How to probably better measure „accuracy“? Delay

Intermediate Conclusion
• For the pre-set CI=50%, only 39% of actual flight numbers fall inside.
 Contradicts STATFOR intent to deliver reasonable forecasts in toto Over-Estimation Under-Estimation

Stakeholder Perspectives may additionally include
• The quality should measure the offset to actual traffic, not to a naïve
 forecast. It should strictly consider the 5-year time horizon. Time-
 and unit-wise aggregability is preferred. Cost Ineffectiveness
 Illustration: IFL
• Candidate: Mean Average Percentage Error (MAPE): − ( ℎ )
 − ( ℎ )
 − The score measures the forecast bias. Accuracy = 1-MAPE. =
 = = =

 ℎ ℎ
 ℎ ℎ
 − Application is recommended for heterogenous industries with MAPEdirected Meaning
 homogenous products (given for ANSPs). MAPE Score Meaning
 = 0% Actual = Prediction
 − Thresholds exist → intuitive, easy to understand. = 0% Actual = Prediction
 ≤ +5% Very good under-estimation
 ≤ 5% Very good prediction
• Connecting forecast errors to cost- and capacity targets setting: Flow ≤ +10%
 ≤ 10%
 Good under-estimation
 Good prediction
 systems typically behave exponentially. However: Distinction between ≤ - 5% Very good over-estimation
 under-/overestimation distinction required → 0 > MAPEdirected > 0 ≤ -10% Good over-estimation

 The Accuracy of STATFOR Forecasts – Webinar InterFAB ExpertTalks
 TU Dresden, Institute of Logistics and Aviation / Dr. Hartmut Fricke, Thomas Standfuß Slide 11
 ATM performance data - can we do better? // 02.03.2021
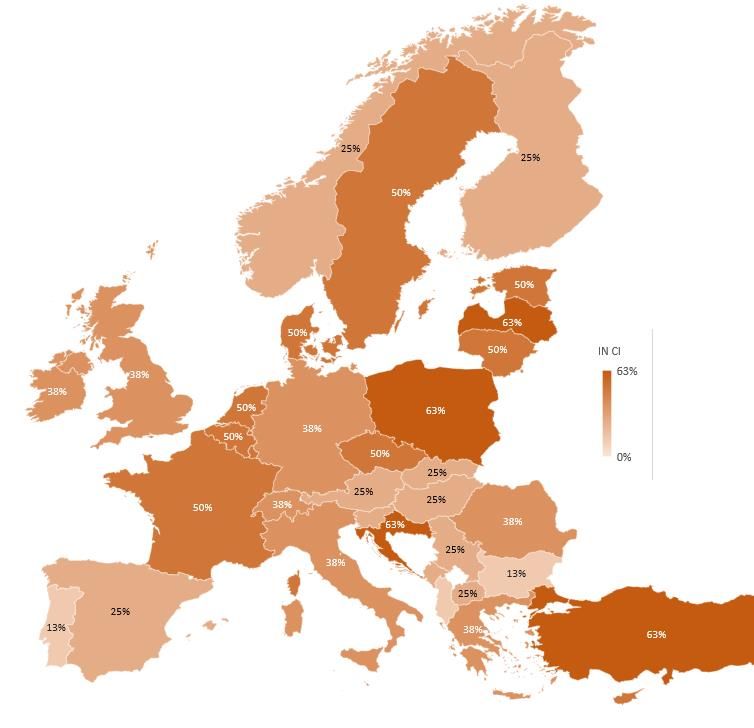
Lessons learnt and an optional way forward
How do STATFOR forecasts behave with MAPE?

Aggregated MAPE score
• The right figure shows the time-wise aggregated MAPE score
 per ANSP, the below figure the unit-wise aggregated score in
 a 5-year horizon for all considered reports (2006-2013).
• The MAPE scores comes to:
 − Very good prediction quality for one of 36 ANSP,
 − Good prediction quality for 13 of 36 ANSPs,
 − Overall: MAPE highlights well differences in accuracy
 MUAC: 8%

 30%
 10%
 25%
 MAPE Score

 20%
 15%
 10% 16%
 5%
 0%
 2011 2012 2013 2014 2015 2016 2017 2018
 Predicted Year
Illustration: IFL Illustration: IFL

 The Accuracy of STATFOR Forecasts – Webinar InterFAB ExpertTalks
 TU Dresden, Institute of Logistics and Aviation / Dr. Hartmut Fricke, Thomas Standfuß Slide 12
 ATM performance data - can we do better? // 02.03.2021
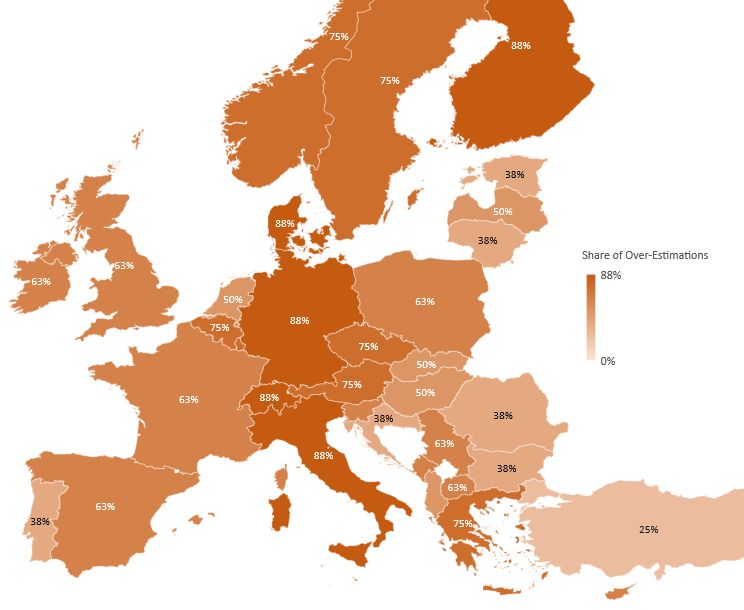
Quality Assessment
 How often occur over- and under-estimations?

 Results:
 • 272 observations (8 years x 34 ANSPs)
 − 167 over-estimations (61%),
 − 105 under-estimations (39%),
 • 26.4 Mio. Flights*
 − Up to 20.4 Mio. over-estimated Flights, MUAC: 50%
 − 6.0 Mio. under-estimated flights.
 • Is there a systematic over-estimation?
 8
 6,9

 63%
Number of flights (mio.)

 5,7

 6
 3,5

 4

 2,4
 1,8

 50%
 1,5
 1,2

 2
 0,9
 0,7

 0,7

 0,4
 0,3

 0,2

 0,2
 0,1

 0,1

 0
 2011 2012 2013 2014 2015 2016 2017 2018
 * Please note that the actual
 Over-Estimation Under-Estimation
Illustration: IFL number might be lower, since flights
 Illustration: IFL
 cannot be aggregated spatially.

 The Accuracy of STATFOR Forecasts – Webinar InterFAB ExpertTalks
 TU Dresden, Institute of Logistics and Aviation / Dr. Hartmut Fricke, Thomas Standfuß Slide 13
 ATM performance data - can we do better? // 02.03.2021
Way forward
How to trigger forecast development with regard to ANSP performance?

• Fact: Delay increases exponentially with DSNA
 2,0

 Demand. 1,8
 DFS
• Thesis: Delay growth results in increasing 1,6

 Average CRSTMP Delay per Flight
 under-estimation. The saturation may Saturation
 1,4
 however follow different slopes.
 DCAC Cyprus 1,2
• Consequence: Over-estimations may result
 from faulty slope modeling. Both effects do 1,0
 MUAC
 impact ANSPs performance. Austro Control
 0,8
 ENAIRE Croatia Control
• Way forward: Consideration in economic HCAA ANS CR 0,6
 benchmarking and target-setting. The Skyguide
 NATS 0,4
 interdependencies will be checked by PANSA
 applying regression analysis. 0,2

 0,0
 -14% -12% -10% -8% -6% -4% -2% 0%
 Directed MAPE

 Data: STATFOR Seven-Year Forecasts, 2006-2019, Illustration: IFL

 The Accuracy of STATFOR Forecasts – Webinar InterFAB ExpertTalks
 TU Dresden, Institute of Logistics and Aviation / Dr. Hartmut Fricke, Thomas Standfuß Slide 14
 ATM performance data - can we do better? // 02.03.2021
Wrap-up
What have we learned? How to go on?

1. The spread between „high“ and „low“ scenario has significant consequences for ANSPs with regards to
 resource- and cost-planning. However, 61% of observations did not match the 50% confidence interval.
2. The time horizon crucial for results (5 vs. 7 years?), but not considered in quality assessment by STATFOR.
3. Other quality indicator candidates exist. We tried (and adopted) MAPE, widely used in other industries.
 Considering all 34/36* ANSPs and eight time periods,
 — 148 observations (54%) showed a score below 10% (good quality).
 — For 82 observations (30%), MAPE score was below 5% (very good quality).
4. Injection to RP3 / RP 4 Performance Scheme
 — “ecology” as add-on to “capacity” and “cost eff.”
 — STATFOR forecasts should include predicted fuel consumption and emissions, the overall
 performance assess realised emissions (RP/MAPE).
 — Candidate: DFS runs ETAS (Enhanced Trajectory Assessment System), already known to
 EUROCONTOL. Robust emission estimates for thousands of flights in German Airspace overnight since
 2016.
 — Could be linked to any STATFOR forecast, can rely on EUROCONTROL BADA 4.
 — Accuracy
 * Depends on year (RP, MAPE), Risk and KPI can directly consider these additional variables.
 The Accuracy of STATFOR Forecasts – Webinar InterFAB ExpertTalks
 TU Dresden, Institute of Logistics and Aviation / Dr. Hartmut Fricke, Thomas Standfuß Slide 15
 ATM performance data - can we do better? // 02.03.2021
Wrap-up
 ETAS: How to link-in ecology in the STATFOR process (1)?

 Input ETAS 3.0 calculation modules and additional data sources Output

 Lift and Drag
 Pre-Processing Energy Module Thrust Module Fuel Module
 Module
 Aircraft Motion
 Data

 Aircraft Engine
 Performance Emissions 4D – Trajectory
 Model Model including
 Weather Data
 Fuel burn and
 Emissions

 Mass Company Lift-Drag, ICAO
Airframe, Engine Estimation Procedure Fuel Flow Emissions
 Configuration Data Tables Data Tables Data Tables Data Bank

 dynamic selection of highest quality calculation data

 The Accuracy of STATFOR Forecasts – Webinar InterFAB ExpertTalks
 TU Dresden, Institute of Logistics and Aviation / Dr. Hartmut Fricke, Thomas Standfuß Slide 16
 ATM performance data - can we do better? // 02.03.2021
Wrap-up
 ETAS: How to link-in ecology in the STATFOR process (2)?
Prediction / Planning Mode:

 Input ETAS 3.0 Output

 Aircraft Performance, „Emission-
 STATFOR Statistical Statistical
 Fuel and Emissions Enhanced
 Traffic Forecast Weather Analysis
 STATFOR“
 Calculation

 Cyclic
 Comparative
 Performance
 Analysis
 Review Report

Performance Evaluation Mode:

 METAR & Aircraft Performance, Real-Time
 ADS-B Numerical Statistical
 Fuel and Emissions Reporting
 Surveillance Data Weather Analysis
 (Eco-KPI)
 Predictions Calculation

 Customer Contact: DFS OA/L – ATM Data & Services – frank.weber@dfs.de

 The Accuracy of STATFOR Forecasts – Webinar InterFAB ExpertTalks
 TU Dresden, Institute of Logistics and Aviation / Dr. Hartmut Fricke, Thomas Standfuß Slide 17
 ATM performance data - can we do better? // 02.03.2021
Questions & Comments ?

The Accuracy of Forecasts
InterFAB Expert Talks: ATM performance data - can we do better?
02 March 2021

Prof. Dr.-Ing. habil. Hartmut Fricke / M.Sc. Thomas Standfuß
TU Dresden
Institute of Logistics and Aviation
Chair of Air Transport Technology and Logistics
hartmut.fricke@tu-dresden.de

 The Accuracy of STATFOR Forecasts – Webinar InterFAB ExpertTalks
 TU Dresden, Institute of Logistics and Aviation / Dr. Hartmut Fricke, Thomas Standfuß Slide 18
 ATM performance data - can we do better? // 02.03.2021
You can also read