Are Cryptoassets Highly Correlated? - Binance Info
←
→
Page content transcription
If your browser does not render page correctly, please read the page content below
3/20/2019                                  [March 2019] Binance Research - Crypto-correlations in the Spotlight - Google Docs

            Are Cryptoassets Highly Correlated?
            An exploration of relationships between Bitcoin and other large cap digital
            assets

            —
            Binance Research - March 20th 2019

            Cryptoasset markets exhibited wild movements in USD prices between 2017 and 2018. Bitcoin
            moved from a low of $735 to a peak of $19,800 in 2017, before finishing 2018 below $4,000.
            Ethereum, the second largest cryptoasset by market capitalization, moved from $8 to a peak of
            $1,440, before closing 2018 at a price below $150. Cryptoassets are generally known to move in
            similar directions. However, conducting correlation analysis across multiple time periods
            reveals additional elements that may influence the strength and direction of these correlations.

                KEY TAKEAWAYS

                 ●    USD returns for the top 30 cryptoassets by market cap were highly correlated over the past
                      3 months (1 Dec 2018 - 1 Mar 2019). Bitcoin (BTC) exhibited the highest correlation with other
                      assets indicating that it is the bellwether of the industry.
                 ●    BTC-denominated returns for large market cap cryptoassets exhibited significantly lower
                      correlations than USD-denominated returns over the same period.
                 ●    Correlations of cryptoasset returns in BTC terms in late 2018 were much lower compared to
                      late 2017.
                 ●    In contrast, correlation between cryptoasset returns in USD terms actually increased when
                      comparing the same two periods. This has coincided with the rise of stablecoins pair
                      dominance during 2018 and is in line with the overall decline in the contribution of BTC pairs
                      to total industry trade volume.
                 ●    Similar to equity markets, idiosyncratic factors influence the correlation of some coins
                      over specific time periods.
                 ●    Additional factors beyond project-specific news & catalysts may influence the strength of
                      correlations among cryptoassets:
                          ○ “Binance Effect”: digital assets listed on Binance oftentimes have higher
                               correlations among themselves.
                          ○ Consensus Mechanisms: the type of consensus mechanism could impact the
                               correlation between returns of cryptoassets (e.g., returns of PoW coins exhibited
                               higher correlations amongst themselves than with non-PoW coins.)

https://docs.google.com/document/d/1aL92GScc-oR3XVDQd3vd4EiUZMLjalBCicB0Ritx_o4/edit#                                           1/11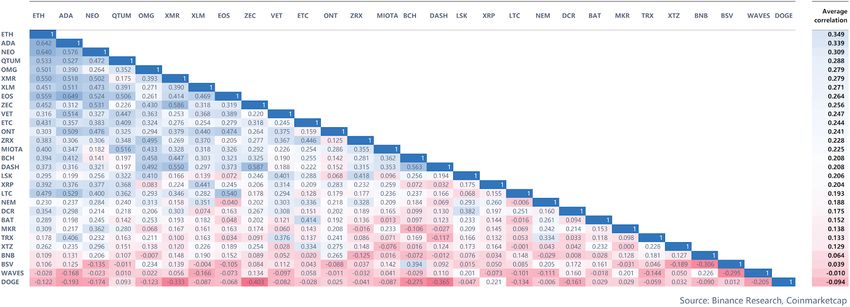
3/20/2019 [March 2019] Binance Research - Crypto-correlations in the Spotlight - Google Docs
1. Three-month correlations within the cryptoasset market
“Correlation statistically measures the strength of a linear relationship
between two relative movements of two variables and ranges from - 1 to + 1.”
Source: Investopedia
In general, assets with a correlation above 0.5 or below -0.5 are considered to have strong
positive/negative correlations. Conversely, a close-to-zero correlation indicates no linear
relationship between two variables, and for the purpose of this analysis, the returns of two
assets.
If the returns of two assets do exhibit a positive correlation, it implies that the two assets are, to
some extent, moving in the same direction, and therefore share similar risks. On the other hand,
a negative correlation between the returns of two assets indicates that the two assets are
moving in opposite directions, and it is thus possible to use one asset as a hedge against the
other.
1.1 Cryptoassets exhibited high correlations in USD terms at the beginning
of 2019
To explore correlations between cryptoassets, the top 30 largest cryptoassets by 90-day
average market cap were selected and their USD returns were calculated in order to create a
correlation matrix as seen below.
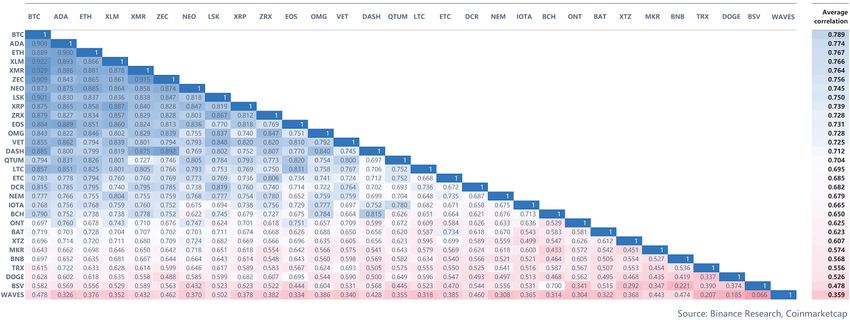
Chart 1 - Large-cap asset 3-month daily return correlation matrix (USD) Dec 1 2018 - Mar 1
2019
Based on this analysis, correlations are highest between altcoins and Bitcoin itself (~ average
correlation of 0.78), indicating that most of the altcoins move in similar directions as Bitcoin,
underscoring Bitcoin’s status as a bellwether for cryptoasset markets.
https://docs.google.com/document/d/1aL92GScc-oR3XVDQd3vd4EiUZMLjalBCicB0Ritx_o4/edit# 2/11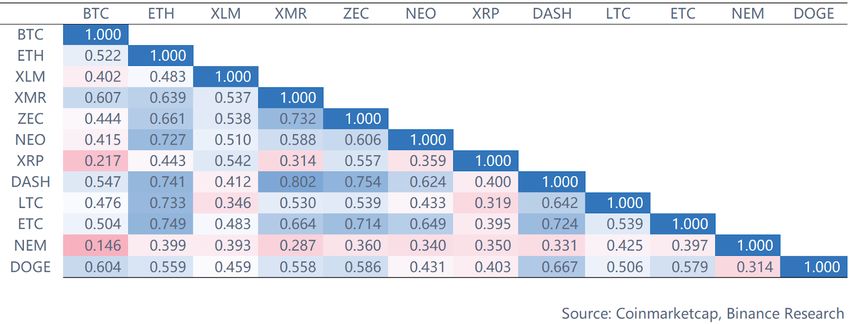
3/20/2019                                  [March 2019] Binance Research - Crypto-correlations in the Spotlight - Google Docs

            While, generally speaking, altcoins are highly correlated with BTC, select cryptoassets exhibit
            materially weaker correlations both with BTC and among one another, which suggests that
            additional idiosyncratic factors may affect the prices and returns of these assets.

            Examples of assets with the weakest correlations in USD terms include Waves (WAVES), Tron
            (TRX), Bitcoin Satoshi’s Vision (BSV), Binance Coin (BNB) and Dogecoin (DOGE).

            While this report doesn’t intend to provide a direct explanation for specific weaker correlations,
            some recent news adds additional context that may be informative in understanding possible
            reasons for these lower correlations.

            Possible idiosyncratic factors and events influencing correlations over this period:

                ●    WAVES: raised an additional $120 million in December 20181
                ●    TRX: BitTorrent ICO on Binance Launchpad, which required TRX or BNB to participate2
                ●    BNB: Launchpad hosted two token sales successfully and the DEX testnet went live
                ●    BSV: Hard-fork (commonly referred to as the "hash power war"3) from Bitcoin Cash (BCH)

            In addition to project specific catalysts, consensus mechanism design and exchange listings
            also potentially influence correlations among specific assets:

            “Binance Effect”
            Of the top 30 market cap coins previously highlighted, only three of them are not listed on
            Binance - Dogecoin (DOGE), MakerDao (MKR) and Tezos (XTZ). These three cryptoassets exhibit
            lower than average correlations, which could be a function of less liquidity, resulting in thinner
            order-books and increased di culty for investors to buy and sell them with similar frequencies
            as the other listed assets. Although this is a preliminary observation, these relationships may
            exist and merit further consideration in future reports.

            Consensus Mechanism
            Additionally, it appears that consensus mechanism type may play a role in the strength of
            correlations among coins, as Proof of Work (PoW) cryptoassets seem to exhibit higher
            correlations with one another than with non-PoW assets. Further analysis on correlations
            among coins with different consensus mechanisms is forthcoming, but of particular interest is
            the upcoming transition of Ethereum from PoW to PoS and what implications this development
            may have on its correlation with PoW coins.
            Broadly speaking, the observation that consensus mechanism may influence correlations
            among cryptoassets has already been highlighted in previous reports4, but still requires
            additional investigation as new protocols are built leveraging novel consensus mechanisms.

            1
             https://www.bloomberg.com/news/articles/2018-12-19/waves-raises-120-million-for-private-blockchain-after-ico
            -boom
            2
              https://info.binance.com/en/research/BTT-2019-1-17.html/
            3
              https://news.bitcoin.com/hash-wars-battle-comes-to-an-end-as-bsv-plans-to-add-replay-protection/
            4
             The Block. Correlation between cryptocurrency prices sharply increased in 2018 (2019).
            https://www.theblockcrypto.com/2019/01/04/analysis-correlation-between-cryptocurrency-prices-sha
            rply-increased-in-2018/

https://docs.google.com/document/d/1aL92GScc-oR3XVDQd3vd4EiUZMLjalBCicB0Ritx_o4/edit#                                           3/11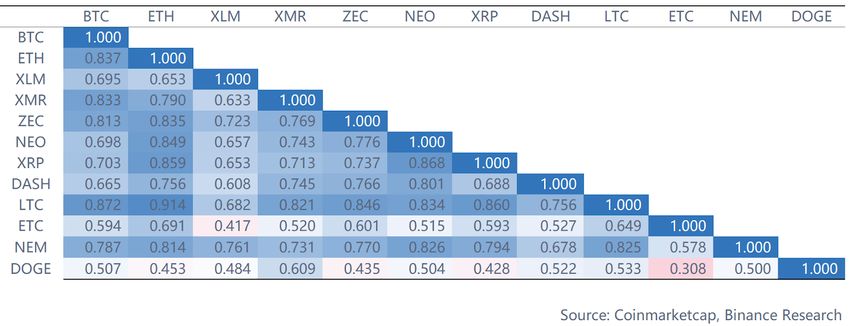
3/20/2019                                  [March 2019] Binance Research - Crypto-correlations in the Spotlight - Google Docs

            1.2 BTC returns exhibited lower correlations at the beginning of 2019

            In order to analyze correlations of returns across cryptoassets, it is instructive to compare
            returns of the same assets (top 30 largest coins by 3-month avg. market cap) in both USD and
            BTC terms over the same time horizon.

            Correlations in BTC returns are important as BTC remains one of the best price indicators of
            crypto markets for two key reasons:
               ● Liquidity: BTC is tradable against almost all altcoins
               ● Dominance:
                       ○ Market capitalization accounts for nearly half of the total cryptoasset industry
                       ○ Volume represents a significant percentage of the industry

            For the purposes of comparing BTC and USD returns of this asset class, it is important to
            understand the components that comprise BTC returns.

            For every cryptoasset, its USD return can be broken down into two components:
                - BTC/USD return
                - Cryptoasset/BTC return

            Therefore, for any cryptoasset (referenced below as “ABC”), its return can be expressed as:

                                       r eturnabcusd = (1 + returnbtcusd )         * (1 + r eturn   abcbtc )   -1

            As a result, cryptoasset returns - calculated based on Bitcoin prices - can be viewed as
            Bitcoin-adjusted returns.

https://docs.google.com/document/d/1aL92GScc-oR3XVDQd3vd4EiUZMLjalBCicB0Ritx_o4/edit#                                           4/11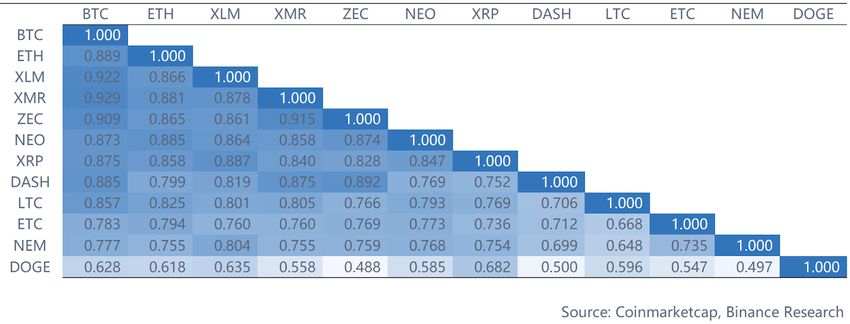
3/20/2019                                  [March 2019] Binance Research - Crypto-correlations in the Spotlight - Google Docs

            Chart 2 - Large-cap asset 3-month daily return correlation matrix (BTC) Dec 1 2018 - Mar 1
            2019

            The correlation of cryptoasset returns based on BTC prices (i.e., Bitcoin-adjusted returns),
            highlights significantly lower correlations among cryptoassets relative to correlations among
            the same coins in USD returns (avg. correlation declines from 0.67 to 0.20).

            Although the average correlation among the top 30 coins is significantly lower in BTC returns
            than in USD returns, the dataset did yield several similarities between correlations when BTC
            returns were compared to USD returns.

            Idiosyncratic factors
            The correlations of the same subset of coins (DOGE, WAVES, BSV, TRX, BNB) with other assets
            are once again relatively lower than the average correlation among the entire basket of
            cryptoassets. Consequently, it appears that the same baskets of assets, whether calculated in
            USD or BTC returns, displayed lower correlations than their peers.

            “Binance Effect”
            Lastly, the existence of a Binance effect also appears in BTC returns correlations. Similar to
            observations from correlations in USD returns, Dogecoin (DOGE), MakerDao (MKR) and Tezos
            (XTZ) exhibit lower correlation than the average correlation among selected cryptoassets for
            this analysis.

            Consensus Mechanism
            In addition, PoW coins also exhibited stronger correlations among one another when using
            Bitcoin-adjusted returns, as was observed in the USD returns dataset.

https://docs.google.com/document/d/1aL92GScc-oR3XVDQd3vd4EiUZMLjalBCicB0Ritx_o4/edit#                                           5/11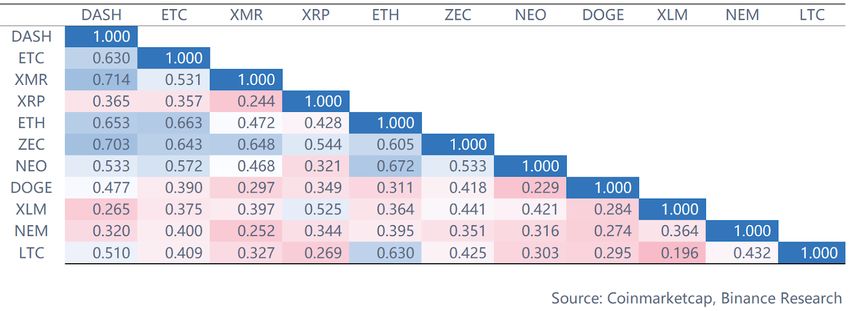
3/20/2019                                  [March 2019] Binance Research - Crypto-correlations in the Spotlight - Google Docs

            2. Did stablecoins impact market structure?
            Given cryptoassets exhibited lower correlations in BTC returns than in USD returns over the
            previous 90 days, the same findings were compared to the dataset during a 3-month period
            both one year before and six months before to understand how the macro environment may
            have affected correlations.

            2.1 USD 3-month Snapshots

            Chart 3 - Dec 1 2018 - Mar 1 2019 : Large-cap assets 3-month correlation matrix (USD)

            Chart 4 - Dec 1 2017 - Mar 1 2018 : Large-cap assets 3-month correlation matrix (USD)

            Comparison of the most recent 3-month correlation matrix with the same period one year prior
            highlights that USD returns have stronger correlations now than in the previous time period.

            Excluding Dogecoin, the minimum correlation of the dataset was 0.648 (between Litecoin and
            NEM) between December 1st, 2018 and March 1st, 2019. In contrast, the same assets had an
            average correlation of 0.51 a year prior during the period between December 1st, 2017 and March
            1st, 2018.

            The extreme volatility in crypto markets from late 2017-early 2018 may have contributed to the
            weaker correlation amongst cryptoassets as a whole.

https://docs.google.com/document/d/1aL92GScc-oR3XVDQd3vd4EiUZMLjalBCicB0Ritx_o4/edit#                                           6/11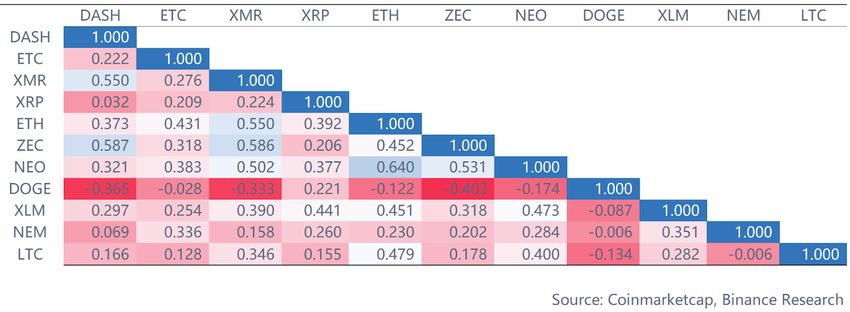
3/20/2019                                  [March 2019] Binance Research - Crypto-correlations in the Spotlight - Google Docs

            Chart 5 - Jun 1 2018 - Sep 1 2018: Large-cap assets 3-month correlation matrix (USD)

            Once again Dogecoin (DOGE) had a lower correlation than the other assets whereas NEM’s
            average correlation with all assets spiked compared to six months prior.

            NEM exhibited the lowest correlation with other coins between December 2017 and March 2018,
            prior to listing on Binance. A few months after being listed on Binance5 correlations
            subsequently rose, which underscores a potential “Binance Effect” as previously described. Yet,
            this single observation is not enough to state a general rule such as “assets not listed on
            Binance must necessarily exhibit lower correlations” and requires further investigation.

            Although correlations among other cryptoassets were higher during this period, ETC's lower
            correlation may be partially explained by idiosyncratic factors such as becoming listed on
            Coinbase in August 20186.

            2.2 BTC 3-month Snapshots

            Chart 6 - Dec 1 2018 - Mar 1 2019: Large-cap coins 3-month correlation matrix (BTC)

            5
              Binance listed NEM in late March 2018.
            https://support.binance.com/hc/en-us/articles/360001903091-Binance-Lists-NEM-XEM-
            6
              https://www.coindesk.com/ethereum-classic-jumps-15-ahead-of-todays-coinbase-listing

https://docs.google.com/document/d/1aL92GScc-oR3XVDQd3vd4EiUZMLjalBCicB0Ritx_o4/edit#                                           7/11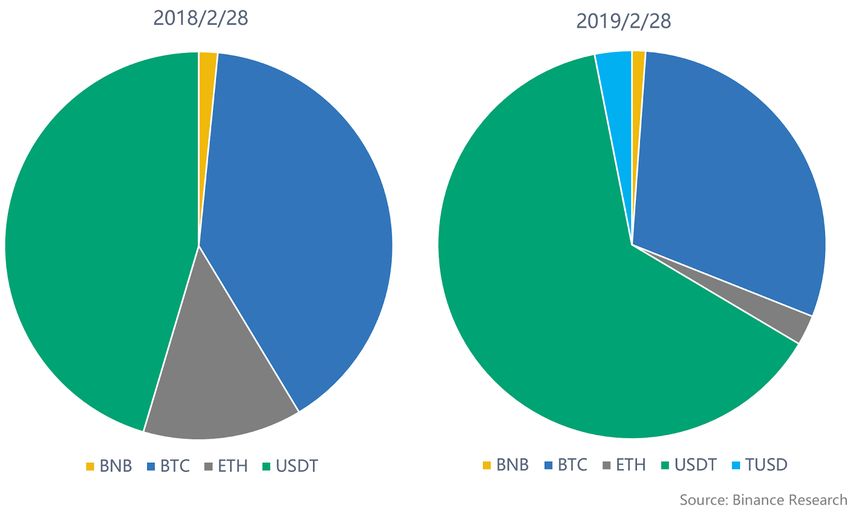
3/20/2019                                  [March 2019] Binance Research - Crypto-correlations in the Spotlight - Google Docs

            Chart 7 - Dec 1 2017 - Mar 1 2018: Large-cap coins 3-month correlation matrix (BTC)

            Based on BTC returns, correlations from last quarter are much lower than one year prior. On
            average, the correlation among cryptoassets was 0.24 vs. 0.43 over the same period one year
            prior.

            Chart 8 - Jun 1 2018 - Sep 1 2018: Large-cap assets 3-month correlation matrix (BTC)

            Correlations during mid-2018 are lower than the previous period (Dec 2017 - Feb 2018), but
            higher than the most recent period (Dec 2018 - Feb 2019), highlighting a downward trend in
            overall correlations between cryptoassets.

            2.3 Does the Rise of Stablecoins Explain Increased Correlations?

            2018 was a bear market year as prices crumbled during the first half of the year and then
            decreased slowly until a bottom around December.

https://docs.google.com/document/d/1aL92GScc-oR3XVDQd3vd4EiUZMLjalBCicB0Ritx_o4/edit#                                           8/11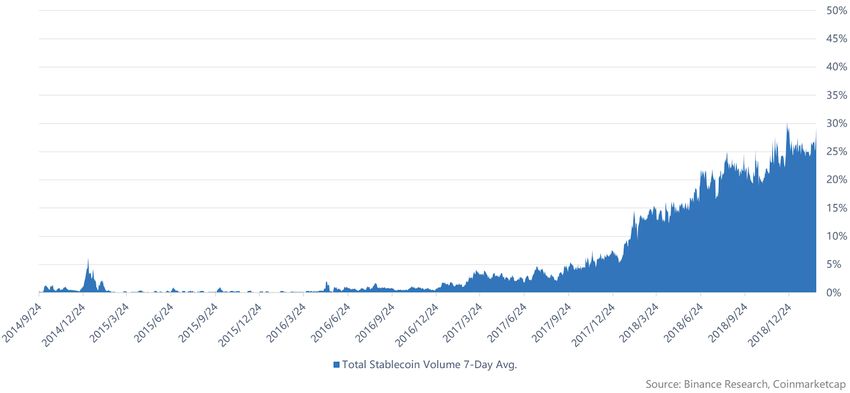
3/20/2019                                  [March 2019] Binance Research - Crypto-correlations in the Spotlight - Google Docs

            Chart 9 - 2018: Evolution of the total crypto market cap (USD bn)

            While the bear market appears to be the most obvious explanation to the increase in
            cryptoasset correlations (using USD returns), the increased availability of stablecoin trading
            pairs and listings, as illustrated in our last report7, has led to a material growth in proportion of
            stablecoin-enabled trading volume versus total cryptoasset trading volume. This could be
            another factor to consider in evaluating correlations from today’s cryptoasset markets.

            Chart 10 - Increasing Volume: Contribution of Stablecoin Volume to Total Industry Volume

            Only one year ago, stablecoin volume represented less than 10% of total cryptoasset trading
            volume (e.g. Binance had only 5 USDT trading pairs8 as of February 28th 2018).

            7
              Binance Research (2019). Can JPM Coin Disrupt the Existing Stablecoin Market?
            https://info.binance.com/en/research/marketresearch/jpmcoin.html
            8
              BTCUSDT, ETHUSDT, BNBUSDT, NEOUSDT, LTCUSDT

https://docs.google.com/document/d/1aL92GScc-oR3XVDQd3vd4EiUZMLjalBCicB0Ritx_o4/edit#                                           9/11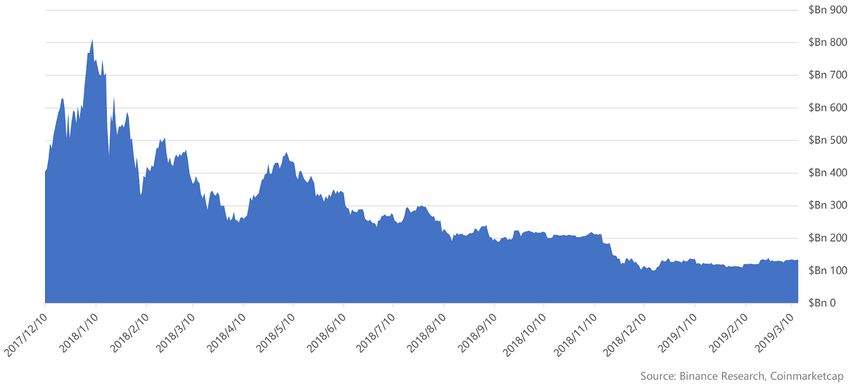
3/20/2019                                  [March 2019] Binance Research - Crypto-correlations in the Spotlight - Google Docs

            Today, stablecoin volume represents more than 30% of the total volume in the cryptoasset
            industry and Binance has more than 100 stablecoin pairs with different quote currencies (e.g.,
            USDT, USDC, PAX, TUSD, USDS).

            During the peak of the bull market (mid-December 2017), speculators used BTC/ETH bought on
            fiat exchanges to deposit funds onto cryptocurrency exchanges such as Binance or Bittrex to
            trade immediately into altcoins.

            Given these crypto-to-crypto exchanges contributed a large portion of total volume in the
            industry, most of the cryptoassets used in this correlation analysis were traded solely against
            BTC, which could explain why their BTC returns had stronger correlations in previous periods
            than in the most recent period (as many of these large cap assets are now also paired with
            stablecoins).

            Prior to mid-2018, in order to buy/sell coins such as XMR, the highest volume trading pair was
            XMR/BTC. During large sell-offs or purchases of altcoins, they all exhibited similar price
            movements in BTC.

            Today, cryptoasset trading pairs are no longer BTC-dominated. As of March 2019, most of the
            largest cryptoassets by market capitalization are now directly traded against stablecoins (USDT
            as the most popular).

            For example, NEO was one of the first coins to be listed on Binance and was extremely popular
            in 2017.

            Chart 11 - NEO trading volume on Binance - Feb 28 2018 vs. Feb 28 2019

            As of February 28th, 2019, the contribution of the stablecoin pair volume to total Binance
            volume of NEO increased to 66%, compared to 45% a year ago, taking over the majority of ETH
            and BTC pair volumes.

            NEO is not alone; in fact, most of the assets didn’t even have a stablecoin pair on Binance in
            April 2018. Today, a large majority of the top market capitalization coins do have a “stable
            counterparty”.

https://docs.google.com/document/d/1aL92GScc-oR3XVDQd3vd4EiUZMLjalBCicB0Ritx_o4/edit#                                           10/11
3/20/2019 [March 2019] Binance Research - Crypto-correlations in the Spotlight - Google Docs
Table 1. Existence of stablecoin pairs on Binance
Asset DASH ETC XMR XRP ETH ZEC NEO DOGE XLM NEM LTC
February No No No No Yes No Yes - No - Yes
2018
February No Yes Yes Yes Yes Yes Yes - Yes Yes Yes
2019
This trend is not confined to crypto-to-crypto exchanges like Binance - fiat exchanges have
also started increasing the number of cryptoasset offerings on their platforms, thereby
providing more direct fiat onramps and trading pairs for altcoins. As an example, Coinbase has
17 cryptoassets (and 38 corresponding pairs) as of March 1st, 2019 and continues to explore
adding a variety of additional cryptoassets to the platform9.
Conclusion
In summary, large market-cap cryptoassets exhibited high correlations in USD returns, and
these correlations increased over the course of 2018. Conversely, crypto-asset correlations in
BTC returns decreased over the same period.
While these changes in correlations coincided with the rise in stablecoin volume and stablecoin
trading pair offerings across exchanges, the analysis reveals additional idiosyncratic factors
that should be considered when constructing an optimal cryptoasset portfolio.
As this report primarily relied on large market-cap cryptoassets and their performance over a
limited time horizon (15 months) that was predominantly a bear market, further analysis across
longer time periods, small / medium market-cap assets and additional macro environments can
be conducting to augment these findings.
Binance Research provides in-depth analysis and data-driven insights of digital assets by generating unbiased,
institutional-grade research reports for investors in the crypto space.
9
https://blog.coinbase.com/coinbase-continues-to-explore-support-for-new-digital-assets-92ba4ab7f465/
https://docs.google.com/document/d/1aL92GScc-oR3XVDQd3vd4EiUZMLjalBCicB0Ritx_o4/edit# 11/11You can also read