Can Tax Reform Get Us to 3 Percent Growth?
←
→
Page content transcription
If your browser does not render page correctly, please read the page content below
Can Tax Reform Get Us to
   3 Percent Growth?
                Jason Furman
     Harvard Kennedy School &
  Peterson Institute for International
             Economics
 New York Association for Business Economics
                New York, NY
              November 3, 2017
      Harvard Kennedy School | 79 John F. Kennedy Street | Cambridge, MA 02138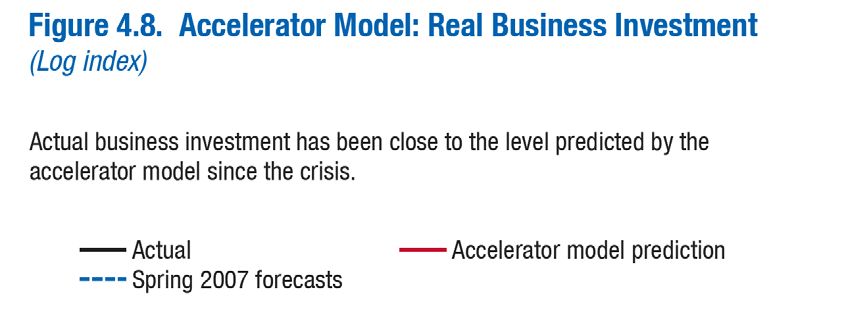
Outline
1. Our ~2 Percent Growth Rate Is Largely Due to
   Demography

2. Well-designed Tax Reform Could Have Modest but
   Worthwhile Benefits

3. The House Bill Is Not Well Designed

4. The Seven Deadly Sins of Overly Optimistic
   Dynamic Scoring

5. A Better Path Forward
Outline
1. Our ~2 Percent Growth Rate Is Largely Due to
   Demography

2. Well-designed Tax Reform Could Have Modest but
   Worthwhile Benefits

3. The House Bill Is Not Well Designed

4. The Seven Deadly Sins of Overly Optimistic
   Dynamic Scoring

5. A Better Path Forward
1. Our ~2 Percent Growth Rate Is Largely Due to Demography

         Growth has slowed from the 1980s primarily
              because of the aging population
                                 Prime-Age (25-54) Population Growth, 1945-2016
                             Percent Change, Annual Rate (Ten-Year Trailing Average)
                             2.5

                              2.0

                              1.5

                              1.0

                              0.5

                              0.0

                            -0.5
                                1955               1965          1975   1985   1995   2005   2015

Source: Social Security Administration; author’s calculations.
1. Our ~2 Percent Growth Rate Is Largely Due to Demography
Growth forecasts are consistent with historical
productivity and current demography
Potential GDP Growth Under Different Productivity Scenarios,
2016-2026
Historical: CBO Reagan era productivity,
1966-2016 forecast CBO demographic forecast
Potential Labor Force 1.5 0.5 0.5
Productivity Growth 1.9 1.7 1.6
Other -0.5 -0.3 -0.3
Potential GDP 2.9 1.8 1.7
Source: Congressional Budget Office; Bureau of Economic Analysis; author’s calculations.1. Our ~2 Percent Growth Rate Is Largely Due to Demography
The productivity slowdown has been across
almost all the advanced economies
Productivity Growth in the G-7, 1970-2015
Percent Change, Annual Rate (Five-Year Trailing Average)
4.0
2015
3.5
3.0
2.5
2.0
1.5
1.0
0.5
0.0
1975 1985 1995 2005 2015
Source: Organisation for Economic Co-operation and Development; author’s calculations.1. Our ~2 Percent Growth Rate Is Largely Due to Demography
Hard to see high U.S. taxes and burdensome
regulation in the recent investment data
Business Fixed Investment Growth in G-7 Countries,
2011-2016
Percent Change, Annual Rate
5
4.0
4 3.4
3.1
3
1.9
2
0.7
1
0
-1
-2 -1.5
-3
Canada France Germany Japan United United
Kingdom States
Average Corporate
26% 37% 30% 35% 22% 39%
Tax Rate:
Note: Corporate tax rate is the average combined (central and sub-central) corporate tax rate for 2012-2016.
Source: OECD Global Economic Outlook, June 2017; Organisation for Economic Co-operation and Development; author's calculations.1. Our ~2 Percent Growth Rate Is Largely Due to Demography
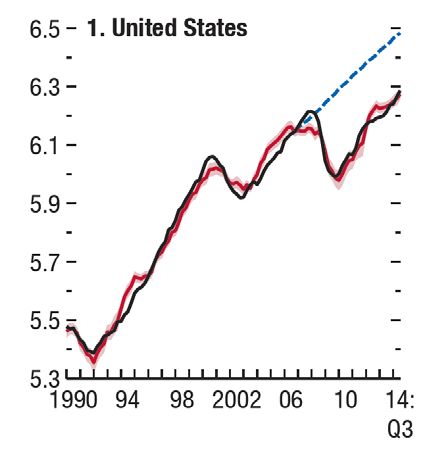
Moreover, U.S. investment growth is well
explained by standard accelerator models
Source: International Monetary Fund, World Economic Outlook (April 2015).1. Our ~2 Percent Growth Rate Is Largely Due to Demography
An aside: Maybe the real surprise is that growth
rates are much higher than expected
Projected Economic Growth Rates for 2015
(Percent)
Real GDP Growth
GAO (1992) *
Kerrey-Danforth (1994) 1.5
CBO (1996) 1.3
Social Security Trustees
1995 1.6
2000 1.9
2005 2.1
Note: *Approximately zero.
Note: GAO forecast is for real GNP.
Source: Congressional Budget Office; Government Accountability Office; Bipartisan Commission on Entitlement and Tax Reform; The Board of Trustees, The Federal Old-Age
and Survivors Insurance, and Disability Insurance Trust Funds; author's calculations.Outline 1. Our ~2 Percent Growth Rate Is Largely Due to Demography 2. Well-designed Tax Reform Could Have Worthwhile but Modest Benefits 3. The House Bill Is Not Well Designed 4. The Seven Deadly Sins of Overly Optimistic Dynamic Scoring 5. A Better Path Forward
2. Well-designed Tax Reform Could Have Worthwhile but Modest Benefits

         The business tax system has numerous
                       distortions
•    High statutory rates with many opportunities for
     avoidance

•    Different tax rates on different types of investment (e.g.,
     mining vs. manufacturing)

•    Heavy tax favoritism for debt over equity

•    Tax advantages for pass-through businesses

•    “Stupid Territorial” international system raises little
     revenue while creating distortions
2. Well-designed Tax Reform Could Have Worthwhile but Modest Benefits
Not time for tax cuts—if anything Bipartisan fiscal plans
have called for cutting spending and raising revenue
Revenue and Debt as a Share of GDP At Time of
Previous and Proposed Tax Cuts
1981 2001 2017
Revenue (% of GDP) 19.1 18.8 17.3
Debt (% of GDP) 25.2 31.4 76.7
Source: Congressional Budget Office.2. Well-designed Tax Reform Could Have Worthwhile but Modest Benefits
What a sensibly reformed business tax would
look like
• Expensing investment & eliminating interest
deductions would eliminate the tax on the normal return
to investment.
• Lowering the corporate rate as much as we can afford
without raising the deficit would modestly help in reducing
the pressure on transfer pricing etc.
• Reducing the tax benefits for pass-throughs to level
the playing field
• Minimum tax on foreign subsidiary income to reduce
distortions by balancing competing incentives2. Well-designed Tax Reform Could Have Worthwhile but Modest Benefits
Comprehensive estimates show well-
designed, paid for reform could deliver a
modest but real increase to GDP levels
Select Estimates of the Effect of Tax Reform on the Level of Output
Source Policy Change Short-Run Long-Run
Gravelle (2014) Stylized Reform: 20% Reduction in Income Tax Rates n. r. 0.7 - 4.0
JCT (2014) Camp Plan 0.1 - 1.6 n. r.
Treasury (2006) President's Advisory Panel on Tax Reform
Simplified Income Tax 0.0 - 0.4 0.2 - 0.9
Growth and Investment Tax 0.1 - 1.9 1.4 - 4.8
Progressive Consumption Tax 0.2 - 2.3 1.9 - 6.0
JCT (2005) 20% Cut in Federal Corporate Tax Rate
Not Financed 0.2 - 0.4 0.0 - 0.3
Financed with Future Spending Cuts 0.2 - 0.4 0.5 - 0.9
Altig et al. (2001) Stylized Revenue-Neutral Tax Reforms
Flat Tax with Transition Relief 0.5 1.9
n. r. = Not reported.
Note: Output measure is (in order of preference if multiple measures are reported) national income, real gross national product, and real gross domestic product. Time period for
short-run effects varies across studies, but (in most cases) is an average over several years in the first decade. Long-run effects typically reflect estimates of the change in the
steady state level of output.
Source: Furman (2016).Outline 1. Our ~2 Percent Growth Rate Is Largely Due to Demography 2. Well-designed Tax Reform Could Have Modest but Worthwhile Benefits 3. The House Bill Is Not Well Designed 4. The Seven Deadly Sins of Overly Optimistic Dynamic Scoring 5. A Better Path Forward
3. The House Bill Is Not Well Designed

Issues with business side of the House bill from
   an aggregate macroeconomic perspective
•    Large increase in the deficit

•    Sunsetting major provisions, like expensing, adds substantial
     uncertainty. (Additional sunsets will be needed in the Senate
     bill)

•    Expensing without eliminating interest deductions creates
     very negative tax rates on debt finance at the corporate level

•    Rate reductions provide a large windfall for investments
     already made and monopoly profits

•    New pass-through loophole is complicated and distortionary
3. The House Bill Is Not Well Designed
An aside, little/no effective rate reduction on the
individual side
For example, consider the marginal tax on an additional $100
earned under current law (28 percent federal rate and 11
percent state rate) and the proposal (25 percent federal rate
and no State deduction) :
Current Law: 25% effective rate
28% * ($100 - $11) = $25
Cut rate 25% and eliminate SALT: 25% effective rate
25% * $100 = $253. The House Bill Is Not Well Designed
In fact, effective tax rates go up on high-income
households
Now consider a household in the 39.6 percent bracket:
Current Law: 35% effective rate
39.6% * ($100 - $11) = $35
Cut rate 25% and eliminate SALT: 40% effective rate
39.6% * $100 = $403. The House Bill Is Not Well Designed
The tax cuts cost 0.8% of GDP and rising
(Note: 75-year fiscal gap ≈ 0.8% to 2.8% of GDP)
Cost of Tax Cuts
Percent of GDP
1.2
2027
Tax cuts assuming all
1.0 expiring provisions
made permanent
0.8
0.6
Tax cuts
0.4
0.2
0.0
2018 2020 2022 2024 2026
Source: Committee for a Responsible Federal Budget based on JCT estimates; Congressional Budget Office; author’s calculations.3. The House Bill Is Not Well Designed
Would bring the debt held by the public near
100 percent of GDP at the end of the decade
Debt Held by the Public
Percent of GDP
105
2027
100 CBO 99%
baseline + 97%
tax cuts +
95 extensions
CBO baseline
+ tax cuts 91%
90
CBO
85 baseline
80
75
2018 2020 2022 2024 2026 2028
Source: Committee for a Responsible Federal Budget based on JCT estimates.3. The House Bill Is Not Well Designed Macroeconomic effects of unpaid for tax cuts can become increasingly negative over time Short run: Keynesian effect. Goldman Sachs estimated 0.1 to 0.2 percentage point higher growth in 2018-19. Higher growth limited by economy at/near full employment and Federal Reserve offsetting higher demand. Long run: Deficits increasing drag. A wide range of macroeconomic models show that unpaid for tax cuts (or deferred financing) reduces economic growth, increases foreign borrowing, lowers wages, and raises the overall cost.
3. The House Bill Is Not Well Designed

      Modeling an earlier version of the Unified
   Framework + assumptions: GDP falls, GNP falls
    even more as we increase foreign borrowing
                              Macroeconomic Impacts of the Republican Unified
                                Framework Combined with TPC Assumptions
                            Percent Change
                            0.0

                           -0.1

                           -0.2

                           -0.3

                           -0.4

                           -0.5          GDP        GNP

                           -0.6

                           -0.7
                                             2027                2037
Source: Tax Policy Center (2017).
3. The House Bill Is Not Well Designed
Cutting the corporate rate to 20 percent is more
likely to reduce wages than to increase them
Change in Wages with 20% Corporate Tax Rate
Change in Average Household Wages Relative to Current Policy
(2016 Dollars)
1,500
2040
1,000 Optimistic
500
0
Base
-500
Pessimistic
-1,000
-1,500
2016 2021 2026 2031 2036
Note: Pessimistic: risk-free rate of return to capital and 0% foreign investment inflows. Optimistic: marginal product return to capital and 100% foreign investment inflows.
Source: Penn-Wharton Budget Model; CEA (2017); author's calculations.3. The House Bill Is Not Well Designed
Also to reduce GDP…
Change in GDP with 20% Corporate Tax Rate
Change in GDP Relative to Current Policy (Percent)
2.5
2040
2.0
1.5 Optimistic
1.0
0.5
0.0
Base
-0.5
-1.0
Pessimistic
-1.5
-2.0
-2.5
2016 2021 2026 2031 2036
Note: Pessimistic: risk-free rate of return to capital and 0% foreign investment inflows. Optimistic: marginal product return to capital and 100% foreign investment inflows.
Source: Penn-Wharton Budget Model; author's calculations.3. The House Bill Is Not Well Designed
…While substantially increasing the Federal
debt, by slightly more with dynamic scoring
Change in Debt (Dynamic) with 20% Corporate Tax Rate
Change in Debt as a Percent of GDP Relative to Current Policy
(Percentage Points)
20
2040
15 Pessimistic
Static
10
5 Base Optimistic
0
2016 2021 2026 2031
2036
Note: Pessimistic: risk-free rate of return to capital and 0% foreign investment inflows. Optimistic: marginal product return to capital and 100% foreign investment inflows.
Source: Penn-Wharton Budget Model; author's calculations.3. The House Bill Is Not Well Designed
This is why we need a Joint Committee on
Taxation dynamic analysis and dynamic score
Different models have different results, none of the
previous were models of this particular tax plan.
Need a model that incorporates: (1) the actual tax
changes; (2) the effects of deficit financing; and (3) a
realistic transition path.
JCT is not all knowing, but better than the alternatives.Outline 1. Our ~2 Percent Growth Rate Is Largely Due to Demography 2. Well-designed Tax Reform Could Have Modest but Worthwhile Benefits 3. The House Bill Is Not Well Designed 4. The Seven Deadly Sins of Overly Optimistic Dynamic Scoring 5. A Better Path Forward
4. The Seven Deadly Sins of Overly Optimistic Dynamic Scoring

      The seven deadly sins of overly optimistic
                 dynamic scoring

1.    Rely on studies that assume tax cuts are paid for, often in a lump sum manner

2.    Use estimates from “similar” tax plans that are not similar—for example, plans
      that tax old capital rather than provide it a windfall

3.    Use short-run Keynesian estimates or very long-run steady-state estimates for
      ten-year changes

4.    Ignore the details of tax reform

5.    Ignore the way that foreign borrowing will reduce future National Income.

6.    Rely on the study of different economies with different circumstances and
      different tax changes to infer the impact on the United States.

7.    Cherry pick parameters from studies.
4. The Seven Deadly Sins of Overly Optimistic Dynamic Scoring
See for example this recent WSJ op-ed
Eddie Lazear (Stanford University) (WSJ, 2017):
“Plans similar to the Big Six proposal have been scored in
the past. In 2005 the Advisory Panel on Federal Tax Reform
(of which I was a member) proposed a plan that would
create about 5% additional growth. When I served in the
White House as chairman of the Council of Economic
Advisers in 2006-09, the Treasury Department estimated
that going to full expensing—in which businesses can
deduct immediately all investment expenditures from
taxable earnings—would produce the same 5% growth.”4. The Seven Deadly Sins of Overly Optimistic Dynamic Scoring Use the upper end of the range for the long run (in the Bush Commission’s paid for reform plan) Source: Department of the Treasury, Office of Tax Analysis (2006).
4. The Seven Deadly Sins of Overly Optimistic Dynamic Scoring

        Even though the ten-year numbers are much
                          lower

Source: Department of the Treasury, Office of Tax Analysis (2006).
4. The Seven Deadly Sins of Overly Optimistic Dynamic Scoring
And the growth is generated by a large
consumption decline due to taxing old capital
Source: Department of the Treasury, Office of Tax Analysis (2006).4. The Seven Deadly Sins of Overly Optimistic Dynamic Scoring
The other model cited was to eliminate
corporate taxes and replace with a VAT
Treasury (2007):
Source: Department of the Treasury, Office of Tax Analysis (2007).4. The Seven Deadly Sins of Overly Optimistic Dynamic Scoring
And Treasury found this reduced after-tax
wages
Treasury (2007):
Source: Department of the Treasury, Office of Tax Analysis (2007).4. The Seven Deadly Sins of Overly Optimistic Dynamic Scoring
Many macro models assume lump-sum
financing, growth at the expense of
distribution—consider Mankiw’s toy example
Mankiw model: Assuming the United States is a small open
economy, $200b business tax cut paid for lump sum tax of
$1,600 per household. Raises wages by $300b, or 3%.
For a household making $50,000 and no capital income:
• Wage increase $1,500
• Tax change - $1,600
• After-tax income change: -$1004. The Seven Deadly Sins of Overly Optimistic Dynamic Scoring
The details matter: for example, many
companies would have interest deductibility
and thus negative rates under the House bill
Corporate Taxation of a $100 Investment with Expensing
After-tax After-tax Rate of Marginal
Corporate Tax Cost Return Return Tax Rate
No corporate tax $100 $10 10% 0%
20% corporate tax, no interest deduction $80 $8 10% 0%
20% corporate tax, maintain interest deduction $80 $8.80 11% -10%
Note: Interest rate = 4%4. The Seven Deadly Sins of Overly Optimistic Dynamic Scoring
For companies that can deduct interest the
lower corporate rate raises marginal rates
Effective Marginal Tax Rate vs. Statutory Tax Rate
under Interest Deductibility
Effective Marginal Tax Rate
6%
4% 3%
2%
0%
-2%
-4%
-6%
-6%
-8%
35% Statutory Rate 20% Statutory Rate
Source: Jensen, Mathur, and Kallen (2017); author's calculations.4. The Seven Deadly Sins of Overly Optimistic Dynamic Scoring
Broader lessons
• Tax reform can involve tradeoffs. For example, taxing old
capital can reduce distortionary taxes and increase growth.
(House bill is a windfall for old capital.)
• Most estimates of macroeconomic tax reform have been
relatively small.
• Need comprehensive, non-partisan, professional modeling.Outline 1. Our ~2 Percent Growth Rate Is Largely Due to Demography 2. Well-designed Tax Reform Could Have Modest but Worthwhile Benefits 3. The House Bill Is Not Well Designed 4. The Seven Deadly Sins of Overly Optimistic Dynamic Scoring 5. A Better Path Forward
5. A Better Path Forward
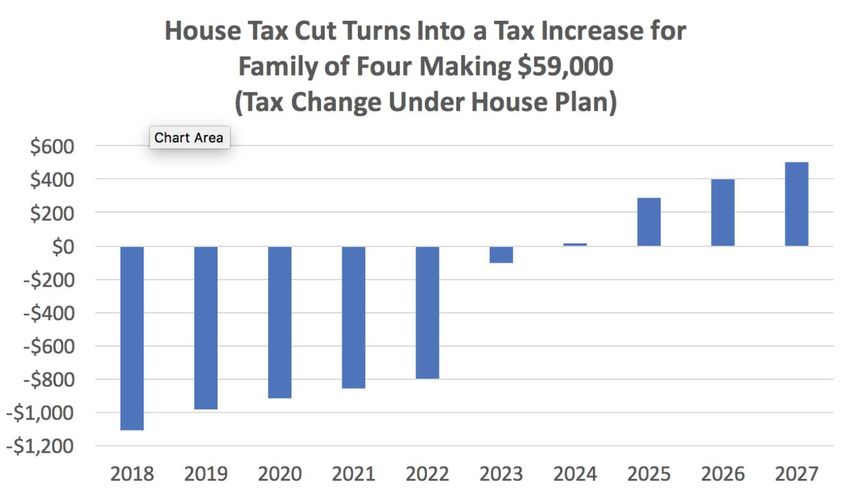
Also serious issues on the distributional side,
like the sample family the House used
Source: Kamin (2017).5. A Better Path Forward
This is not a special case—the House bill raises
individual taxes on non-business households
over time
Value of Tax Cuts
Billions of Dollars
100
2027
80
Individual
60
40 Estate Tax
20
Tax Cut
0
Tax Increase
-20
2018 2020 2022 2024 2026
Note: Individual excludes the new rate for pass-throughs.
Source: Author’s calculations based on JCT (2017).5. A Better Path Forward
Even if these issues were solved (and they are
large issues) the plan would still have major
problems
• Still much larger increases in after-tax incomes for high-
income households than low-income households.
• Many households, including 16 million children, entirely or
largely left out.
• Over time, deficit financing would hurt many more.5. A Better Path Forward
Some elements of a solution
• Make the entire tax code permanent, stable and predictable. This
requires revenue neutrality.
o Permanent expensing & eliminate interest deductions
o Much smaller corporate rate reduction
• Expand broad public buy-in and benefits, at a minimum this
requires distributional neutrality.
o Do not cut/repeal the estate tax or add a pass-through loophole
o Do expand refundable child tax credits and childless EITC.
Only possible to do this in a bipartisan manner. Easier to get 70 out
of 100 Senators for genuine reform than 50 out of 52 Republicans.Can Tax Reform Get Us to
3 Percent Growth?
Jason Furman
Harvard Kennedy School & Peterson
Institute for International Economics
New York Association for Business Economics
New York, NY
November 3, 2017
Harvard Kennedy School | 79 John F. Kennedy Street | Cambridge, MA 02138You can also read