Go for zero: How Australia can get to zero COVID-19 cases - Stephen Duckett and Will Mackey

Page created by Alberto Erickson
 
CONTINUE READING
Go for zero: How Australia can get to zero COVID-19 cases - Stephen Duckett and Will Mackey
Go for zero: How Australia can get to
               zero COVID-19 cases
            Stephen Duckett and Will Mackey
Go for zero: How Australia can get to zero COVID-19 cases - Stephen Duckett and Will Mackey
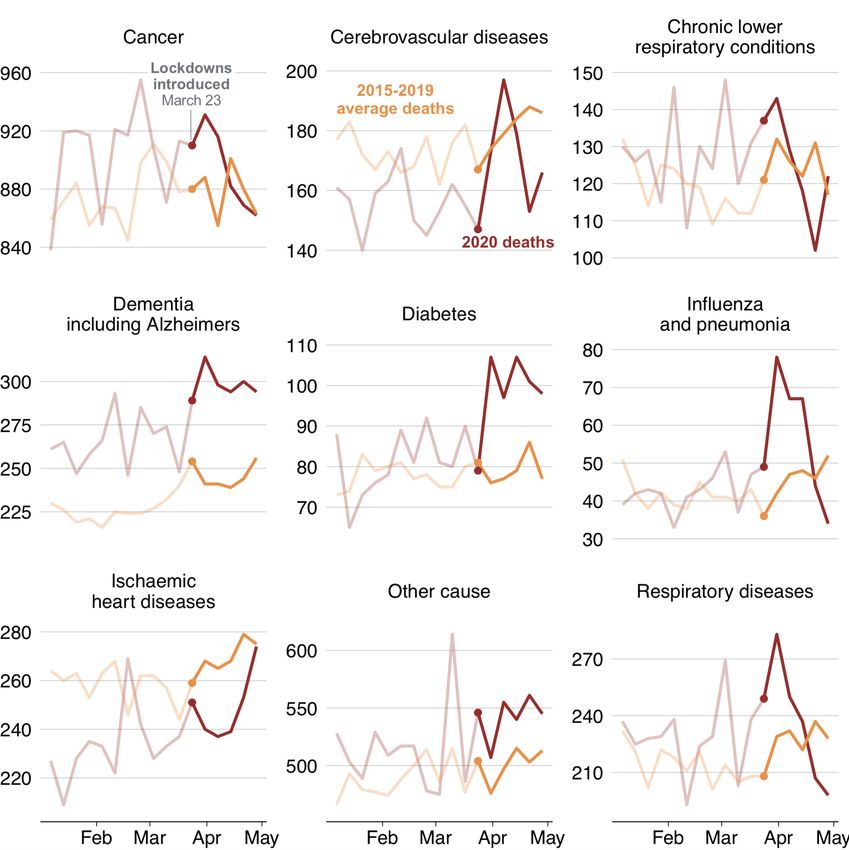
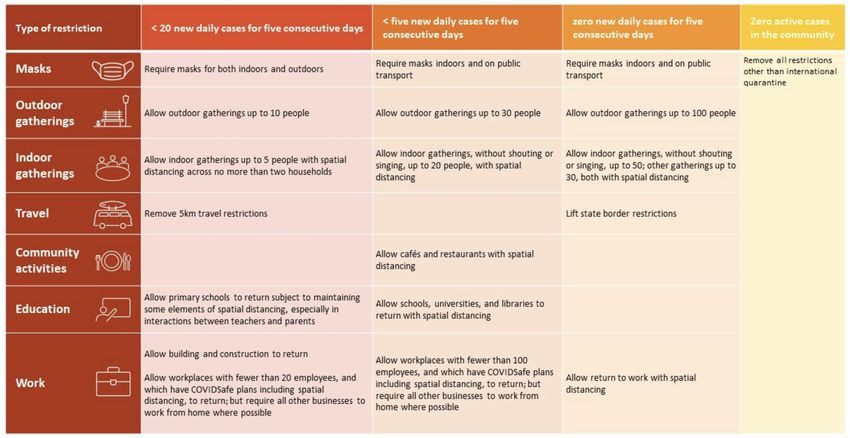
A staged ‘smarter restrictions’ strategy
Our recommendation

                                           2
Go for zero: How Australia can get to zero COVID-19 cases - Stephen Duckett and Will Mackey
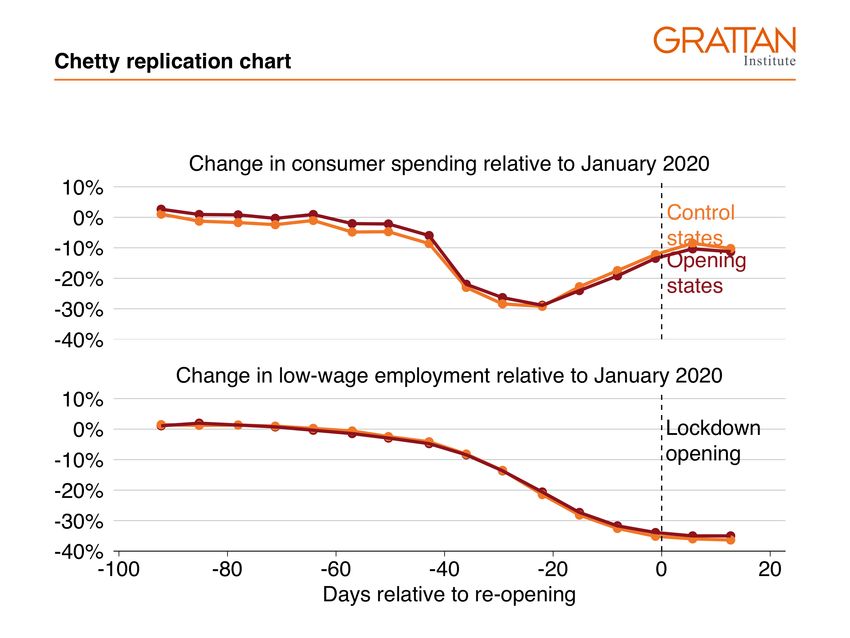
Australia has managed to drive down COVID-19 cases
everywhere except Victoria
New cases from all sources
                     Aus                                            NSW                              Vic
                                              200
600                                                                                    600
                                              150
400                                                                                    400
                                              100
200                                             50                                     200
  0                                               0                                      0
                     Qld                                              SA                             WA
                                                                                        40
60                                              30
                                                                                        30
40                                              20                                      20
20                                              10                                      10
  0                                               0                                      0
                     Tas                                              NT                            ACT
15                                                6                                    12.5
                                                                                       10.0
10                                                4
                                                                                        7.5
  5                                               2                                     5.0
                                                                                        2.5
  0                                               0                                     0.0
          Mar      May        Jul      Sep                Mar      May     Jul   Sep          Mar   May    Jul   Sep

                                                                                                                   3
Source: Data from state and territory updates, collated by Barry (2020)
Go for zero: How Australia can get to zero COVID-19 cases - Stephen Duckett and Will Mackey
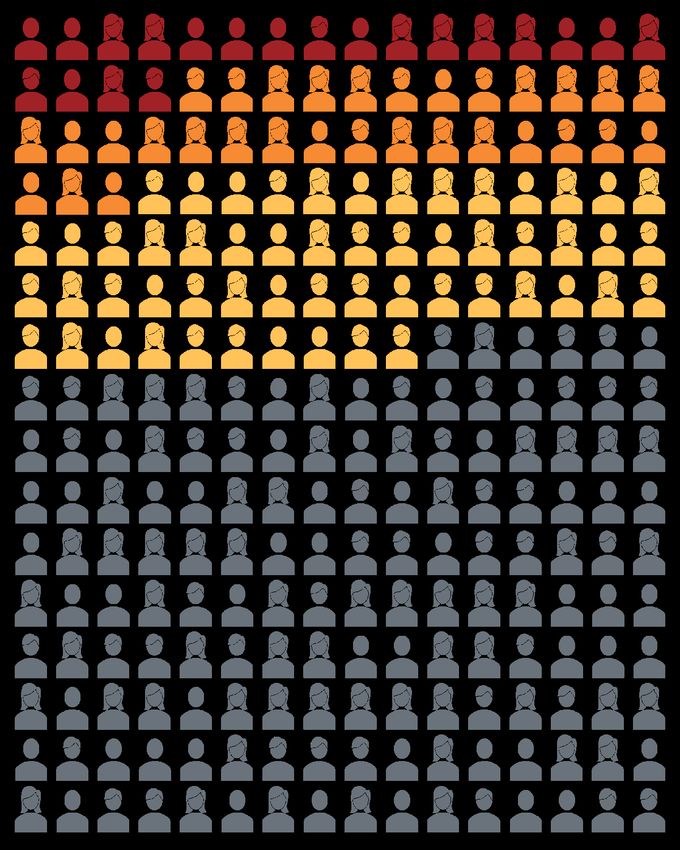
People had more contacts and were less likely to follow
 social distancing in July compared to April
Number of non−household
contacts per day
Proportion of people breaking                                              Number of non-household
the 1.5m distance rule                                                     contacts per day
80                                                                        12.5
         Start of July

                                                                          10.0
60

                                                                            7.5

40
                                                                            5.0
         Mid−April

20
                                                                            2.5

 0                                                                          0.0
     NSWVic Qld SA WA Tas NT ACT                                                  NSWVic Qld SA WA Tas NT ACT
Notes: The shaded areas show 90 per cent confidence intervals. Mid-April figures are from peak adherence levels around April 8 (for
                                                                                                                                      4
contacts) and April 12 (for distancing). Source: Golding et al 2020
Go for zero: How Australia can get to zero COVID-19 cases - Stephen Duckett and Will Mackey
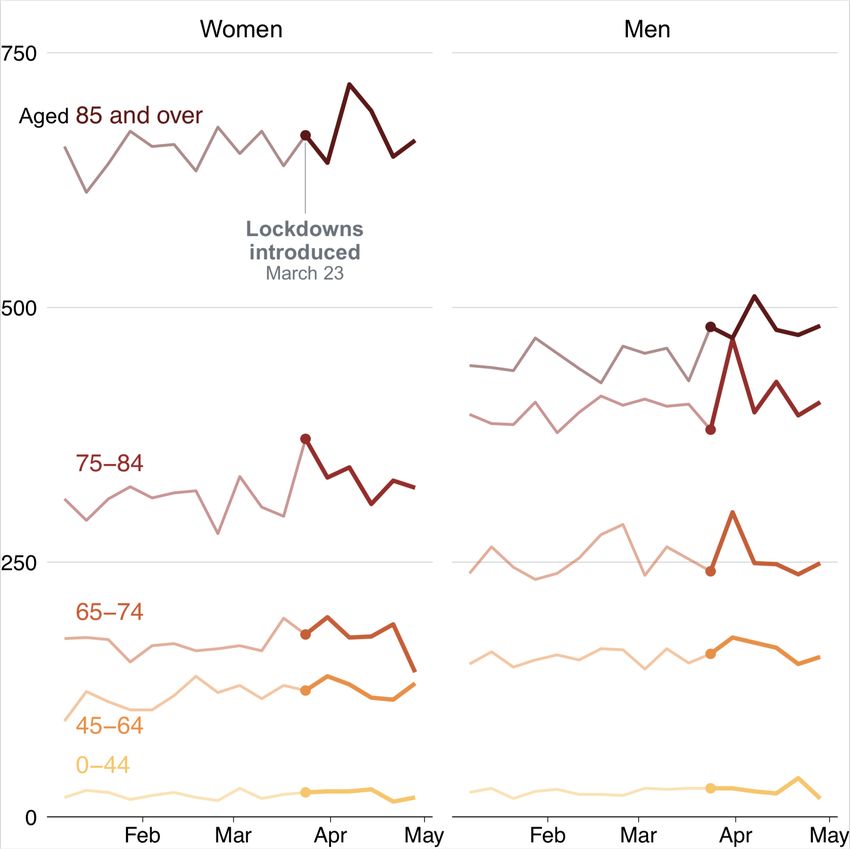
Victoria had eight times more local cases in the second
wave as it did in the first
New cases per day, excluding cases from overseas

600

400

200

   0
                     Mar         May               Jul    Sep
                                                            5
Source: Barry 2020
Go for zero: How Australia can get to zero COVID-19 cases - Stephen Duckett and Will Mackey
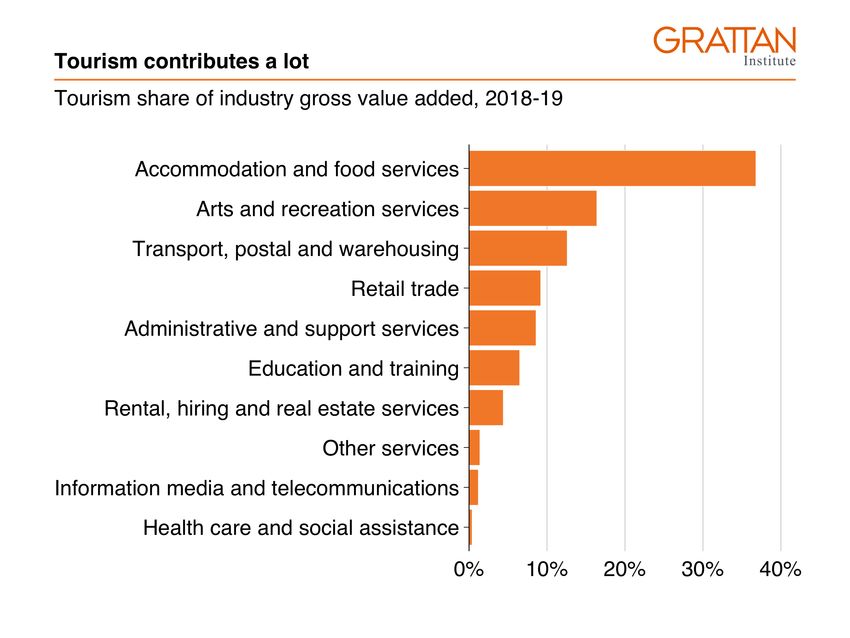
Local cases continue to appear in NSW
New cases per day, excluding cases from overseas

60

40

20

 0
                     Mar        May                Jul   Sep
                                                           6
Source: Barry 2020
Go for zero: How Australia can get to zero COVID-19 cases - Stephen Duckett and Will Mackey
Many countries are suffering a second wave
Daily confirmed cases of COVID-19

                   Australia                                        Belgium                                            Brazil
 500                                          1,600
                                                                                              40,000
 400                                          1,200                                           30,000
 300                                            800
 200                                                                                          20,000
 100                                            400                                           10,000
   0                                              0                                                0

                     France                                        Germany                                             India
4,000                                         5,000                                           60,000
3,000                                         4,000
                                              3,000                                           40,000
2,000                                         2,000
1,000                                                                                         20,000
                                              1,000
    0                                             0                                                  0

                      Italy                                          Mexico                                            Spain
                                                                                                8,000
5,000                                         6,000
4,000                                                                                           6,000
3,000                                         4,000                                             4,000
2,000                                         2,000
1,000                                                                                           2,000
    0                                             0                                                 0

                    Sweden                                     United Kingdom                                      United States
1,250                                                                                         60,000
1,000                                         4,000
  750                                         3,000                                           40,000
  500                                         2,000
                                              1,000                                           20,000
  250
    0                                             0                                                  0
            Apr               Jul                           Apr               Jul                            Apr                Jul
                                                                                                                                      7
Notes: Rolling 7-day average. Actual figures are likely to be larger due to undetected cases. Source: Roser et al (2020)
Go for zero: How Australia can get to zero COVID-19 cases - Stephen Duckett and Will Mackey
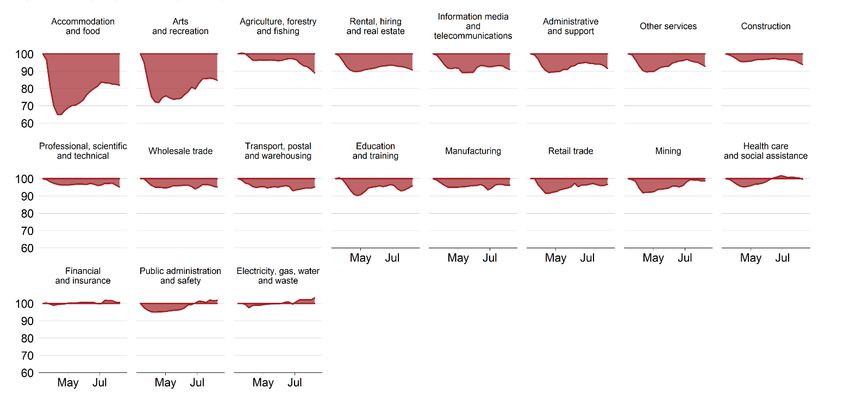
Lockdowns reduced movement more in NZ and western
Europe than in Australia
Daily movement compared to pre-COVID trend

                     Australia        New Zealand                Italy
   0%
−20%
−40%
−60%
−80%
                          Spain          France            United Kingdom
   0%
−20%
−40%
−60%
−80%
    Mar Apr May Jun Jul           Mar Apr May Jun Jul   Mar Apr May Jun Jul
                                                                              8
Source: Facebook (2020)
Go for zero: How Australia can get to zero COVID-19 cases - Stephen Duckett and Will Mackey
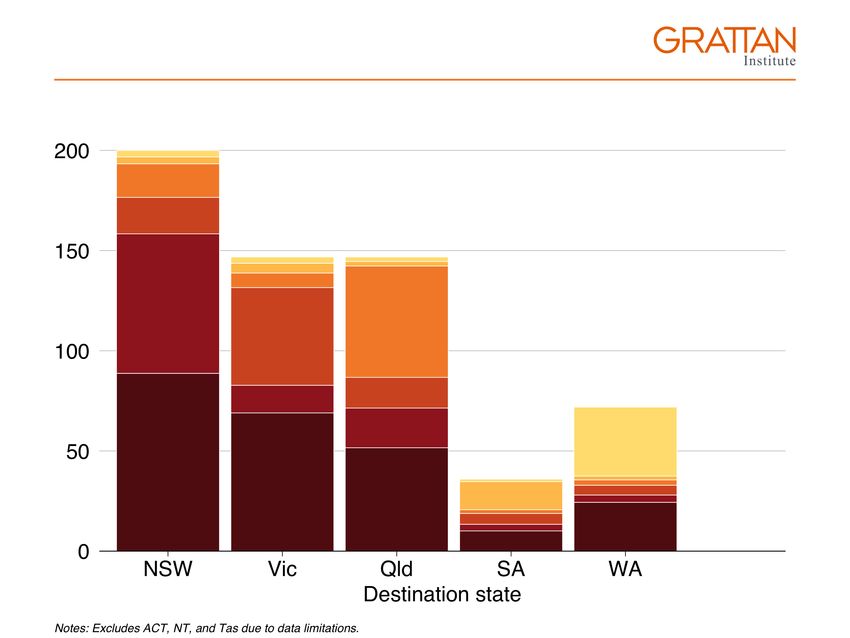
COVID-19 is not just a ‘bad flu’
Weekly deaths (all-cause mortality) in cities with substantial COVID-19
infections
                      Castilla La Mancha, Spain                                                      Guayas, Ecuador
 1,500                                                                  5,000
                                                                        4,000
 1,000                                   4,900 excess deaths            3,000
                                                                        2,000                                   14,700 excess deaths
   500                                                                  1,000
     0                                                                      0

                         Ile−de−France, France                                                           Lima, Peru
 4,000                                                                  3,000
 3,000                                 10,600 excess deaths             2,000
 2,000                                                                  1,000                                   25,400 excess deaths
 1,000
     0                                                                      0

                               London, UK                                                              Madrid, Spain
 3,000                                                                  5,000
                                                                        4,000
 2,000                                   9,600 excess deaths            3,000                                   15,600 excess deaths
 1,000                                                                  2,000
                                                                        1,000
     0                                                                      0

                   Metropolitana de Santiago, Chile                                                 Mexico City, Mexico
 2,000                                                                  4,000
 1,500                                                                  3,000                                   22,700 excess deaths
 1,000                                   8,400 excess deaths            2,000
   500                                                                  1,000
     0                                                                      0

                          Moscow city, Russia                                                        New Jersey, US
12,000                                   7,100 excess deaths            4,000
 8,000                                                                  3,000                                   16,700 excess deaths
 4,000                                                                  2,000
                                                                        1,000
     0                                                                      0

                           New York City, US                                                        Stockholm, Sweden
 8,000                                                                     600
 6,000
 4,000                                 27,200 excess deaths                400                                   2,300 excess deaths
 2,000                                                                     200
     0                                                                       0
         2016       2017        2018         2019        2020                    2016        2017        2018        2019        2020
                                                                                                                                              9
Notes: Data not available for some cities in some years. For full details see Financial Times 2020. Data collated by Financial Times (ibid)
Approaches to COVID-19 control around the world

         Australia          Japan       New
                                        New Zealand
                                            Zealand           Norway                   South Korea
                                                                             Singapore South Korea          Taiwan

                                                                                                                     Oxford stringency
                                                                                                                      Restriction
   75

                                                                                                                           index level Google mobility
   50
   25
    0

                                                                                                                                          Google mobility
    0
 −20

                                                                                                                                              index index
 −40
 −60

                                                                                                                                                        New daily
                                                                                                                                                             COVID-19
                                                                                                                                                                Daily new
1,000

                                                                                                                                                                  COVID−19
 500

                                                                                                                                                                        casescases
    0
        Apr Jul          Apr Jul           Apr Jul          Apr Jul           Apr Jul            Apr Jul   Apr Jul

                                                                                                                                                                          10
Sources: Hale et al (2020), Google (2020) and Johns Hopkins Coronavirus Resource Center (2020)
About 10 million Australians have at least one high-risk
factor for death or complications from a COVID-19 infection
                                                  Of 25 million Australians,
                        1.9 million (8%) have 3 or more attributes that put them at higher risk of death
                          and complications from COVID-19, such as age or chronic health conditions

                                                                                                   2.9 million (12%)
                                                                                                   have 2 attributes

                                                                                                   5.2 million (22%)
                                                                                                   have 1 attribute

                                                                                                    14 million (59%)
                                                                                                    have no attributes
                                                                                                    that put them at
                                                                                                    higher risk of
                                                                                                    COVID-19
                                                                                                    complications

                                                                                                100,000 people

Notes: ‘Risk factors’ are any factors identified by the Department of Health as having higher risk of ‘severe’ or ‘moderate’ complications
from a COVID-19 infection. The list includes several health conditions, being over 70 years of age, and being an Indigenous Australian.      11
Source: Grattan analysis of the National Health Survey and Department of Health advice for people at risk of coronavirus (COVID-19)
There has been an increase in suicide deaths during 2020
Cumulative annual deaths from suicide in Victoria

500                                                                                                                    2019
                                                                                                                       2018
                                                                                                                       2020
                                                                                                                       2017
                                                                                                                       2016
400

300

200

100

   0
       January                                       April                                       July
                                                                                                                              12
Notes: The figures for 2020 are as of 26 August, making comparisons imperfect. Source: Coroners Court of Victoria (2020)
There was a small spike in deaths at the end of March
Weekly deaths in 2020 and 2015-2019 (average)
                    2,800
                                                                                     2020 deaths
                                                                                     Preliminary data

                                                              Lockdowns
                                                               introduced
                                                                    March 23

                              2015-2019
                              maximum
                    2,600

                               2015-2019 average deaths
                    2,400

                              2015-2019
                              minimum

                                            Feb               Mar              Apr                      May

                                                                                                              13
Notes: Stage 1 lockdown began on 23 March. Source: ABS 2020
The March spike in deaths was among older people…
Weekly deaths in 2020 and 2015-19 (average)

                                                         14
Notes: Stage 1 lockdown began on 23 March. Source: ABS
…from dementia, diabetes, influenza, and respiratory
illness
Weekly deaths in 2020 and 2015-19 (average)

                                                         15
Notes: Stage 1 lockdown began on 23 March. Source: ABS
Overcrowded housing is most common amongst people
working in high−touch industries
Share of workers living in homes that require more bedrooms

            Accommodation and Food Services
           Administrative and Support Services
                                     Retail Trade
            Transport, Postal and Warehousing
                                   Manufacturing
                                  Other Services
                                     Construction
                   Arts and Recreation Services
             Health Care and Social Assistance
                                Wholesale Trade
   Information Media and Telecommunications
                Agriculture, Forestry and Fishing
Professional, Scientific and Technical Services
               Financial and Insurance Services
       Rental, Hiring and Real Estate Services
                          Education and Training
                                 Overseas visitor
    Electricity, Gas, Water and Waste Services
                Public Administration and Safety
                                          Mining
                                                 0%                                         2%          5%           8%         10%
Notes: The number of 'required' bedrooms is defined by the Canadian National Occupancy Scale as: one for each single or couple, and one for
each child over 5 years old. Two children of the same gender can share a bedroom.                                                        16
Source: Census 2016
Removing lockdown restrictions doesn’t guarantee a return
to normal
OpenTable restaurant bookings in US states that have come out of lockdown

 100

   50

      0

  -50                                                                                         South Carolina
                                                                                                   Oklahoma Texas
                                                                                                             Florida
                                                                                                             Missouri
                                                                                                             Georgia
-100
            Mar                                        Apr                                      May
Notes: Grey colour represents all other states that have restaurant booking data and which had not lifted lockdowns. Source: Analysis   17
of OpenTable data based on The Economist
US states which re-opened didn’t see significant gains in
either consumer spending or employment

Notes: The authors estimate the impact of re-opening using a difference-in-differences model, and find that the effect is insignificant at   18
any reasonable confidence level. Source: Chetty et al
A second wave of COVID-19 will further damage the
economy
Quarterly GDP, indexed to 2019 Q4

Notes: For the single-wave scenario, the OECD modelling assumes that ‘countries successfully overcome the current outbreak due to the
containment measures put in place in the first half of 2020.’ In the double-wave scenario, the ‘current easing of containment measures is   19
assumed to be followed by a second, but less intensive, virus outbreak taking place in October/November’. Source: OECD
More people from poor areas are unemployed
Proportion of people in each state who received JobSeeker payments by
socioeconomic decile, March-June
                      NSW                                        Vic                                      Qld
15%

10%

 5%

 0%
                        SA                                       WA                                       Tas
15%

10%

 5%

 0%
       1 2 3 4 5 6 7 8 9 10 1 2 3 4 5 6 7 8 9 10 1 2 3 4 5 6 7 8 9 10
                             Socioeconomic status
Notes: JobSeeker recipients by SA2s matched with SEIFA Index of Relative Socioeconomic Advantage and Disadvantage (IRSAD)   20
deciles. Sources: DSS and ABS
Consumer spending has recovered more strongly in
states which have contained COVID-19
Weekly consumption index per person, indeed to normal weekly base
excluding Christmas

Notes: Based on a weekly transaction sample of 250,000 Australian consumers. The state trends broadly align with the ABS retail   21
statistics. Source: Wade analysis of AlphaBeta
22
Consumer spending in NZ has closely followed the
lockdown stringency

                                                                                23
Note: spending measures credit card spending. Source: Treasury and Hale et al
Small business revenue has already returned to pre-
COVID levels in New Zealand
Change in small business revenue compared with 12 months ago

                                                               24
25
COVID-19 caused a spike in uncertainty about economic
policy in Australia
Economic Policy Uncertainty Index, Monthly

400

                                   US debt ceiling
                                                     Federal election

300                                 GFC                        COVID-19

            9/11
                   Iraq invasion                     Rudd
                                                     ousts
200
                                                     Gillard

100

  0
          2000           2005         2010            2015              2020
                                                                               26
The implied volatility of the Australian stock market has
been at its highest level since the GFC
S&P ASX200 VIX, daily

80

              GFC peak
60          (20 Nov 2008)
                                                    COVID-19 peak
                                                    (18 March 2020)

40

20

 0
     2005               2010                 2015               2020
                                                                       27
Tourism supports numerous sectors
Tourism share of industry gross value added, 2018-19

                                                       28
Source: ABS
Most domestic tourism occurs within states
Total visitor nights, millions, year ending March 2020

                                                         29
Payroll jobs index by industry, benchmarked to 14 March
2020

                                                                                                       30
Notes: industries are ordered by the decline in the payroll jobs index between 14 March and 8 August
31
Workers aged under 30 were the most likely to have lost
their jobs
Weekly payroll jobs index, benchmarked to 14 March 2020

105

           14 March                                                                                             Under 20
100
                                                                                                              50-59
                                                                                                                    40-49
 95                                                                                                           30-39
                                                                                                                  60-69
                                                                                                               20-29
 90

 85

 80

 75
                 Apr                  May                    Jun                   Jul                  Aug            Sep

Notes: Excludes workers aged 70 and over, who can access the age pension as well as their superannuation savings.            32
Source:ABS Weekly Payroll Jobs and Wages in Australia, Week ending 11 July 2020
Melbournians were slow to respond to the second round
of lockdowns
Mobility compared to January

                       Melbourne                 Sydney

100

                                                                 driving
                                                                 walking
                                                                 transit
 50

   0
       Mar Apr May Jun             Jul   Mar Apr May Jun   Jul
                                                                           33
Source: Apple (2020)
Across the board, most Australians were worried that
lockdowns had ended too quickly
Proportion of people who in mid-July were ‘more concerned about moving too
quickly to relax COVID-19 lockdowns and having the virus spread further and
more people get infected’
                 All               Age              Politics      Gender
  100%

    75%

    50%

    25%

     0%
             All       18−34 35−49 50−64 65+   ALP Greens LNP   Female Male
                                                                              34
Source: Benson
Victoria is likely to reach zero infectious cases by the end
of October if social distancing is maintained
Probability of reaching zero active COVID-19 cases in Victoria
                                       If social distancing is maintained, there is a 99%
                                     chance of reaching zero cases by the end of October
                      100%

                       75%

                                                           59%

                       50%                                           If social distancing decays,
                                                                          there is a 34% chance of
                                                                        reaching zero cases by the
                                                                                     end of October

                       25%

                                          4%
                                                                     6%

                         0%                                                                  1
                               Aug       Sep                   Oct                     Nov
                                                                                                      35
Source: Blakely et al (2020)
You can also read