COVID-19: Data Analysis and Modelling H. M. Antia Tata Institute of Fundamental Research email: web
←
→
Page content transcription
If your browser does not render page correctly, please read the page content below
COVID-19: Data Analysis and Modelling

             H. M. Antia
Tata Institute of Fundamental Research
        email: antia@tifr.res.in
  web: http://www.tifr.res.in/˜antia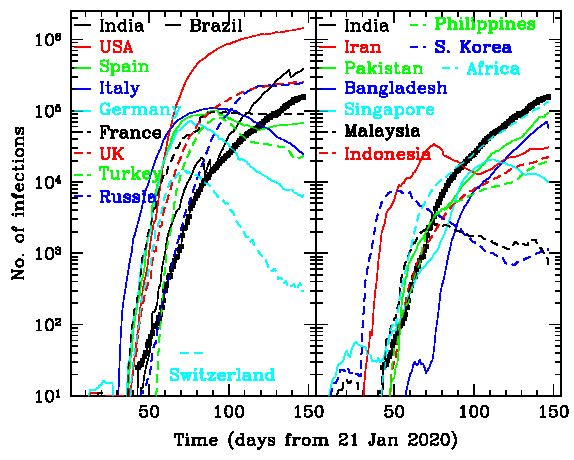
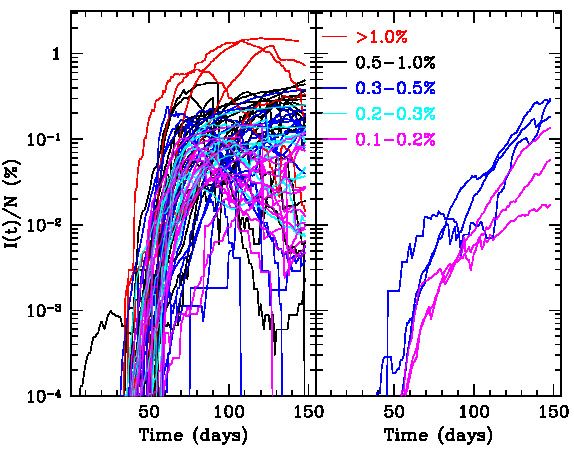
• Coronavirus Disease 2019 (COVID-19) is an infectious
  respiratory disease caused by Severe Acute Respiratory
  Syndrome Coronavirus-2 (SARS-Cov-2).

• First detected in Wuhan, China during Dec 2019 and on
  30 Jan 2020 WHO declared the outbreak a Public Health
  Emergency of International Concern.

• It has spread to 214 countries in all continents, except
  Antarctica and infected over 8 million persons and killed
  over 450,000.

• USA is the country that is worst affected with over 2
  million infections and over 110,000 deaths. India is now
  in the fourth position in terms of number of infections
  below Brazil and Russia.
• The fatalities from the Virus (450,000) can be compared
  with other causes (from Worldometer):
  Deaths this year 27,172,628
  Seasonal flu deaths this year: 225,108
  Deaths caused by malaria this year: 453,147
  HIV/AIDS infected people: 41,873,708
    deaths this year: 776,615
  Deaths caused by smoking this year: 2,309,453
  Deaths caused by cancer this year: 3,794,203
  Deaths of children under 5 this year: 3,511,545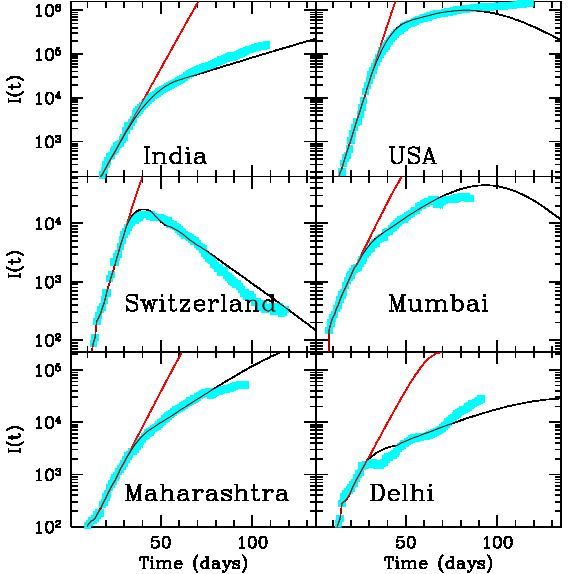
• India has had 367,000 infections and 12,000 deaths, which
  can be compared with
  9,778,073 deaths per year or 26,789 per day
  cancer causes 780,000 deaths per year
  TB causes 450,000 deaths per year
  traffic accidents kill 244550 per year or 670 per day
  infant mortality rate: 30 per 1000
• Symptoms: Fever, cough, shortness of breath, loss of
  smell
• Incubation period : 2–14 days, mean about 5 days
• Typical recovery time is 15 days, but could be much longer
  in severe cases.
• Probability of death with age: (Worldometer)
  < 40 years : 0.2%
  40–49 years : 0.4%
  50–59 years : 1.3%
  60–69 years : 3.6%
  70–79 years : 8.0%
  ≥ 80 years : 14.8%
• Average Infection Fatality Rate (IFR) depends on the age
  distribution of population. India has 6.2% population
  with ≥ 65 years. For Italy this is 23%.
• COVID-19 spreads mainly through respiratory droplets
  (> 5µm diameter) produced when an infected person
  coughs, sneezes or talks. These droplets do not typically
  travel more than 2 m in air.
• Indirect transmission can occur when these droplets fall
  on surfaces which are touched by others and then the per-
  son touches the mouth, nose or eyes. Typical surfaces are
  doorknobs, handrails, exercise equipment, medical equip-
  ment, cell phones, remote controls, etc. The virus can
  survive for up to 2–3 days on plastic or stainless steel
  surfaces.

• Small droplets can be generated in hospitals during pro-
  cedures which can transmit it to longer distances.
• Effectiveness of virus depends on how long the droplets
  can survive in the environment. This has been modelled
  and results appear to support longer lifetime in cold dry
  climate.
• Many infections probably happen indoors and ambient
  conditions there may be controlled, which may make some
  difference.
• Virus appears to thrive in cold dry places and is less effec-
  tive in hot places. This is borne out by the geographical
  distribution of infections. However, it is able to survive
  and infect people in all climatic conditions.
• As a result the growth rate of infection is higher in cold
  countries.
• Effectiveness of virus in humid conditions during monsoon
  is not clear.
• Although the IFR for COVID-19 is lower than other recent
  Coronaviuses like MERS and SARS, the infection spreads
  much more easily.
• Most infected people show only mild symptoms and re-
  cover without any treatment.
• A small fraction may need to be admitted to hospital and
  may have to be provided with oxygen.
• Infected people can transmit the disease before they show
  any symptoms (pre-symptomatic). This makes it difficult
  to control the spread of disease.
• Some infected people never show any symptoms (asymp-
  tomatic). It is not clear if these can transmit the disease.
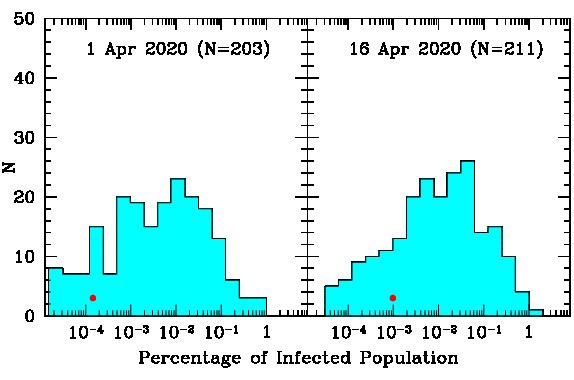
• To test for past infections we can use serological tests
  and look for antibodies to the virus in blood samples.
  These tests are not very reliable, though cheap and fast.
  These have consistently shown that number of potential
  infections is about an order of magnitude or more larger
  than the detected infections.

• It is not known if these people with antibodies are immune
  to infection, but it is generally believed that they would
  be immune. If that is the case then it means that the
  peak of infection would occur much earlier than expected
  from standard epidemiological models.
• Currently there is no medicine to cure the disease and
  no vaccine to prevent it. Just recently a steroid, Dexam-
  ethasone has shown some effect on patients who are on
  oxygen.
• To prevent the spread of disease the measures are iden-
  tifying and isolating infected people, tracing contacts of
  infected persons and isolating them, social distancing etc.
• Lockdown is an extreme measure which did not work in
  India.
• Once the disease starts spreading the growth is exponen-
  tial during the first few weeks, with a doubling time of 3–6
  days. After that the doubling time typically increases.
Data on Epidemic
• Source of data:
  https://www.worldometers.info/coronavirus/
  https://github.com/CSSEGISandData/COVID-19/
  https://api.covid19india.org/
• A measure of growth rate of epidemic is provided by the
  doubling time. The recovery time gives an average time
  for recovery.
• A measure of control of epidemic is provided by the stage
  then the second derivative of total infections changes sign,
  or when the daily infections each a peak value. Another
  milestone is when the number of active infections start
  decreasing.
country    fi   Infections     t2     tr      th      fh
          (%)                (days) (days)           (%)
USA       0.646 2137731       47.1   60.0    21Apr   0.244
Brazil    0.434 923189        18.1   14.7      -       -
Russia    0.373 544725        31.0   27.9    11May   0.152
India     0.026 354065        17.6   14.9      -       -
UK        0.439 298136        51.8   72.9    20Apr   0.184
Spain     0.523 244328        73.6   62.0    02Apr   0.240
Italy     0.393 237500        74.2   42.1    30Mar   0.168
Peru      0.719 237156        23.3   20.6    01Jun   0.516
Iran      0.229 192439        45.3   12.7    02Apr   0.060
France    0.290 189595        66.0   65.8    08Apr   0.126
Germany   0.225 188252        73.4   19.8    01Apr   0.093
Chile     0.965 184449        17.6    4.2    02Jun   0.569
Turkey    0.215 181298        57.1   21.6    13Apr   0.072
SIR model
• The simplest model is the Susceptible-Infectious-Recovered
model
I(j − ti )S(j − 1)
D(j) = α
N
R(j) = R(j − 1) + D(j − tr ) + βD(j)
I(j) = I(j − 1) + D(j) − D(j − tr )
S(j) = N − R(j) − I(j)
• β = 0 in the normal SIR model. ti = 5, tr =P 15 days.
The total detected infections would be given by j D(j).
• α can be estimated by fitting the solution to actual data
for a few days.• Here R(j) also includes the deaths as both recovered and dead persons are removed from the list of infected people. • If the infection fatality rate is known one can calculate the number of deaths. • Incompleteness of data. • Usual epidemiological models predict that infections will continue till about 50% of the population is infected and becomes immune. • These models assume that the population is homoge- neously distributed. This may be approximately true for a small region, but is unlikely to be applicable to whole country like India.
• There are more sophisticated models based on Monte-
  Carlo simulation of whole population and their interac-
  tion, but these have many assumptions and parameters.
• These models can only approximate the spread of infec-
  tion. The reality is much more complicated. The most
  important complication is due to large number of cases
  where persons have immunity even though they were not
  detected to be infected.
• In practice the models have to be tuned to match the
  observed data to whatever extent that is possible.
• Currently 214 countries have registered infections. Only
  two major countries, i.e., North Korea and Turkmenistan
  have not reported any infections. About 16 other coun-
  tries, mainly islands have not reported any cases.
• Out of these about 56 countries have reached close to the
  end of epidemic when the active infections are less than
  5% of total infections. While about half of the countries
  have the epidemic under control, at least, temporarily.
• Vietnam with a population of 97 million is the largest
  country which has not recorded any death with 335 in-
  fections of which 10 are currently active.
• Papua New Guinea and Laos are the largest countries to
  reach zero active infections and no deaths. There are 24
  other countries with zero active infections.
Status of epidemic on 16 June 2020
Continent fi Infections Deaths t2 tr
(%) (days) (days)
World 0.105 8173956 443685 37.3 33.5
N America 0.420 2476182 145783 45.0 53.9
Europe 0.296 2221367 183847 57.1 48.4
Asia 0.037 1697623 43787 27.7 17.2
S America 0.350 1507133 63082 19.1 15.3
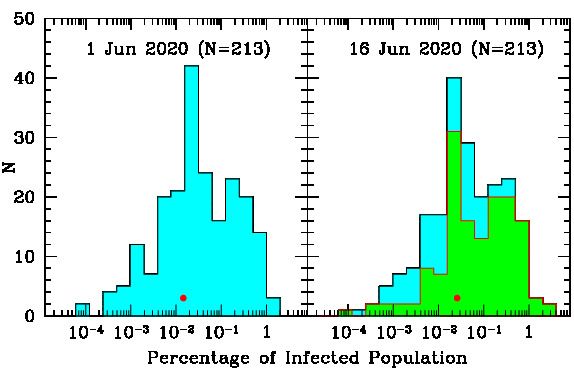
Africa 0.020 261939 7046 19.1 19.7Future outlook • To get the future course of epidemic we can look at data for countries with a large fraction (> 0.1%) of infected population (63 countries) • It turns out that a large fraction (90%) of these coun- tries have controlled the epidemic to some extent. Which shows that the limiting infection is about 2% depending on various factors, like population density, effectiveness of measures adopted and climatic and social conditions. • Currently all countries with > 0.5% infections have con- trolled the epidemic, only countries with > 0.1% infec- tions that have not yet controlled the epidemic are Oman, Brazil, French Guiana, Bolivia, South Africa and Mexico.
• Iran is the only major country in this list to have a signifi-
  cant second wave of infection. North Macedonia, Panama
  and Saudi Arabia also appear to have a second wave re-
  cently.
• Among the 56 countries which are close to end of epi-
  demic, 25 have infections exceeding 0.05%. Only coun-
  tries with infections exceeding 1000 that are at this stage
  with smaller infection rate are New Zealand, Hong Kong,
  China and Thailand.
• Currently 5 countries have infections exceeding 1%, i.e.,
  Qatar, San Marino, Vatican City, Andorra and Bahrain.
  The Gulf countries appear to have a large percentage of
  infections, either due to dry climate, high population den-
  sity or sociological factors.
• Only country to exceed deaths of 0.1% is San Marino.
  Other countries at the top of this table are not likely to
  reach that percentage. So this appears to be an upper
  limit to number of deaths.
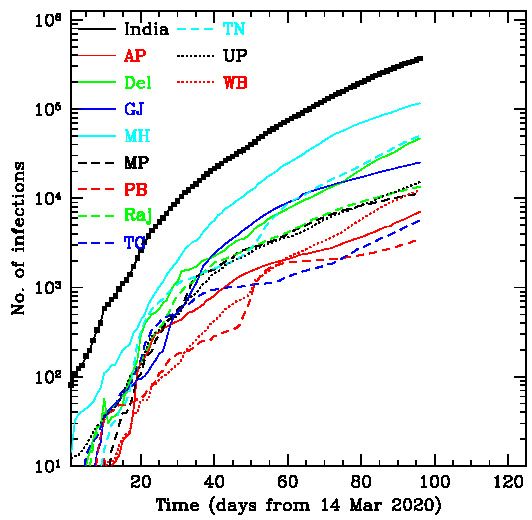
State         Infections Deaths     fi       t2     tr
                                   (%)     (days) (days)
India           367342   12262    0.0275    17.8    15.1
Maharashtra     116764    5650    0.0966    20.5    18.1
Tamilnadu        50196     576    0.0656    14.6    12.3
Delhi            47102    1904    0.2567    14.1    17.4
Gujarat          25155    1561    0.0394    27.9    12.2
UP               15185     465    0.0066    18.4    12.1
Rajasthan        13549     313    0.0173    24.9     9.4
W Bengal         12302     506    0.0126    15.0    12.5
MP               11244     483    0.0137    28.4    12.5
Haryana           8834     130    0.0323    10.1    10.7
Karnataka         7739     104    0.0117    14.7    11.8
AP                7071      90    0.0134    17.3    15.5
Bihar             6940      39    0.0058    18.5    11.1
District Infections Deaths fi t2 tr Mumbai 61587 3244 0.4990 23.8 20.6 Chennai 35556 458 0.7652 13.8 12.3 Thane 20167 642 0.1823 15.7 16.9 Ahmedabad 17629 1253 0.2899 29.5 12.4 Pune 13250 610 0.1405 21.0 16.0 Indore 4134 182 0.1262 35.4 20.4 Kolkata 4089 308 0.0909 18.1 19.9 Hyderabad 3764 23 0.0955 12.5 57.3 Aurangabad 2960 168 0.0800 16.8 11.5 Surat 2779 106 0.0385 21.9 9.2 Jaipur 2628 139 0.0397 35.5 8.7 Bhopal 2332 73 0.0984 25.7 12.1 Jodhpur 2219 28 0.0602 29.0 11.2
Summary
•   The COVID-19 epidemic is going to last for at least, sev-
    eral months in India. The virus may become endemic and
    infections may continue for several years.
•   To draw any conclusions about future course of epidemic
    we need to combine models with empirical data across
    the world.
•   Total infections are unlikely to exceed 2% of population
    in most countries.
•   Total deaths are unlikely to exceed 0.1% of population in
    most countries.
•   Lockdown has probably caused more damage than the
    virus itself. Hence it is necessary to restart economic and
    other activities in phases with appropriate precautions.
You can also read