The Economic Impacts of the COVID-19 Pandemic on the City of Winnipeg - A Summary of Local and Global Economic Challenges Paul Beckta and Tyler ...

Page created by Phillip Flynn
 
CONTINUE READING
The Economic Impacts of the COVID-19 Pandemic on the City of Winnipeg - A Summary of Local and Global Economic Challenges Paul Beckta and Tyler ...
The Economic Impacts of the COVID-19
  Pandemic on the City of Winnipeg
  A Summary of Local and Global Economic Challenges

                                        Paul Beckta and Tyler Kroeker
                                        Manitoba Planning Conference
                                        January 21, 2021

Economic Research                                                       1
The Economic Impacts of the COVID-19 Pandemic on the City of Winnipeg - A Summary of Local and Global Economic Challenges Paul Beckta and Tyler ...
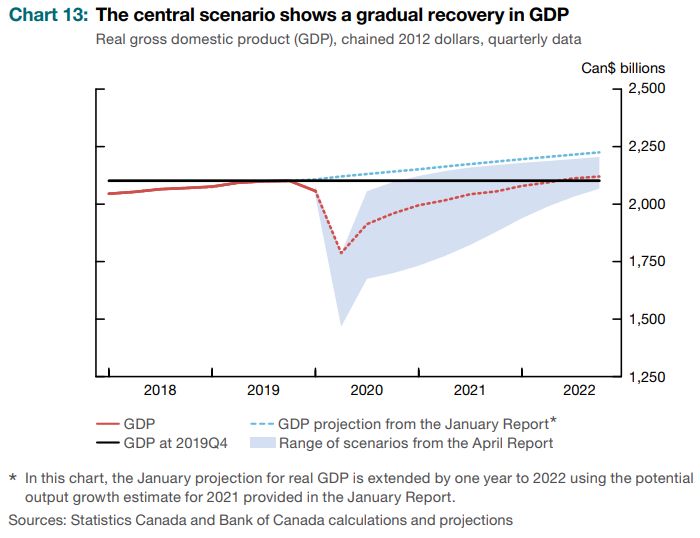
Presentation Outline
 • The Initial Impact of COVID-19 on the Local Economy
 • What Others Are Saying
 • Our Approach
 • Scenario Results
 • Plausible Implications for the City of Winnipeg

Economic Research                         2
Manitoba Retail Sales and COVID-19
Sharp decrease in March and April coincides with pandemic
                                                                    COVID-19 Pandemic               Retail Trade - Year-over-year % Change

                 15%

                 10%

                  5%

                  0%
% Change Y-o-Y

                 -5%

                 -10%

                 -15%                                    First presumptive case of COVID-19
                 -20%                                    detected in Manitoba on March 12, 2020
                 -25%

                 -30%
                        J F M A M J J A S O N D J F M A M J J A S O N D J F M A M J J A S O N D J F M A M J J A S O N D J F M A M J J A S O
                                      2016                               2017                               2018                             2019   2020

                 Source: Statistics Canada. Table 20-10-0008-01 Retail trade sales by province and territory (x 1,000). For
                 Manitoba, Seasonally Adjusted

Economic Research                                                                                            3
Manitoba Retail Sales: Lowest point in April
Clothing, Sporting Goods, Music, Books, and Vehicle sales hit the hardest

                                                    Manitoba Retail Sales % Change in April 2020 over April 2019

                           Retail Trade - Overall
        Clothing and clothing accessories stores
  Sporting goods, hobby, book and music stores
                 Motor vehicle and parts dealers
                               Gasoline stations
                Electronics and appliance stores
          Furniture and home furnishings stores
                    General merchandise stores
       Building material and garden equipment
                Health and personal care stores
                    Miscellaneous store retailers
                      Food and beverage stores

                                                -100%                -80%                -60%             -40%   -20%   0%   20%

  Source: Statistics Canada. Table 20-10-0008-01 Retail trade sales by province and territory (x 1,000)

Economic Research                                                                            4
Manitoba Employment Rate and COVID-19
          Sharp decrease in March and April coincides with pandemic
                                                                    COVID-19 Pandemic               Employment Rate - 15 Years and Older

                  70%

                  65%
Employment Rate

                  60%

                  55%
                                                                                  Marginal decline in November and
                  50%
                                                                                  December coincides with additional
                  45%                                                             response measures
                  40%
                        J F M A M J J A S O N D J F M A M J J A S O N D J F M A M J J A S O N D J F M A M J J A S O N D J F M A M J J A S O N D
                                     2016                             2017                             2018                           2019   2020

                    Source: Statistics Canada. Table 14-10-0017-01 Labour force characteristics by sex and detailed age group,
                    monthly, unadjusted for seasonality

          Economic Research                                                                                   5
Manitoba Employment Rate by Education Level
  Those with higher levels of education have fared better in the labour force
                            COVID-19 Pandemic              All         High School            Certificate or Diploma         Bachelor's degree   Above bachelor's degree

                  90%

                  85%

                  80%
Employment Rate

                  75%

                  70%

                  65%

                  60%

                  55%

                  50%
                        J F M A M J J A S O N D J F M A M J J A S O N D J F M A M J J A S O N D J F M A M J J A S O N D J F M A M J J A S O N D
                                     2016                             2017                            2018                           2019                    2020

                    Source: Statistics Canada. Table 14-10-0019-01 Labour force characteristics by educational attainment,
                    monthly, unadjusted for seasonality

  Economic Research                                                                                          6
Manitoba: Share of Employees Working Zero Hours per Week
    While cyclical, sustained increase observed during pandemic

                                                                           COVID-19 Pandemic             Share of MB Employees working 0 Hours

                          20%
                          18%
                                                       Double-spike: one due to restrictions in Spring, and
                          16%
                                                       another due to seasonal occupations (e.g. education)
Share of Total Employed

                          14%
                          12%
                          10%
                          8%
                          6%
                          4%
                          2%
                          0%
                                J F M A M J J A S O N D J F M A M J J A S O N D J F M A M J J A S O N D J F M A M J J A S O N D J F M A M J J A S O N D
                                             2016                            2017                             2018                         2019   2020

                            Source: Statistics Canada. Table 14-10-0036-01 Actual hours worked by industry, monthly, unadjusted for
                            seasonality (x 1,000)

    Economic Research                                                                                                7
Winnipeg Employment by Industry
  Recovery taking place, but Accommodation/Food Services and Manufacturing still severely affected

                      Winnipeg CMA Employment Gains/Losses by Industry Oct. to Dec. average 2020 versus 2019
               Accommodation and food services
                                   Manufacturing
                                     Construction
              Information, culture and recreation
    Business, building and other support services
                       Wholesale and retail trade
                                           Utilities
                                       Agriculture
                 Health care and social assistance
Finance, insurance, real estate, rental and leasing
  Forestry, fishing, mining, quarrying, oil and gas
    Other services (except public administration)
    Professional, scientific and technical services
                             Public administration
                 Transportation and warehousing
                              Educational services

                                                 -10,000   -8,000           -6,000            -4,000           -2,000   0   2,000   4,000
          Source: Statistics Canada. Table 14-10-0097-01 Employment by industry, three-month moving average,
          unadjusted for seasonality, census metropolitan areas
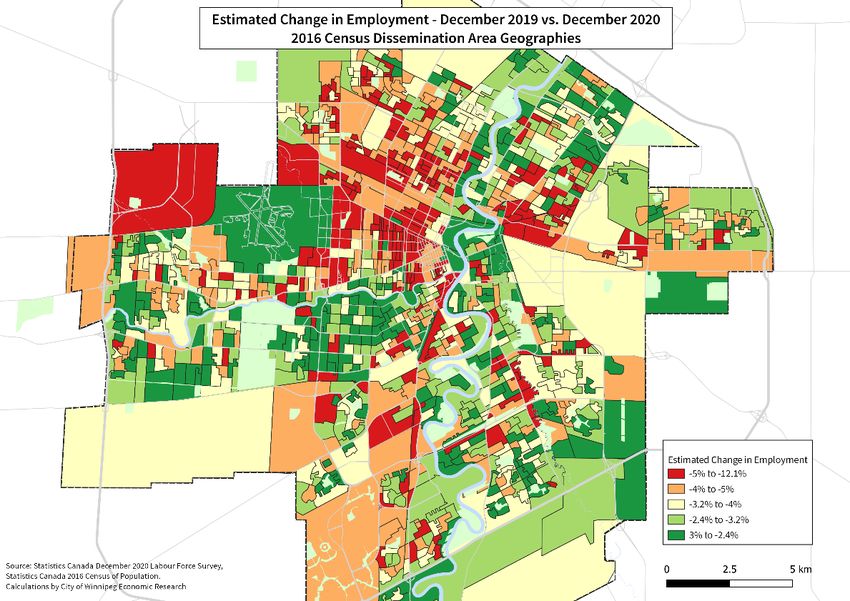
  Economic Research                                                                          8
Winnipeg Employment Change by Neighborhood
Declines in Employed Estimated to be More Significant in Central and Northern Neighborhoods

Economic Research                                         9
Winnipeg Labour Market Summary
Statistics Canada Labour Market Summary - Winnipeg CMA (Three-month Moving Average)
 Category                                          Indicator – Winnipeg CMA                     December 2019        December 2020   % Change
                                                   Labour Force                                            469,200         468,200      -0.2%
 Labour Force
                                                   Not in Labour Force                                     232,600         240,200      +3.3%
                                                   Total Employed                                          447,000         430,800      -3.6%
 Employment
                                                   Employment Rate                                          63.7%           60.8%       -2.9%
                                                   Total Unemployed                                         22,200          37,400     +68.5%
 Unemployment
                                                   Unemployment Rate                                         4.7%            8.0%       +3.3%

Source: Statistics Canada. Table 14-10-0095-01 Labour force characteristics by census metropolitan area,
three-month moving average, unadjusted for seasonality

Economic Research                                                                        11
Change in Housing Prices Across Canada
November 2020 versus November 2019 via Teranet House Price Index

                                               20%   18.7%
  Year-over-year Change in House Price Index

                                                              15.7%
                                                                         14.7%      14.5%
                                               15%

                                                                                              10.3%
                                               10%

                                                                                                             6.3%     5.9%
                                                                                                                               5.3%
                                               5%

                                                                                                                                           1.0%

                                               0%

                                                                                                                                                    -2.3%
                                               -5%
                                                     Ottawa   Halifax   Hamilton   Montréal   Toronto    Vancouver   Québec   Winnipeg   Edmonton   Calgary
 Source: Teranet and National Bank of Canada House Price Index. Data accessed January 8, 2021.

Economic Research                                                                                       12
Winnipeg Housing Starts
     Starts down compared to 2017 and 2019, but still on track with recent historical averages

                                                             Cumulative Housing Starts by Year and Month – All Dwelling Types
                                   6,000

                                                                                                                                                                              2017
Annual Cumulative Housing Starts

                                   5,000
                                                                                                                                                                              2018
                                                                                                                                                                              2019
                                   4,000
                                                                                                                                                                              2016
                                   3,000

                                   2,000
                                                                                                                                        2020 Total: 4,350
                                   1,000

                                       0
                                      January     February      March         April        May          June         July     August   September   October   November   December
                                     Source: CMHC Starts and Completions Survey. City of Winnipeg (CY) geography used.

     Economic Research                                                                                                   13
Manitoba’s Population: Immigration
 Severe decline in Permanent Residents to Manitoba; Study Permits in-line with Historical Averages

                   Permanent Residents: Monthly Cumulative, Manitoba                                                               Study Permit Holders: Monthly Cumulative, Manitoba

20,000                                                                                                        20,000
                                                                     16,535

15,000                                                                                                        15,000
                                                                                                                                                                               10,605

10,000                                                                                                        10,000

 5,000                                                                                                          5,000
                                                                             7,420                                                                                                   7,785

     0                                                                                                               0
         Jan   Feb      Mar     Apr      May     Jun      Jul     Aug      Sep     Oct     Nov      Dec                  Jan   Feb         Mar   Apr   May   Jun   Jul   Aug   Sep      Oct   Nov   Dec

 Source: Immigration, Refugees and Citizenship Canada. Permanent Residents – Monthly IRCC Updates (open data portal, accessed January 8,
 2021); Temporary Residents: Study Permit Holders – Monthly IRCC Updates (open data portal, accessed January 8, 2021); City of Winnipeg
 Economic Research

 Economic Research                                                                                               14
City of Winnipeg’s Population
Decline in non-permanent residents (primarily study permit holders) and increase in provincial out-migration
has resulted in reduced population growth in 2020
                                                   Feb. 2020 Forecast (Pre-COVID)              City of Winnipeg Population

 800,000
                                                                                            2020 Population Estimate prior to
                                                                                            COVID-19 pandemic: 774,700
 775,000
                                                                                                                                                        Difference:
                                                                                                                                                          -7,800
 750,000

 725,000
                                                                                                                       2020 Actual: 766,900
 700,000

 675,000

 650,000
        2010            2011           2012           2013           2014           2015          2016          2017          2018        2019   2020

Source: Statistics Canada, Table 17-10-0142-01 Population estimates, July 1, by census subdivision, 2016
boundaries, City of Winnipeg Economic Research
Economic Research                                                                          15
National Studies of Socio-economic Impacts from COVID-19
Initial job losses were heavily concentrated among the most financially vulnerable
•        Indigenous Peoples:
                    “36% of Indigenous participants reported that the COVID-19 pandemic had a strong or moderate
                     impact on their ability to meet their financial obligations or essential needs, compared with 25%
                     of non-Indigenous participants” – Statistics Canada, 2020-07-14
•        Visible Minorities:
                    "Among participants who were employed prior to the shutdown, around one-third in most
                     groups experienced job loss or reduced work hours. Filipinos and West Asians reported a higher
                     share, at 42% and 47%, respectively, compared to 34% among White participants.“ – Statistics
                     Canada, 2020-07-6
•        Peoples with Disabilities:
                    "Overall, 61% of participants aged 15 to 64 with long-term conditions or disabilities reported a
                     major or moderate impact from COVID-19 on at least one type of financial obligation or essential
                     need.“ – Statistics Canada, 2020-08-27
Source: Economic Impact of COVID-19 among Indigenous People, Statistics Canada, 2020-07-14
Economic Impact of COVID-19 among visible minority groups, Statistics Canada, 2020-07-06
Impacts of COVID-19 on persons with disabilities, Statistics Canada, 2020-08-27

Economic Research                                                                       17
Winnipeg Macroeconomic Projections by Scenario
Our Approach to Modelling the Economy
Macroeconomic Projections were generated utilizing a scenario-based approach:
•   Three different scenarios on how severely COVID-19 may affect public health and economic
    output in Manitoba and Winnipeg were developed with a focus on current epidemiological
    research, provincial government response plans, and internal discussion.
•   Approximately 180 expenditures within Manitoba’s Gross Domestic Product (GDP) are then
    linked to each these three scenarios, or are assumed to grow at a recent trend rate.
         For example, expenditures linked to tourism will be dependent on each scenario’s status with respect
          to international and interprovincial boarder restrictions.
•   Economic output is dependent on the variety of social and health measures put in place
    across time within each scenario (e.g. vaccine deployment and availability, border restrictions,
    and provincial pandemic response levels).
      •   Provincial pandemic response levels are modelled at a provincial level only.
•   It is assumed that there will be a reluctance in the population to return to pre-COVID-19
    behaviours without a vaccine (or other medical treatment).
Economic Research                                          19
Winnipeg Macroeconomic Projections by Scenario
Best-Case Scenario (Low) Timeline Assumptions
                                                           Scenario
                                                                               We Are Here
                                                          Starts Here
                                                       2020                                  2021

                                         Jun Jul Aug Sep Oct Nov Dec Jan Feb Mar Apr May Jun Jul Aug Sep Oct Nov Dec

 Vaccine Availability                                          Not Available                    Deployed and Available

 Additional COVID-19 Wave(s)                                                      None
 Government of Manitoba Reopening         3        4              Caution (Yellow)                  Limited Risk (Green)
 Phase

 Interprovincial Borders Status - West    Closed                                     Open

 Interprovincial Borders Status - East                         Closed                                 Open

 International Borders Status                                  Closed                                 Open

Economic Research                                                       20
Winnipeg Macroeconomic Projections by Scenario
Best-Case Scenario (Low) Results

 Indicator - Winnipeg CMA                           2020F     2021F

 GDP Growth Rate                                    -5.4%     +4.6%

 Change in Employment                              -28,700   +23,300

 Unemployment Rate                                   8.9%      8.0%

 Source: City of Winnipeg Economic Research

Economic Research                             21
Winnipeg Macroeconomic Projections by Scenario
Best-Case Scenario (Low) Results – CMA GDP Growth Rate
                                                                             Historical          Conf. Board Autumn 2020 Forecast              Best Case

                                 8%

                                 6%                                                                                                                                        4.6%
Year-over-year GDP Growth Rate

                                 4%                                              2.7%                            3.1%
                                                        1.5%                                                                    2.7%                       1.7%     1.8%
                                 2%

                                 0%

                                 -2%

                                 -4%
                                            -5.2%
                                 -6%
                                                                                                                                                                  -5.4%
                                 -8%

                                  Source: Conference Board of Canada, Autumn 2020 Metropolitan 1 Outlook; City of Winnipeg Economic Research

Economic Research                                                                                                22
Winnipeg Macroeconomic Projections by Scenario
Medium-Case Scenario Timeline Assumptions
                                                           Scenario
                                                                             We Are Here
                                                          Starts Here
                                                       2020                                       2021

                                         Jun Jul Aug Sep Oct Nov Dec Jan Feb Mar Apr May Jun Jul Aug Sep Oct Nov Dec

 Vaccine Availability                                                        Not Available

 Additional COVID-19 Wave(s)                                                    None
 Government of Manitoba Reopening
 Phase
                                          3        4                           Caution (Yellow)

 Interprovincial Borders Status - West    Closed                                   Open

 Interprovincial Borders Status - East                         Closed                                    Open

 International Borders Status                                  Closed                                    Open

Economic Research                                                       23
Winnipeg Macroeconomic Projections by Scenario
Medium-Case Scenario Results

 Indicator - Winnipeg CMA                           2020F    2021F

 GDP Growth Rate                                    -5.4%    +2.1%

 Change in Employment                              -28,700   +9,600

 Unemployment Rate                                   8.9%     8.5%

 Source: City of Winnipeg Economic Research

Economic Research                             24
Winnipeg Macroeconomic Projections by Scenario
Medium-Case Scenario Results – CMA GDP Growth Rate
                                                                           Historical           Conf. Board Autumn 2020 Forecast               Medium Case

                                 8%

                                 6%
Year-over-year GDP Growth Rate

                                 4%                                               2.7%                           3.1%                                                        2.1%
                                                        1.5%                                                                    2.7%                         1.7%     1.8%
                                 2%

                                 0%

                                 -2%

                                 -4%
                                            -5.2%
                                 -6%
                                                                                                                                                                    -5.4%
                                 -8%

                                  Source: Conference Board of Canada, Autumn 2020 Metropolitan 1 Outlook; City of Winnipeg Economic Research

Economic Research                                                                                                25
Winnipeg Macroeconomic Projections by Scenario
Worst-Case (High) Scenario Timeline Assumptions
                                                                   Scenario
                                                                                                  We Are Here
                                                                  Starts Here
                                                           2020                                                     2021

                                         Jun Jul Aug Sep Oct Nov Dec Jan Feb Mar Apr May Jun Jul Aug Sep Oct Nov Dec

 Vaccine Availability                                                                             Not Available
                                                                                                                                     Additional
 Additional COVID-19 Wave(s)                                               Additional Wave
                                                                                                                                       Wave
 Government of Manitoba Reopening                      Caution       Restricted                      Restricted                      Restricted
 Phase                                    3        4   (Yellow)       (Orange)
                                                                                       Critical
                                                                                        (Red)
                                                                                                      (Orange)
                                                                                                                  Caution (Yellow)
                                                                                                                                      (Orange)

 Interprovincial Borders Status - West    Closed
                                                        Open                           Closed                              Open          Closed

 Interprovincial Borders Status - East                                                               Closed

 International Borders Status                                                                        Closed

Economic Research                                                                 26
Winnipeg Macroeconomic Projections by Scenario
Worst-Case (High) Scenario Results

 Indicator - Winnipeg CMA                           2020F    2021F

 GDP Growth Rate                                    -5.8%    +0.7%

 Change in Employment                              -32,200    +100

 Unemployment Rate                                   9.4%    9.5%

 Source: City of Winnipeg Economic Research

Economic Research                             27
Winnipeg Macroeconomic Projections by Scenario
Worst-Case (High) Scenario Results – CMA GDP Growth Rate
                                                                            Historical           Conf. Board Autumn 2020 Forecast              Worst Case

                                 8%

                                 6%
Year-over-year GDP Growth Rate

                                 4%                                              2.7%                            3.1%
                                                        1.5%                                                                    2.7%                        1.7%     1.8%
                                 2%                                                                                                                                         0.7%

                                 0%

                                 -2%

                                 -4%
                                            -5.2%
                                 -6%

                                 -8%                                                                                                                               -5.8%

                                  Source: Conference Board of Canada, Autumn 2020 Metropolitan 1 Outlook; City of Winnipeg Economic Research

Economic Research                                                                                                28
Winnipeg Macroeconomic Projections by Scenario
GDP Growth Rate by Scenario Comparison

                                                            Conf. Board Autumn 2020 Forecast      Best Case      Medium Case         Worst Case

                       8%
                                                                                                                       6.4%
                       6%
                                                                                                                                      4.6%
                       4%
Real GDP Growth Rate

                                                                                                                                                     2.1%
                       2%
                                                                                                                                                            0.7%
                       0%

                       -2%

                       -4%

                       -6%                              -5.4%           -5.4%
                                                                                    -5.8%
                                          -6.5%
                       -8%
                                                                2020F                                                                        2021F

                        Source: Conference Board of Canada, Autumn 2020 Metropolitan 1 Outlook; City of Winnipeg Economic Research

Economic Research                                                                                      29
Winnipeg Macroeconomic Projections by Scenario
  Unemployment Rate by Scenario Comparison
                                                          Conf. Board Autumn 2020 Forecast      Best Case      Medium Case         Worst Case

                    10%                                                           9.4%                                                                    9.5%
                                                      8.9%           8.9%
                    9%                                                                                                                             8.5%
                                        8.0%                                                                                        8.0%
                    8%
Unemployment Rate

                    7%                                                                                               6.4%
                    6%
                    5%
                    4%
                    3%
                    2%
                    1%
                    0%
                                                             2020F                                                                         2021F

                      Source: Conference Board of Canada, Autumn 2020 Metropolitan 1 Outlook; City of Winnipeg Economic Research

  Economic Research                                                                                  30
Other Organizations: Also Taking a Scenario-Based Approach

Source: Bank of Canada, July 2020 Monetary Policy Report

Economic Research                                          32
Other Organizations: Also Taking a Scenario-Based Approach

Other Organization’s Projections for Canada’s Real GDP Growth Rate

 Organization                                                   Scenario                          2020F    2021F

 Parliamentary Budget Office (PBO)                              COVID-19 + Oil Shock               -6.8%     N/A

                                                                COVID-19 Single-wave               -8.0%   +3.9%
 Organisation for Economic Co-
 operation and Development (OECD)
                                                                COVID-19 Double-wave               -9.4%   +1.5%

 Source: Canadian Parliamentary Budget Office (PBO), Organisation for Economic Co-operation and
 Development (OECD)

Economic Research                                                                      33
Plausible Implications for the Municipality
As a municipality, the primary risks to our revenue and services would be in the
following areas:
•   Transit
         Reduced ridership from social distancing guidelines, employers transitioning to work-from-home
          policies either temporarily or permanently, and risk-aversion even after pandemic subsides
•   Community Services
         Reduced users from social distancing guidelines, temporary closures, and general apprehension
          among health-conscious population could reduce demand for services over the short term
•   Accommodation Tax and Convention Centre Revenue
         A decline in tourism and conventions, and the subsequent decline in accommodation taxes pose a
          risk to this revenue stream

Economic Research                                         34
Summary
• The impact of COVID-19 on lives and livelihood in Winnipeg is real and quite
  substantial.
• Overall the economy has seen a historic shock, and specific industries have been hit
  at a historic rate.
• Because of this uncertainty, Economic Research has produced three scenarios of
  varying impacts of COVID-19 on the economy.
• Our first round of scenarios were used as part of navigating the crisis early on and
  our second round results were used for planning the 2021 budget.

Economic Research                             35
510 Main Street | Winnipeg | Manitoba | Canada | R3B 1B9 | winnipeg.ca
You can also read