The Long Climb Out Is Underway - John P. Heimlich, Vice President & Chief Economist Presentation to SEA Stakeholder Advisory Round Table April 28 ...
←
→
Page content transcription
If your browser does not render page correctly, please read the page content below

The Long Climb Out Is Underway
John P. Heimlich, Vice President & Chief Economist
Presentation to SEA Stakeholder Advisory Round Table

April 28, 2021
Airlines for America (A4A) Members and Mission
Founded in 1936

A4A advocates on behalf of its members to shape crucial policies and measures that promote safety,
security and a healthy U.S. airline industry. We work collaboratively with airlines, labor, Congress, the
Administration and other groups to improve aviation for the traveling and shipping public.

                                                    2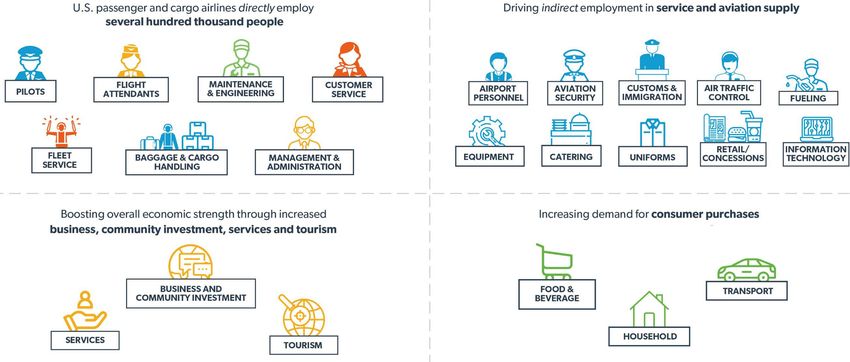
Key Points

» Airlines and airports have taken unprecedented steps to ensure the safety of our employees and customers.
» Domestic and short-haul-international leisure / visiting-friends-and-relatives activity are leading the recovery.
» Air cargo continues to build on records set in 2020 and has proven a critical source of income.
» Bookings for future air travel remain depressed, particular to those traveling for business purposes.
» Large losses in 2021 will compound the record losses incurred in 2020, resulting in massive amounts of debt.
» Sea-Tac is closer than most of its peers to restoring pre-pandemic levels of scheduled air service.
» 2019 systemwide passenger totals won’t return until 2023-2024—but will arrive much sooner at some airports.
» Most airlines are now operating smaller fleets, with one-third fewer twin-aisle aircraft.
» Despite a nearly five-fold increase in passengers, commercial aviation reduced its U.S. noise footprint 94%
  from 1975-2019 and accounts for just 2% of U.S. GHG emissions—and is committed to further improvements.
» Historically, every U.S. airline job helps support an estimated nine U.S. jobs outside the industry, so fewer
  (than otherwise) planes, passengers, pilots, etc. means fewer jobs across the supply chain.

                                                          3
Airlines and Airports Continue to Invest in the Safety and Wellbeing of Their Customers and
Crewmembers, Instituting Multiple Layers of Protection Throughout the Experience

                                                               Partnering With Premier
    Requiring face                  Offering touchless                                   Sanitizing counters,      Adjusting security
      coverings                          check-in                                        kiosks & gate areas           screening

                                                                 Medical Institutions

      Using HEPA                 Sterilizing w/electrostatic                             Disinfecting surfaces Reducing touchpoints
  filtration systems                sprayers & foggers                                   (e.g., tables, buckles) (e.g., beverage service)

Source: AirlinesTakeAction.com

                                                                          4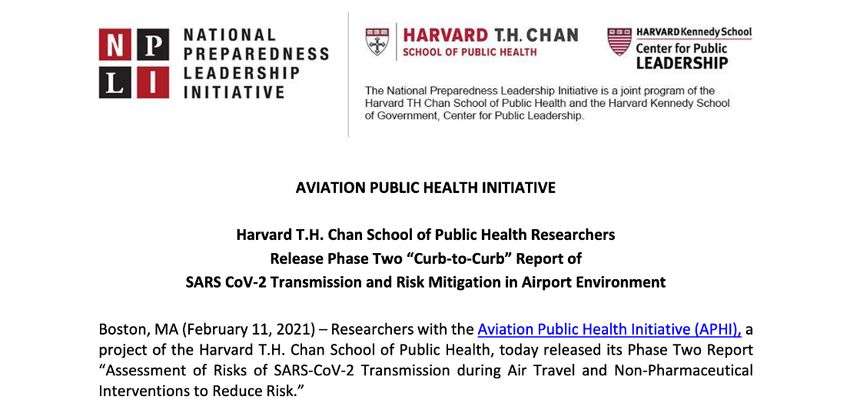
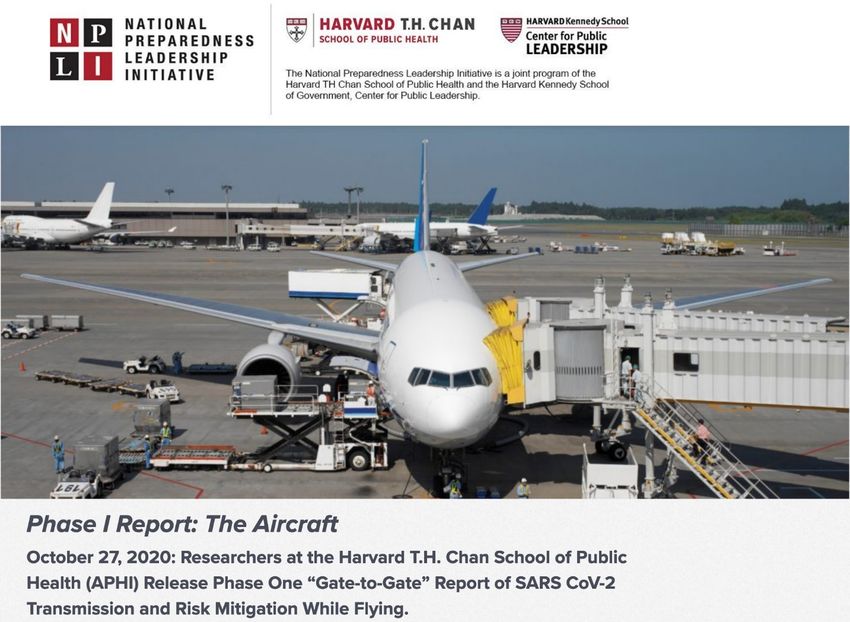
This study is the first comprehensive research
looking at the entire inflight experience.

The multiple layers of protection against
COVID-19 make being on an airplane as safe
as if not substantially safer than other
routine activities, such as grocery shopping or
going to a restaurant.

The research found that there is a very low
risk of virus transmission on airplanes.

The scientists concluded that the ventilation on
airplanes is so good that it effectively
counters the proximity travelers are subject
to during flights.
The Harvard research team surveyed 25 airports of
various sizes, performed its own modeling of air
quality in airport settings and applied the findings
to a comprehensive assessment of research.

The report concludes that airports have been
proactive in implementing multiple layers
of measures to mitigate the risk of COVID-19
transmission, including face covering
requirements, physical distancing, enhanced
disinfection processes, enhanced ventilation and
deployment of touchless technologies.

Researchers from the Harvard confirmed that this
multi-layered approach “significantly mitigates
risks” in airport settings.

In Most Recent Week, U.S. Airline Passenger Volumes Were 42% Below Pre-Pandemic Levels
Domestic Air Travel Down 39%, International Air Travel Down 59%
7-Day Rolling Change (%) vs. Pre-Pandemic in Onboard Passengers*
20
10
0
(10)
(20)
(30)
(40)
(50)
(60)
(70)
(80)
(90)
(100)
8-Jun-21
5-Jan-21
9-Jun-20
11-May-21
25-May-21
7-Jan-20
7-Jul-20
13-Apr-21
27-Apr-21
12-May-20
26-May-20
13-Oct-20
27-Oct-20
14-Apr-20
28-Apr-20
10-Nov-20
24-Nov-20
22-Dec-20
4-Aug-20
18-Aug-20
1-Sep-20
15-Sep-20
29-Sep-20
8-Dec-20
16-Mar-21
30-Mar-21
17-Mar-20
31-Mar-20
16-Feb-21
2-Mar-21
22-Jun-21
19-Jan-21
2-Feb-21
18-Feb-20
3-Mar-20
23-Jun-20
21-Jul-20
21-Jan-20
4-Feb-20
Domestic USA Canada Mexico Atlantic Latin (excl. Mexico) Pacific
Source: A4A member passenger airlines and branded code share partners * Onboard (“segment”) passengers; “pre-pandemic” precedes March 1, 2020
7
In February 2021, U.S. Air Carriers Transported 9% More Cargo Than in February 2019

          % Change vs. 2019 in Air Cargo Transported by U.S. Passenger and Cargo Airlines*
 25
 20
 15
 10
  5
  0
 (5)
(10)
(15)
(20)

                                                                                                        2021

                                                                                                               Feb

                                                                                                                                                    Jul
             2020

                      Feb

                                                                  Jul

                                                                                                                                            Jun
                                                            Jun

                                                                                                                           Apr

                                                                                                                                                             Aug

                                                                                                                                                                      Sep
                                        Apr

                                                                          Aug

                                                                                Sep

                                                                                                                                                                              Oct
                               Mar

                                                 May

                                                                                      Oct

                                                                                                                     Mar

                                                                                                                                   May

                                                                                                                                                                                       Nov

                                                                                                                                                                                                Dec
                                                                                            Nov

                                                                                                  Dec
                                                                        Domestic              International                System
Source: Bureau of Transportation Statistics, T-100 Market                                                                  * Pounds of freight and mail enplaned in scheduled and nonscheduled services

                                                                                                  8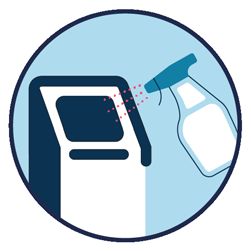
Corporate Air Travel Has Yet to Recover From the Steep Declines That Began in March 2020
But Overall Travel-Agency Bookings Are Showing Signs of Life
% Change vs. 2019 in Weekly Tickets Sold* by U.S. Travel Agencies
20
0
(20)
(40) (44.5)
(60)
(80) (76.4)
(100)
16-May-21
30-May-21
2-May-21
18-Apr-21
4-Apr-21
17-May-20
31-May-20
18-Oct-20
15-Nov-20
29-Nov-20
13-Dec-20
27-Dec-20
1-Nov-20
3-May-20
21-Mar-21
13-Jun-21
27-Jun-21
19-Apr-20
9-Aug-20
23-Aug-20
6-Sep-20
20-Sep-20
4-Oct-20
5-Apr-20
21-Feb-21
7-Mar-21
10-Jan-21
24-Jan-21
7-Feb-21
22-Mar-20
14-Jun-20
28-Jun-20
12-Jul-20
26-Jul-20
23-Feb-20
8-Mar-20
12-Jan-20
26-Jan-20
9-Feb-20
All Segments Corporate Segment
Source: Airlines Reporting Corporation (ARC) * Results do not include sales of tickets purchased directly from airlines and are not net of refunds or exchanges.
9
Cumulative Pretax Losses for 2020-2021 Are Projected to Exceed $60 Billion

                 U.S. Passenger Airlines* – Pretax Earnings ($ Billions)
    $30
                                      16.5                                               19.0
    $20
    $10
       $0
  ($10)
  ($20)
                                                                                                                                                      (20.6)
  ($30)
  ($40)
  ($50)                                                                                                                              (42.2)
  ($60)
                                     2018                                               2019                                         2020            2021F

Source: Various equity analysts and filings of Alaska, Allegiant, American, Delta, Hawaiian, JetBlue, Southwest, Spirit and United            * Publicly traded, independently branded carriers

                                                                                                                 10
Airlines Have Coped in Part by Taking on Billions in Debt
Net Interest Expense Doubled From 2019 to 2020 and Will Exceed $15B in 2021-2023
“For 2021 and beyond, we anticipate a major deleveraging cycle as the industry will have no choice but to
address its significant debt load.” (Deutsche Bank, “Airline Industry Update,” July 1, 2020)
Year-End Total Debt ($ Billions) Interest Expense, Net ($ Billions)
5.5 5.3
173
4.8
163
163
105 +$58B
151
3.8
108
2.0 1.9
2018 2019 2020 2021F 2022F 2023F 2018 2019 2020 2021F 2022F 2023F
Source: A4A, equity analysts and filings of Alaska, Allegiant, American, Delta, Hawaiian, JetBlue, Southwest, Spirit and United
11SEA Is Closer to Pre-Pandemic Scheduled Air Service Than Most of Its Peers
Nationwide, Large Airports Are Seeing a 29% Decline in Flights vs. Pre-Pandemic Levels
% Change in U.S. Outbound Scheduled Passenger Flights: May 2021 vs. May 2019
(0)
(8) (8) (9)
(10) (11) (12) (12)
(15)
(18)
(23) (24) (24)
(29)
(29)
(31) (31) (31)
U.S. Average (36) (37) (37) (37)
(39) (40)
(43)
(46) (49)
(50)
(56) (57)
(65)
BWI
SFO
TPA
EWR
DCA
BOS
IAH
ATL
HNL
IAD
JFK
CLT
MIA
MSP
DTW
SEA
ORD
SAN
LGA
DFW
FLL
MDW
MCO
PDX
PHL
PHX
DEN
LAS
LAX
SLC
Source: Diio by Cirium published schedules (April 23, 2021) for all U.S. and non-U.S. airlines providing scheduled service to all U.S. and non-U.S. destinations
12We Are Unlikely to See a Return to 2019 Passenger Volumes Before 2023
2021-2022 Clouded by Uncertainty re: State of Pandemic, Vaccination/Therapeutics, Economy
U.S. Airline Passenger Traffic Change (%) vs. 2019
20
10
0 2019 Passenger Volumes
(10)
(20)
(30)
(40)
(50)
(60)
(70)
2020 2021F 2022F 2023F 2024F
Pessimistic Optimistic
Source: A4A and various airline equity analysts
13U.S. Passenger Airlines Entered 2021 With a 19% Smaller Operating Fleet Than in Start of 2020
Accounting for Retirements/Disposals/Deliveries, Net Reduction From YE19 to Present = 862 Aircraft
Number of Active Aircraft*
5,780
495 4,918
4,671
307 318 % Change vs YE19
YE20 3/31/2021
3,475
2,847 3,055 Regional 16 15
Single-aisle 18 12
Twin-aisle 38 36
1,810 Total 19 15
1,517 1,545
12/31/2019 12/31/2020 3/31/2021
Regional Single-Aisle Twin-Aisle
Source: Global Eagle's masFlight Aviation Platform * Operated by or on behalf of Alaska/Allegiant/American/Delta/Frontier/Hawaiian/JetBlue/Southwest/Spirit/Sun Country/United in any of the previous seven days
14U.S. Exposure to Aviation Noise Has Fallen 94% Despite a Five-Fold Increase in Passengers
Commercial Aviation Accounts for Less Than 2% of the U.S. Greenhouse Gas Emissions Inventory
9.67
Commercial Non-
Residential Aircraft Commercial
Commercial 5.63% 1.96% Aircraft
7.00 7.05 6.63% 0.67% Passenger
Vehicles
Agriculture 16.55%
9.86%
U.S. Territories
0.70%
Other
2.02 Transportation
9.07%
0.87
0.44 Industry
22.01%
1975 2000 2019
Electric Power
Hundred Million Passengers Enplaned Industry
26.92%
Million Persons Exposed to Significant Noise
Source: Federal Aviation Administration and EPA Inventory of U.S. Greenhouse Gas Emissions and Sinks: 1990-2018 (published 2020)
15Demand for Air Transportation Helps Support More Than 10 Million U.S. Jobs
Every U.S. Airline Job Helps Support an Estimated 9 U.S. Jobs Outside the Industry
Source: The Economic Impact of Civil Aviation on the U.S. Economy (FAA, January 2020) and A4A
1617
You can also read


