FIRST QUARTER FISCAL 2021 - INVESTOR PRESENTATION
←
→
Page content transcription
If your browser does not render page correctly, please read the page content below

INVESTOR PRESENTATION
FIRST QUARTER FISCAL 2021

Presenters

                                          Craig L. Montanaro
                                        Director, President and
               Eric B. Heyer            Chief Executive Officer       Keith Suchodolski
      Senior Executive Vice President                              Executive Vice President
        and Chief Operating Officer                               and Chief Financial Officer

                                                                                                1
Forward Looking Statements
 This presentation may include certain “forward-looking statements,” which are made in good faith by Kearny Financial Corp. (the “Company”) pursuant to the “safe harbor”
 provisions of the Private Securities Litigation Reform Act of 1995.

 These forward-looking statements are subject to risks and uncertainties, such as statements of the Company’s plans, objectives, expectations, estimates and intentions that are
 subject to change based on various important factors (some of which are beyond the Company’s control). In addition to the factors described under Item 1A. Risk Factors in the
 Company’s Annual Report on Form 10-K, the following factors, among others, could cause the Company’s financial performance to differ materially from the plans, objectives,
 expectations, estimates and intentions expressed in such forward-looking statements:
  •   the strength of the United States economy in general and the strength of the local economy in which the Company conducts operations,
  •   The effects of COVID-19 on our business, financial condition or results of operations,
  •   the effects of and changes in, trade, monetary and fiscal policies and laws, including interest rate policies of the Board of Governors of the Federal Reserve System,
      inflation, interest rates, market and monetary fluctuations,
  •   the impact of changes in laws, regulations and government policies regarding financial institutions (including laws concerning taxation, banking, securities and insurance),
  •   changes in accounting policies and practices, as may be adopted by regulatory agencies, the Financial Accounting Standards Board (“FASB”) or the Public Company
      Accounting Oversight Board,
  •   technological changes,
  •   competition among financial services providers and,
  •   the success of the Company at managing the risks involved in the foregoing and managing its business.
 The Company cautions that the foregoing list of important factors is not exhaustive. Readers should not place any undue reliance on any forward looking statements, which
 speak only as of the date made. The Company does not undertake any obligation to update any forward-looking statement, whether written or oral, that may be made from
 time to time by or on behalf of the Company.

                                                                                                                                                                                     2
Non-GAAP Financial Measures
  This presentation contains financial information determined by methods other than in accordance with accounting principles generally accepted in the United States
  of America (“GAAP”). Management uses these “non-GAAP” measures in its analysis of the Company’s performance.

  Management believes these non-GAAP financial measures allow for better comparability of period to period operating performance. Additionally, the Company
  believes this information is utilized by regulators and market analysts to evaluate a company’s financial condition and therefore, such information is useful to
  investors. These disclosures should not be viewed as a substitute for operating results determined in accordance with GAAP, nor are they necessarily comparable to
  non-GAAP performance measures that may be presented by other companies.

  A reconciliation of the non-GAAP measures used in this presentation to the most directly comparable GAAP measures is provided in the Appendix to this presentation.

                                                                                                                                                                        3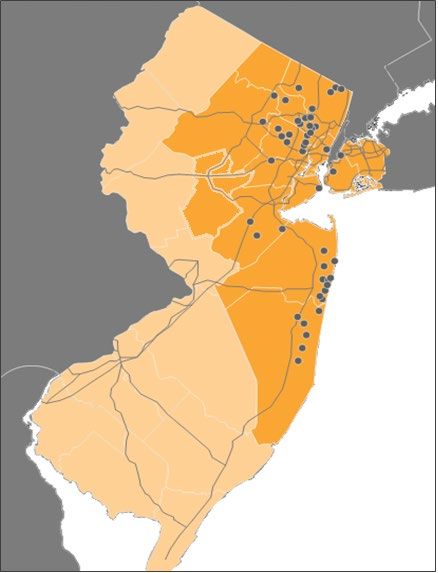
Company Overview
NASDAQ: KRNY
NEW YORK
Market Cap: $751.9 million1 SUSSEX
PASSAIC
Founded in 1884 BERGEN
WARREN MORRIS
Top 10 New Jersey-based financial institution by assets ESSEX
HUDSON
KINGS
UNION
51 full-service branches2
in 12 counties throughout HUNTERDON RICHMOND
northern and central New Jersey and New York City SOMERSET
Active acquirer, having completed 7 whole-bank PENNSYLVANIA
MERCER MIDDLESEX
MONMOUTH
acquisitions since 1999
NEW JERSEY
OCEAN
BURLINGTON
SALEM
ATLANTIC
CUMBERLAND
Corporate Headquarters
Fairfield, NJ 07004
CAPE MAY
Existing Branch Locations
4
1 As of October 30, 2020 2 As of September 30, 2020
Source: S&P Global Market Intelligence & Company Filings
First Quarter Highlights
As of September 30, 2020
$7.3 billion in total assets $5.0 billion in total deposits
$5.0 billion in total loans $1.1 billion in total equity
For the Quarter Ended September 30, 2020
GAAP net income $11.4 million, core net income $15.0 million1
GAAP EPS $0.13, core EPS $0.171
GAAP ROAA 0.63%, core ROAA 0.83%1
Net interest margin expanded 4 basis points, cost of interest-
bearing deposits declined by 27 basis points
5
1) Although management believes core net income, EPS and ROAA, which are non-GAAP measures, are useful to investors by providing a greater level of understanding of its business, they should not be considered a substitute for financial measures determined in accordance with GAAP, nor are they necessarily comparable to non-GAAP
financial measures that may be presented by other companies. Core net income, EPS and ROAA exclude non recurring income and expenses, including various merger related items. Refer to Appendix A for a reconciliation of GAAP to Non-GAAP measures.
Source: S&P Global Market Intelligence & Company FilingsMSB Financial Acquisition
Transaction completed on July 10, 2020
Systems conversion and re-branding completed simultaneous with closing
Expanded franchise into attractive Somerset and Morris county, NJ markets
Tangible book value dilution of 1.4%, or 1.8% inclusive of Day 1 CECL entry
Non-interest expense savings to exceed 45%
6
Source: Company FilingsCapital Strength
Robust capital levels support growth and
capital management activities
Sizable public float and strong liquidity
Index membership (ABA, Nasdaq, Russell)
Tier 1 Leverage Ratio Total Risk-Based Capital Ratio
25.0% 40.0%
20.1%
20.0% 30.0%
30.0%
16.2% 25.8%
23.2% 23.6%
14.1% 22.1%
15.0% 13.3% 12.9%
20.0%
10.0%
9.0% 9.4% 9.3% 8.9% 9.0% 14.2% 14.1% 14.3%
10.0% 13.9% 13.6%
5.0%
0.0% 0.0%
2017FY 2018FY 2019FY 2021FY 2021Q1 2017FY 2018FY 2019FY 2021FY 2021Q1
KRNY Peer Median¹ KRNY Peer Median¹
7
1) Peer group includes BDGE, BRKL, BMTC, CLBK, CNOB, DCOM, FLIC, FFIC, LBAI, EBSB, NFBK, PGC, STBA, TMP, TRST
Source: S&P Global Market Intelligence & Company FilingsCapital Management
Since FY2016, over $600 million of capital returned to
shareholders via dividends and share repurchases
Repurchases suspended March 2020; resumption of
repurchases and additional 5% plan announced October 2020
Capital Returned to Shareholders
$200,000
$175,736
$162,760
$34,028
$150,000 $20,158
$134,372
$8,370
$93,515
$100,000
$23,733
$50,000
$29,450
$69,782
$7,164
$22,286 $6,917
$126,002 $142,602 $141,708
$0
2016FY 2017FY 2018FY 2019FY 2020FY 2021Q1
Repurchase of Common Stock Dividends Paid
8
Source: Company FilingsEarnings Performance
Positive trajectory of core net
income, earnings per share and
return on assets
Earnings per Share1 Net Income & Return on Assets1
$0.75
$0.68 $90,000 0.83% 0.90%
0.71%
$0.60 $75,000 0.67% 0.75%
$0.55 0.63%
$0.46 $60,000 0.54% 0.67% 0.60%
0.63% $60,048
$0.45
0.41%
$0.51 $45,000 0.45%
$44,965 $45,516
$0.30 $42,142
$0.24 0.40%
$0.22 $30,000 0.37% 0.30%
$0.15 $0.17 $15,000 $19,596 0.15%
$18,603 $15,012
$0.13 $11,379
$0 0.00%
$0.00 2017FY 2018FY 2019FY 2020FY 2021Q1
2017FY 2018FY 2019FY 2020FY 2021Q1
Annualized Core EPS Annualized GAAP EPS Net Income Core Net Income Core ROAA ROAA
Core EPS GAAP EPS
9
1) Although management believes core net income, EPS and ROAA, which are non-GAAP measures, are useful to investors by providing a greater level of understanding of its business, they should not be considered a substitute for financial measures determined in accordance with GAAP, nor are they necessarily comparable to non-GAAP
financial measures that may be presented by other companies. Core net income, EPS and ROAA exclude non recurring income and expenses, including various merger related items. Refer to Appendix A for a reconciliation of GAAP to Non-GAAP measures.
Source: S&P Global Market Intelligence & Company FilingsDeposits
Consolidated 11 branches in 18 months while
shifting the deposit base towards lower cost core
deposit relationships
Deposit Composition1 Deposit Growth
$5,000
$488
9.68%
$419
$4,000 $312 $309
$1,561
$843 $1,264
39.00% $1,001
Cost of $3,000
$267
Deposits 30.98% $744
$791
$907
$1,025
$847
0.90% $2,000
$524
$1,000 $2,017 $2,204 $1,966
$1,840
$1,291
20.34%
$0
2017FY 2018FY 2019FY 2020FY 2021Q1
Certificates of deposit Savings Interest bearing DDA Noninterest bearing DDA
10
1 As of September 30, 2020
Source: S&P Global Market Intelligence & Company FilingsMortgage Banking
Residential 1-4 Family Loans Sold
$600,000 $10,000
$9,000
$488,862
$500,000
$8,000
$7,558
1-4 Family $7,000
$400,000 Avg. LTV = 59.0%
Home Equity
Avg. LTV = 41.0% $6,000
$300,000 $282,277 $5,000
$4,000
$3,159
$200,000
$3,000
$122,215
$84,430 $78,766 $2,000
$100,000
$54,288 $1,890
$713 $742 $1,000
$524
$0 $0
2017 FY 2018 FY 2019 FY 2020 FY 2021Q1
Annualized Principal Sold Principal Sold Annualized Gain on Sale Gain on Sale
11
Source: Company FilingsPortfolio Lending
Strategy designed to grow and diversify the loan
portfolio; focused on C&I and construction credits
with seasoned principals and superior credit metrics
Portfolio Composition1 Loan-to-Value by Real Estate Secured Segment1 Geographic Distribution1
0.1% 5.1% Other
Pennsylvania 2.5%
1.6%
Balance Loan to 3.4%
Loan Type (000's) Value (LTV)
1-4 Family $1,353.2 58%
22.5%
27.1% Multifamily $2,110.3 63%
CRE $1,124.3 53%
Yield on New York
Loans Home Equity $71.5 44% 38.9%
4.21% 1.4% Total $4,659.4 59%
New Jersey
55.2%
42.2%
1-4 Family Home Equity Multifamily CRE C&D Consumer Commercial
12
1 Asof September 30, 2020
Source: S&P Global Market Intelligence & Company FilingsCOVID Loan Deferments
September 30, 2020
Active Modifications Total Modifications Increase/(Decrease)
# of Loans Balance # of Loans Balance # of Loans Balance
(Dollars In Thousands)
Commercial loans:
Multi-family mortgage 7 $ 15,910 143 $ 393,156 (136) $ (377,246)
Nonresidential mortgage 11 41,660 168 305,841 (157) (264,181)
Commercial business 4 2,684 60 10,107 (56) (7,423)
Construction 1 2,537 5 12,240 (4) (9,703)
Total commercial loans 23 62,791 376 721,344 (353) (658,553)
One- to four-family
residential mortgage 36 13,866 420 156,963 (384) (143,097)
Consumer loans:
Home equity loans 4 252 47 4,603 (43) (4,351)
Total 63 $ 76,909 843 $ 882,910 (780) $ (806,001)
13
Source: Company FilingsCOVID Impacted Loan Segments
September 30, 2020
Real-Estate Secured Non-Real Estate Secured Total
# of Loans Balance LTV # of Loans Balance # of Loans Balance
(Dollars In Thousands)
Hotel 4 $ 4,357 51% 7 $ 1,479 11 $ 5,836
Restaurant 15 9,805 51% 36 3,888 51 13,693
Retail shopping center 129 321,787 52% 2 55 131 321,842
Entertainment & recreation 5 5,153 45% 14 871 19 6,024
Wholesale commercial business - - N/A 15 20,569 15 20,569
Wholesale consumer unsecured - - N/A 107 202 107 202
Total 153 $ 341,102 52% 181 $ 27,064 334 $ 368,166
14
Source: Company FilingsAsset Quality Trends
History of strong asset quality with
minimal net charge-off activity
Net Charge-Offs / Average Loans Non-Performing Assets / Total Assets
0.05%
0.80%
0.62%
0.04%
0.60% 0.55%
0.03%
0.02% 0.43%
0.03% 0.40%
0.31%
0.27%
0.01% 0.01% 0.20%
0.01%
0.00%
0.00% 0.00%
2017FY 2018FY 2019FY 2020FY 2021Q1 2017FY 2018FY 2019FY 2020FY 2021Q1
15
Source: S&P Global Market Intelligence & Company FilingsM&A History and Strategy
Experienced acquirer and integrator, having successfully
completed 7 whole-bank acquisitions over the past 20 years
Opportunistic acquisition strategy with an emphasis on:
Low premium deals
Similar or complementary business models
Expansion in existing or contiguous markets
Cultural compatibility
Focused on limiting tangible book value dilution and earn-back
periods
16Executive Management Team
Name Title Years in Banking Years at KRNY
Craig L. Montanaro President & Chief Executive Officer 32 17
Eric B. Heyer Senior Executive Vice President & Chief Operating Officer 35 11
Keith Suchodolski Executive Vice President and Chief Financial Officer 19 7
Patrick M. Joyce Executive Vice President and Chief Lending Officer 35 21
Erika K. Parisi Executive Vice President and Chief Administrative Officer 29 21
Anthony V. Bilotta, Jr. Executive Vice President and Chief Banking Officer 39 2
Thomas D. DeMedici Executive Vice President and Chief Credit Officer 36 10
John V. Dunne Executive Vice President and Chief Risk Officer 40+ 4
Executive Vice President and Chief Technology and Innovation
Timothy A. Swansson 17 17
Officer
17Non-GAAP Reconciliation
Appendix A: Reconciliation of GAAP to Non-GAAP For the quarter ended
(Dollars in Thousands, September 30,
Except Per Share Data) 2020
Core net income:
Net income (GAAP) $ 11,379
Non-recurring transactions - net of tax:
Bargain purchase gain (3,053)
Provision for credit losses on non-PCD loans 3,563
Merger-related expenses 3,123
Net income (non-GAAP) $ 15,012
Core earnings per share (EPS):
Weighted average common shares - basic 86,008
Weighted average common shares - diluted 86,009
Earnings per share - basic (GAAP) $ 0.13
Earnings per share - diluted (GAAP) $ 0.13
Adjusted earnings per share - basic (non-GAAP) $ 0.17
Adjusted earnings per share - diluted (non-GAAP) $ 0.17
Core return on average assets (ROAA):
Total average assets $ 7,263,202
Return on average assets (GAAP) 0.63%
Adjusted return on average assets (non-GAAP) 0.83%
18INVESTOR PRESENTATION FIRST QUARTER FISCAL 2021
You can also read