Hot Money Flows, Cycles in Primary Commodity Prices, and Financial Control In Developing Countries - Promoting Financial Integration in Africa ...
←
→
Page content transcription
If your browser does not render page correctly, please read the page content below
Hot Money Flows, Cycles in
Primary Commodity Prices, and
Financial Control In Developing
           Countries

                  Ronald McKinnon
           Emeritus Professor of economics
                 Stanford University

    Promoting Financial Integration in Africa
           Banque de France, Paris
                   May 27, 2014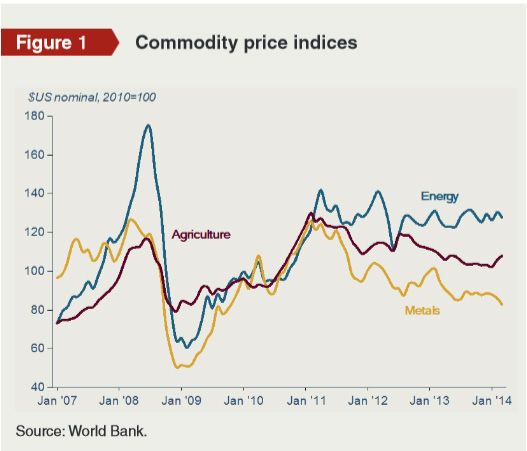
The US Dollar’s Facilitating Role as International
                         Money
                    (1945 to 2014)

                          Private         Official

Medium of Exchange     Vehicle         Intervention

Store of Value         Banking         Reserves

Unit of Account        Invoice          Peg

Standard of Deferred   Private Bonds    Sovereign Bonds
Payment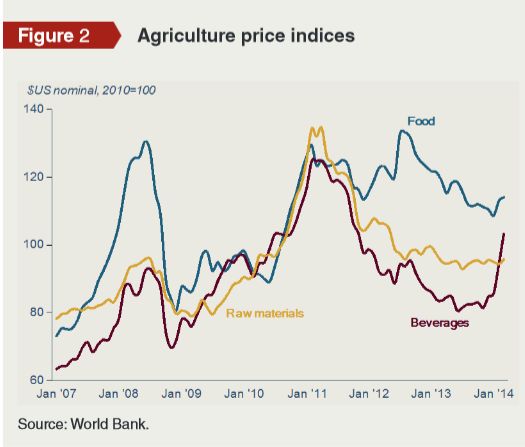
The Unloved World Dollar Standard
            1945—2014
• In major crises, IMF is lender of first resort but
  the Federal Reserve is the lender of last resort:
  Europe 2008 and 2011 Interbank dollar swaps.
• However, in setting US monetary policy, the Fed is
  inward looking and ignores the rest of the world.
• Episodes of US easy money, and /or talking the
  dollar down, provoke hot money outflows
• From the Nixon Shock of 1971 to Greenspan-
  Bernanke near-zero interest rates and
  quantitative easing in the new millennium
Tri-lemma of an Open Economy in
Traditional International Finance
• An open economy cannot have all of
1. An independent monetary policy
2. A fixed exchange rate
3. No capital controls
• Foreign exchange intervention makes the domestic
money supply endogenous. So to achieve national
monetary independence, the traditional remedy is
to float the exchange rate.
• But floating breaks down if there are wide interest
differentials between the center and peripheryFigure 1: US Interest Rates
8,0
7,0
6,0
5,0
4,0 USD Libor
10 Year Treasury
3,0
2,0
1,0
0,0
Source: FREDFigure 7. GDP Weighted Discount Rate of BRICS and G3
%
12
10
8
6
4
2
0
2000 2001 2002 2003 2004 2005 2006 2007 2008 2009 2010 2011 2012
Source: IMF, EIU BRICS G3From Tri-lemma to Dilemma for
Emerging Markets (EM)
• Wide interest differentials between the center and
periphery induce hot money inflows to EM.
• Contrary to conventional wisdom, EM with convertible
currencies cannot achieve independent monetary policies
by floating their exchange rates
• The dilemma for EM central banks:
-float and appreciate, lose export competiveness. Dollar
value of Brazilian Real doubled between 2003 and 2007.
-or intervene to buy dollars and stabilize the exchange rate,
lose monetary control, and inflate.
• Collective monetary expansion and inflation in EM spawns
bubbles in world commodity prices and other assets.Figure 2. Emerging Markets and China, Foreign Exchange Reserves (Billion USD)
8000
7000
6000
5000
4000
3000
2000
1000
0
janv.-01 janv.-02 janv.-03 janv.-04 janv.-05 janv.-06 janv.-07 janv.-08 janv.-09 janv.-10 janv.-11 janv.-12 janv.-13
Total Emerging Markets ChinaFigure 3 Headline CPI: EM and US
10
8
6
4
GDP Weighted EM CPI
US Headline CPI
2
0
-2
Source: EIU, Author's Calculation
Emerging Markest include: Brazil, Chile, China, Colombia, Czech Republic, Egypt, Hungary, India, Indonesia, Malaysia, Mexico, Philippines, Poland,
Russia, South Africa, South Korea, Taiwan, ThailandCarry Trades and Banking Crises • Carry Traders exploit the interest differential by borrowing at low interest rates in “source” currencies to invest in high-interest “investment” currencies in EM. (Dollar depreciates 2002-07.) • They are unhedged risk takers who borrow at short term in source currencies from banks. • But if banks face an unexpected crisis, they stop lending to risky borrowers and refuse to roll over old credits • Hot money then suddenly returns to the center— particularly to the US, which is seen as a safe haven under the dollar standard • Dollar appreciates, EM currencies slump
Figure 2A Change of Reserves in Selected Emerging Countries

 Source: Financial Times
Figure 4 BRICS Currencies, USD/LCU (local currency unit), Jan-2002=100
Exchange Rate Behavior on the
       Periphery: China versus Brazil
• Two Great Waves of hot money flows into the periphery:
  2002 – 2007, mid 2009 to mid 2011
• China keeps yuan/dollar rate fairly stable with slow RMB
  appreciation after mid 2005. Every morning, PBC sets Y/$
  central rate at level of the close of previous trading day.
  Daily variation of ± 1 percent (increased to ± 2 percent in
  March 2014) is then permitted. Sustains high growth.
• Brazil much closer to a free float. Dollar value of the real
  doubled between 2003 and 2007, and knocked Brazil off its
  high growth path.
• Other BRICS more like Brazil than China; heavy interveners
  but not very successful in smoothing their dollar exchange
  rates.
Daily Exchange Rate
USD/TUR (lira) & USD/IND (rupee) – 2002 to present
140
130
120
110
100
90
80
70
60
50
40
2002 2003 2004 2005 2006 2007 2008 2009 2010 2011 2012 2013 2014
USD/TUR Index USD/IND Index
Source: Bloomberg
Index base date – January 7th, 2002Figure 5. US Real Effective Exchange Rate, Jan-2000=100
125 Credit Crunch
120 Dollar Carry Trade
115
New Dollar Carry Trade
110
105 Emerging
Eurozone Market
100 Crisis Slowdown
95
90
85
80
Source: Federal ReservesFigure 6: The Greenspan-Bernanke Bubbles in U.S. Economy 2002 to 2013 (2005 =100)
240
220
200
180
160
140
120
100
80
2003 2004 2005 2006 2007 2008 2009 2010 2011 2012 2013
Case-Shiller CRB Commodity Index S&P 500 Core CPI
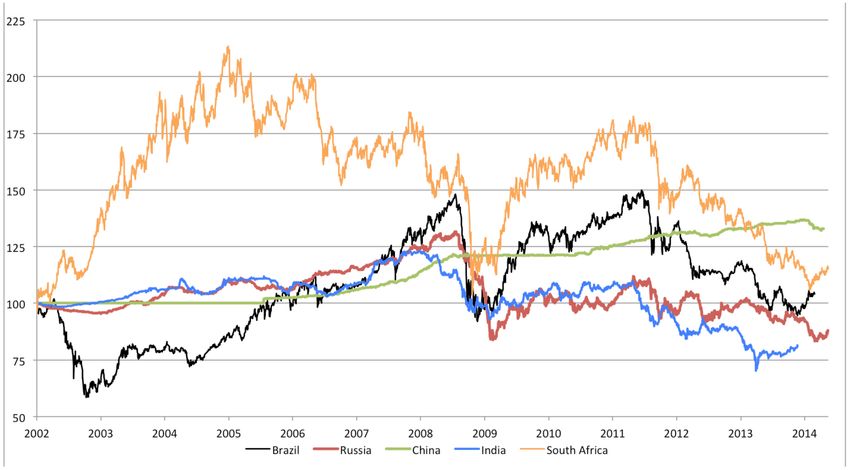
Source: BloombergCollective Bubbles in Prices of Primary Commodities in the World Economy • Ultra low interest rates at the center attracts carry traders willing to move hot money to the EM periphery • Involuntary monetary expansions in EM collectively bids up primary commodity prices. EM are important producers and consumers of primary commodities. • A banking crisis at the center then cuts off carry traders from their funding. Hot money then returns to the U.S. • EM currencies depreciate (except for China’s) and prices of primary commodities collapse. • The common monetary mechanism (waves of hot money flows) ensures high price correlations across very diverse commodities—see World Bank figures.
The Arab Spring: A Collective Food Riot?
• Sudden increases in primary commodity prices can
  devastate political systems in LDCs which depend on low
  food and fuel prices.
• Witness food riots leading to the “Arab Spring”.
• In 2010, the international prices of food grains and cereals
  virtually doubled. That December a Tunesian food vender,
  Mohamed Bouazizi, immolated himself over frustration.
  Riots followed with fall in the Tunesian government.
• Then protests spread throughout North Africa. Not pure
  contagion because food prices everywhere remained
  elevated into 2012.
• Westerners misinterpret riots as legitimate protests against
  corrupt governments. Too much support for the rioters.
Figure 8 Food/Agriculture Product Price (2005=100)
350

                                                                    Start of
                                                                    Arab Spring
300                                                                 Dec 2010

250

200

150

100

 50
      2005           2006         2007         2008          2009         2010           2011          2012   2013

 Source: Bloomberg   UN Food And Agriculture World Cereals Price Index           S&P GSCI Agriculture Index
Food Price Inflation in Sub-Saharan Africa • Poorer countries in Africa with inconvertible currencies are not much directly affected by hot money flows. • However, they are heavily influenced by fluctuations in prices of primary commodities which dominate their export bills. • Export diversification into other primary commodities is of limited usefulness if they mainly fluctuate together. • On the import side, evidence suggests that a traditional exchange peg may best limit the pass through of world food-price inflation into the domestic economy.
Disappointing Recovery of the United
       States from the 2008 Crisis
• All the industrial counties (IE)now following
  the same monetary policy: near zero short-
  term interest rates, massive QE at longer term
• Makes EM and developing economies even
  more vulnerable to hot money flows and
  cycles in primary commodity prices.
• But no great benefit to the IE themselves
Figure 9. Size of Central Bank Balance Sheet, % of GDP 40% 35% 30% 25% 20% 15% 10% 5% 0% Source: Bloomberg, OECD Stat Japan UK US EuroArea
Figure 10. GDP growth: Developed vs. Developing World
  10
  %

   8

   6

   4

   2

   0

  -2

  -4

  -6
 Source: IMF     Advanced Economies       Emerging and Developing Countries
Near Zero Interest Rates and Bank
     Disintermediation in the United States
• Ultra low U.S. interest rates associated with a
  sluggish recovery from 2008 crisis
• Worsening income distribution with restraints on
  credit to small and medium sized industries.
• Direct finance is okay: bond and stock markets are
  thriving to serve large corporate enterprises
• But indirect finance through banks serving SMEs is
  in relative decline.
• Banks stop being intermediaries and become agents
  in the credit markets for corporations.
Moral of this Unhappy Story: What
Governments Should Do?
• Suppress bubble-producing carry trades by limiting
interest differentials between the “center” and the
“periphery”.
• U.S. Fed should abandon its zero interest policy, and
phase in modestly higher rates in conjunction with the
other industrial countries represented by the ECB, Bank
of England, and Bank of Japan.
• EM and SSA likely will still need controls on capital flows
when interest rate misalignments are extreme.
• The U.S. cannot impose such controls without
undermining the world’s payments system.You can also read