Techno-Economic Appraisal of Biodiesel from Jatropha Curcas: An Egyptian Case Study by
←
→
Page content transcription
If your browser does not render page correctly, please read the page content below
Techno-Economic Appraisal of Biodiesel
       from Jatropha Curcas:
       An Egyptian Case Study
                 by
     Prof. Guzine I. El Diwani, Prof.Dr.Shadia Rageb, Prof.Dr. Salwa
                        Hawash , Dr. Nahed Kamal ,
                     National Research Centre, Egypt
            Chemical Engineering and Pilot Plant Department
            Email corresponding author:geldiwani@yahoo.com
                                   And
                           Prof.Dr. Ihab Farag
                     Univer. Of New Hampshire, USA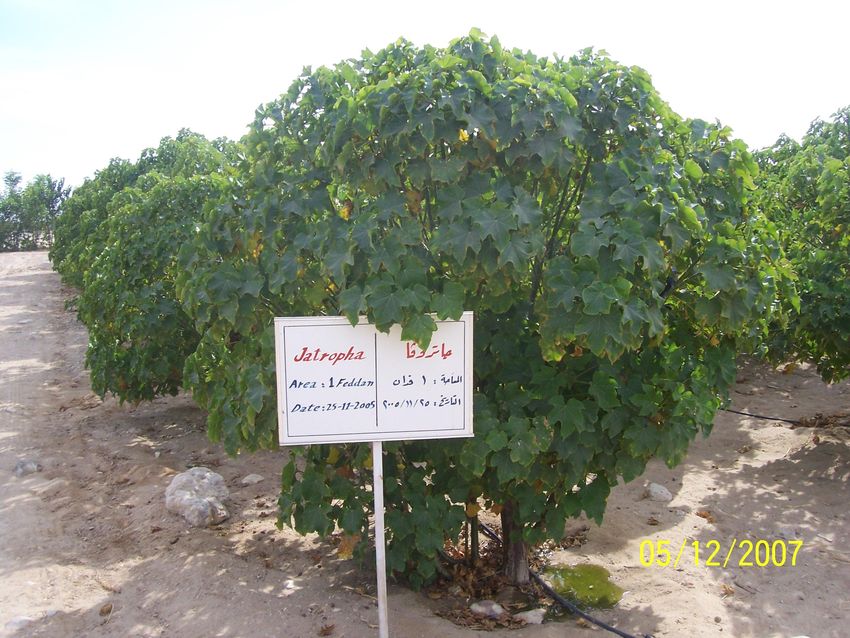
1. Introduction
1- Biodiesel is a fuel made from any vegetable oil
  including oils pressed straight from the seeds (virgin
  oils) such as soybean, sunflower, canola, coconut and
  Jatropha Curcas (JC).
2-It can be produced from any material that contains
  fatty acids.
3- Thus, various vegetable fats and oils, animal fats,
  waste greases, and edible oil processing wastes can
  be used as feedstock for biodiesel production.

4- The choice of feedstock is based on several variables
   such as local availability, cost, government support
   and performance as a fuel.
5-Biodiesel as a fuel runs in any unmodified diesel
  engine and it has been shown to give engine
  performance generally comparable to that of
  conventional diesel fuel while reducing engine
  emissions of particulates, hydrocarbons and carbon
  monoxide .
6- It has been reported that when biodiesel was used,
  CO was reduced by 8.6%, hydrocarbons by 30.7%,
  and particulate emissions by 63.3%. However, CO2
  emissions were increased by 2.6%and NOx emissions
  were increased by 5%.
7- Biodiesel is typically mixed with regular diesel in
  blends between 5% and 50% (designated by a B
  followed by the percentage of biodiesel in the
  blend).

8- Any biodiesel blend (even B100) can be used in
  standard diesel engines without modification to the
  engine .
9- There are several benefits for using biodiesel as a
  blended fuel in diesel engines such that most major
  car and equipment manufactures have issued
  statements certifying that blends up to B20 are
  acceptable for use in their diesel engines without
  loss of warranty.
10- The economics of biodiesel production from
  several oil seeds in general and from JC in particular
  have been published in several reports issued
  worldwide.
11- This work is concerned with the techno-economic
  appraisal of biodiesel production from JC in Egypt.

12- Although several articles and reports have
  addressed the issue, appraisal under Egyptian
  conditions is highly needed for application in
  the country in addition to providing guidelines
  for adoption under similar conditions
  worldwide.
13-The first section includes the technical
  aspects as obtained through an extensive R&D
  program.
14- It is then followed by simulation and basic
  engineering of the crushing, extraction,
  transesterification and purification stages.
15-The third section includes the financial
  aspects and analysis through the formulation
  and assessment of several scenarios taking
  into consideration the productivity of seeds
  per unit area and the extent of recovery of
  raw oil from the JC seeds.
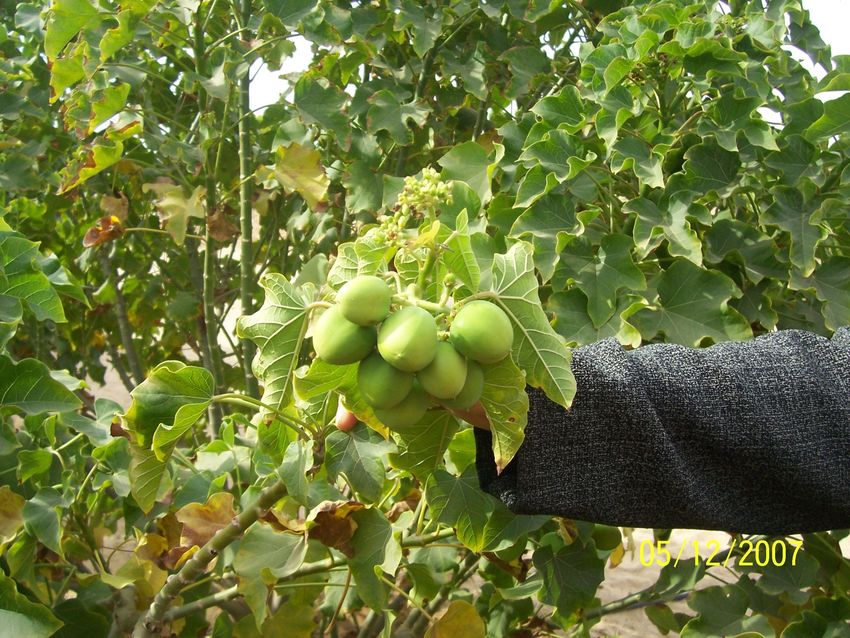
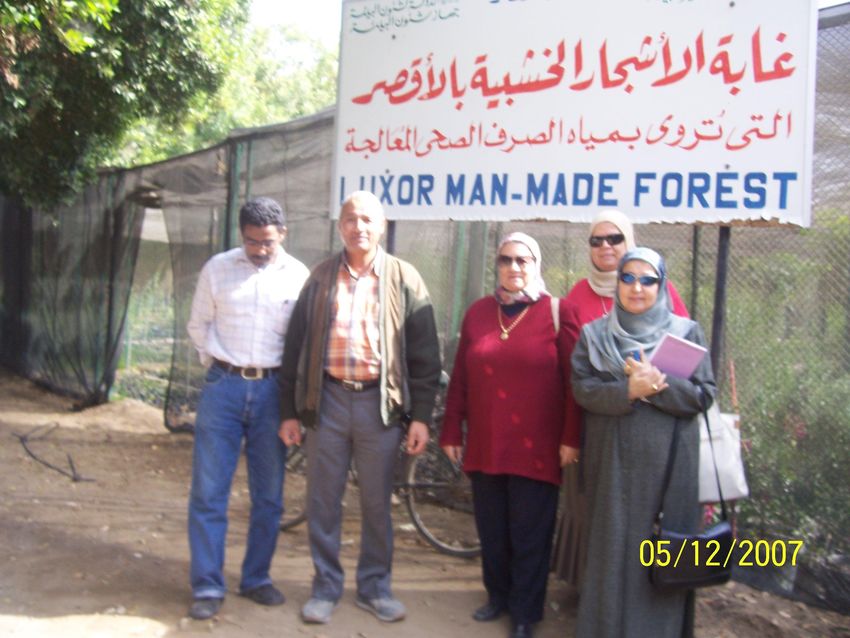
2. Basis of Technical Aspects 2.1. Jatropha Curcas Plantation in Egypt. Jatropha plant is cultivated in different places in Upper Egypt and in Egyptian deserts. Jatropha trees were irrigated with municipal wastewater primary treated. Average productivity for Jatropha fruits was 3.7 tons fruit /4000 m2 (acre) with average oil recovery of 25% by weight from seeds.
Luxor 350 Feddans Start 2002
Sohag 250 Feddans Start 2003
Suez 400 Feddans
New Valley 100 Feddans Start 2006
4000 Feddans Start 2009
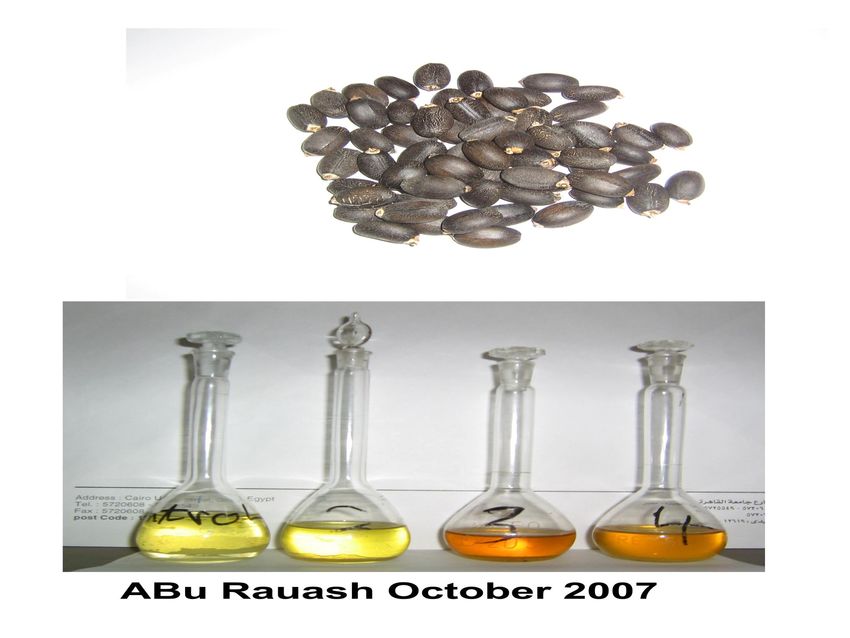
Abu Rawash 2 Feddans Start 2006
(as study)2.2. Optimum biodiesel production conditions from Jatropha plant. Through extensive experimental work on bench and pilot scale, optimum operating conditions for Jatropha oil and biodiesel production have been obtained and are taken as the basis for this work as outlined below.
2.2.1. Jatropha oil Extraction

The extraction process essentially comprises
  fruit dehulling, seed crushing to 2 mm,
  extraction of oil using hexane as solvent at
  ratio 1:5 seeds to hexane and separation of
  hexane from oil by hexane evaporation under
  vacuum at 40°C.
2.2.2. Transesterification

Conditions for transesterification include:
• Use of methanol as alcohol for transesterification
  at molar ratio of 6:1 alcohol :oil.
• Use of sodium hydroxide as catalyst at a 0.75% or
  potassium hydroxide at a 1% based on oil weight.
• Mix the reaction mixture at 60 rpm for 10
  minutes and continue mixing for one hour at a
  temperature 65ºC to complete the reaction.
• 94 – 98% reactant oil conversion to biodiesel is
  achieved and the overall reaction product is left to
  settle in a clarifier for two hours.
• Glycerol is obtained as byproduct at a rate of about
  10% of produced biodiesel and settled as the lower
  phase in the reaction product at 50% purity.
• This lower phase is separated and purified using
  phosphoric acid to obtain glycerol 85% purity.
2.2.3. Seed cake evaluation

• a- Seed cake obtained form oil extraction which
  constitutes about 55- 75% of the seed, is dried at 60ºC to
  eliminate hexane traces; positive results for use as
  fertilizer have been obtained.
• b- Dried seed cake is also tested animal fodder and
  proved successful when substituting conventional rabbit
  fodder by 7.5% and by 30% for gaats. It is to be noted
  that the content of phorbol ester of 0.085%, which is the
  cause of toxicity, can be removed by special treatment.

Further investigations are to be undertaken for treating the
  seed cake and testing for use as animal fodder.
2.2.4. Treatment and recovery of side – streams

The basic processing steps for biodiesel
Figure (1) Material Balance based on pilot-scale experimental results
3. Techno-economic Aspects for Biodisel Production
under Egyptian Conditions
3.1. Capacity of Production Facilities

• Biodiesel is produced in large capacities on the
  commercial scale in US and Europe.
• Plants up to 85 million gallons / year (about 275
  thousand tons/year) production are in operation in the
  US.
• Conversely, in developing countries, biodiesel
  production is still on small-scale.
• Within the scope of this work an economic
  model and indicators for two nominal annual
  capacities namely 8000 and 50000 metric ton
  have been developed. The optimum process
  conditions, as developed in our laboratory, and
  outlined in last section are adopted.
3.2. Simulation and Basic Engineering

• Simulation       and      basic     engineering     of
  extraction/transesterification of raw oil for the two
  proposed capacities has been conducted .
• Simulation has been conducted using ASPENPLUS
  from Aspentech which is the most powerful
  simulation software on the market.
• The software from Haas has been used as a basis
  after introducing necessary modifications to adopted
  for the raw materials, process conditions and
  capacities proposed in this work.
• The simulation includes the following section:
  crushing, extraction, transesterification, biodiesel
  purification and glycerol purification.
• Simulation output including material and
  energy balance and specifications of essential
  components marked on Figure (2) are outlined
  in Table (1) for the 50000 tons/yr production
  capacity.
• Results have been used for the cost
  estimation of capital costs for the two
  proposed capacities respectively.
a.      Methanol Recovery Column:-                          b.Biodiesel purification column:-
Component Fractions                                         Component split fractions
Outlet streams       MEOHREC                 EST1                             Outlet Stream
  Methanol          .94000          .59999e-01                                                                               Meohwat   Biodiesel   Oilrec
  Oil                 .35236e-02        .99648
  Biodiesel         .18283e-14         1.0000                  methanol              .93710        .62903e-01     .28201e-13
  Glycerol         .18901e-15          1.0000                 oil                 .14329e-04       .35854e-02           .99640
  NaOH                  .11422          .88578                biodiesel          .63795e-03           .97293        .26429e-01
  Water                .11422          .88578                 glycerol             .11152              .85827        .30212e-01
 Summary of key results                                       naoh                 .93417           .65830e-01     .95110e-15
  Number of stages                        7                   water                .93417           .65830e-01     .95110e-15
  Top stage temperature          c            29.2638
  Bottom stage temperature        c           65.4330        *** summary of key results***
  Top stage liquid flow          kmol/hr      73.5179        number of theoretical stages                         8
  Bottom stage liquid flow       kmol/hr      36.8265         top stage temperature         c                154.101
  Bottom stage vapor flow        kmol/hr      56.9743         bottom stage temperature     c                  287.394
  Molar reflux ratio                          2.00000         top stage liquid flow        kmol/hr             23.6998
  Molar boilup ratio                          1.54710         bottom stage liquid flow    kmol/hr             0.79661
  Condenser duty (w/o subcool) kw           -775.115          top stage vapor flow        kmol/hr             1.39521
  Reboiler duty                   kw         768.907         bottom stage vapor flow      kmol/hr             104.632
                                                              molar reflux ratio                              0.94817
 Oil feed pump:-                                              molar boilup ratio                              131.346
Input data:-                                                  condenser duty (w/o subcool) kw               -2,055.33
  Outlet pressure bar                 4.00000                    reboiler duty                kw          2,519.85
  Driver efficiency                   1.00000
 *** Results ***
                                                            c. Glycerol column:-
  Volumetric flow rate cum/hr          8.31471
                                                                      Component split fractions
               Pressure change bar                3.80000
                                                                               outlet streams
   Npsh available meter                2.33736
                                                                                           watmeoh          glycerol
   Fluid power kw                      0.87766
                                                            methanol                     1.0000             .45499e-05
   Brake power kw                      2.23315
                                                            biodiesel                    .36749               .63251
   Electricity kw                      2.23315
                                                                   glycerol                 .17395e-01               .98260
   Pump efficiency used                0.39302
                                                                   water                       1.0000            .15490e-08
   Net work required kw                 2.23315
                                                                      Summary of key results
   Head developed meter                44.4806
                                                               top stage temperature           c                  68.9594
                                                               bottom stage temperature        c                  269.036
                                                               top stage liquid flow          kmol/hr             65.8132
                                                               bottom stage liquid flow       kmol/hr             7.68049
                                                              bottom stage vapor flow        kmol/hr             76.0203
                                                               molar reflux ratio                                  2.00000
                                                               molar boilup ratio                                 9.89785
                                                               condenser duty (w/o subcool) kw                   -1,216.86
                                                               reboiler duty                     kw               1,364.40

                 Table 1 Material & Energy Balance and Specification Of Essential Components
(2) Flowsheet of the complete crushing/extraction/transesterification process
3.3 Basis of Estimates for the Economic Model:
Option I In this option I it is assumed that each of the essential processing stages namely plantation, crushing & extraction, and transesterification & purification could be considered as a sub- project and financed separately.
Option II In this option II it is assumed that the whole project is integrated i.e. seeds from the plantation stage are delivered directly to the extraction stage with no profit. Similarly, the raw oil is delivered directly to the transesterification stage. All other assumptions are similar to Option I except for some consequent assumptions such as decrease in working capital and operating costs corresponding to no direct profits for seeds or raw oil. The Basic assumptions for both cases are presented below.
Table (2) Alternative assumptions for high and average productivities of fruits and seeds

              Item                High Productivity            Average Productivity

  Ton Fruits Per 4000 m2 (acre)                5.58                         3.43

   Tons Seed per 4000 m2 (acre)                3.2                           2.0
Raw Materials-Intermediate Products & Products/Prices:
Table (3) Estimated prices of Raw Materials and Products
  Item             Price $/ton                    Basis of Estimates
 Hexane                791                            Market Price

 Methanol              818                            Market Price

  NaOH                 455                            Market Price

 H3PO4                 729                            Market Price

  Seeds          145-230           Actual production costs *1.25 to account for profits
                                   for the plantation stage)

 Raw Oil             300-625      Prices that ensure a Simple Rate of Return on
                                 Investment () for the crushing /extraction stage of 12-
                                 15%

 Biodiesel             945       US price (November 2010)

  Cake                 145       Market Price of equivalent product used as animal
                                 fodder

 Glycerol              545       Market Price
Capital Investments The capital investments for the process components have been estimated as follows
Table (4) Basis of Estimates of Capital Costs

Item                          %           Relative to
Fixed Capital
Purchased Equipment               100     Purchased Equipment*
Equipment Setting                  30     Purchased Equipment
Piping                             15     Purchased Equipment
Civil                              15     Purchased Equipment
Steel                              15     Purchased Equipment
Instrumentation                    10     Purchased Equipment
Electrical                         10     Purchased Equipment
Insulation                         8      Purchased Equipment
Paint                               8     Purchased Equipment
Other                              10     Purchased Equipment
Engineering                        10     Total Fixed Capital
Contract Fee                        5     Total Fixed Capital
Contingencies                      10     Total Fixed Capital
Working Capital                    25     Annual Operating Costs
* Prices of Equipment have been estimated from reported sources
Operating Costs:

In addition to raw materials costs as estimated
  according to actual consumption from pilot
  experimental results and prevailing costs,
  other components of operating costs are
  presented in Table (5).
Table (5) Basis of estimates of operating costs others than raw materials

  Labour                       $/Annum
  Engineers                      4364
  Supervisors                    3273
  Adminstration                  2182
  Labourer                       1091
   Maintenance                    2%                      of Capital
   Others                         5%           of Total Annual Operating Cost
4 Scenarios have been assumed for each
    Option as depicted in Figure (3)
I II
High Productivity Average Productivity
(5.58 ton fruit/acre) (3.43 ton fruit/fed)
High Recovery High Recovery
(45% oil ) (45% oil )
IV III
Average Productivity High Productivity
(3.43 ton fruit/acre) (5.58 ton fruit/acre)
Average Recovery Low Recovery
(35% oil ) (25% oil )
Figure (3)Scenarios for the Two Capacities:
8000 & 50000 tons/yr4. Results and Analysis 4.1 Area Requirements:- The area requirements for the assumed Scenarios are presented in Figure (4).
Figure (4) Area Requirements (4000 m2)

               80000
               70000
               60000
               50000
8000 ton/yr    40000
50000 ton/yr   30000
               20000
               10000
                   0
                       SC I   SC II   SCIII     SCIV
Figure (5) Distribution of annual operating cost
for SCIII - 50000ton/yr
Labour
1%
Maintenance Others
1% 5%
Raw Materials
94%Figure (7) Financial Indicators for 50000
Ton/Yr Biodiesel
160
Total Capital
140 Investments Millions
$
120
100 Total Production
USD ($)
Costs Millions $
80
60
Total Profits
40 Millions$
20
Average SRR%
0
SC I SC II SC III SC IV4.2.3 Distribution of Capital Costs over Processing Stages The distribution of capital costs for the two capacities is demonstrated in Figures (8) and (9). Plantation represents the major cost component.
Figure(8) Distribution of Capital Costs
           Over Processing Stages %          8000 Ton/yr
80

70

60

50                                      P l a nt a t i on

40
                                        C r u sh i n g /
                                        Ex t r a c t i o n
30
                                        T r a n se st e r i f i c a t i o n
20

10

 0
         I      II     III     IV
Figure (9) Distribution of Capital Costs
Over Processing Stages % 50.000 Ton/yr
80
70
60 P l a nt a t i on
50
C r u sh i n g /
40 Ex t r a c t i o n
30 T r a n se st e r i f i c a t i o n
20
10
0
I II III IVFigure (10) SRR % for Transesterification at
constant biodiesel Price $945/ton
200
150
8000 ton/y r
100
50000 ton/y r
50
0
SC I SC II SCIII SCIV4.2.5 Prices of Biodiesel for a value of SRR of
10%. (national interest rate)Table (6) Specific Biodiesel Price for Transesterification (SRR 10%)
SC I SC II SCIII SCIV
Capacity $/ton
8000 ton/yr 459 674 575 781
50000 ton/yr 425 642 541 746
Capacity $/liter
8000 ton/yr 0.41 0.61 0.52 0.70
50000 ton/yr 0.38 0.58 0.49 0.674.3 Financial Indicators for Option II In this option II it is assumed that the whole project is integrated i.e. seeds from the plantation stage are delivered directly to the extraction stage with no profit. Similarly, the raw oil is delivered directly to the transesterification stage. All other assumptions are similar to Option I except for some consequent assumptions such as decrease in working capital and operating costs corresponding to no direct profits for seeds or raw oil.
Table (7) Economic Indicators for Integrated Scheme – Option II

                                        Annual Biodiesel Production 8000 Tons
                                          SC I      SC II     SC III      SC IV

Total Capital Inv estments $              11.9      17.6       18.1        21.1

Total Production Costs $                   1.2       1.2       5.5         5.9

Total Profits $                            5.3       4.2       6.3         4.9

Av erage SRR%                             44.5      24.0       35.1        23.5

                                        Annual Biodiesel Production 50000 Tons
Item/Scenario                             SC I      SC II     SC III      SC IV

Total Capital Inv estments Millions $     65.1      65.1       97.4       119.7

Total Production Costs Millions $          6.7       6.7       33.9        36.5

Total Profits Millions $                  34.0      27.7       39.8        31.2

Av erage SRR%                             52.2      28.4       23.5        26.1
Table (8) Prices of Biodiesel for SRR 10%-Integrated System- Option II
SC I SC II SCIII SCIV
Capacity $/ton
8000 ton/yr 435 656 380 610
50000 ton/yr 396 607 357 584
Capacity $/liter
8000 ton/yr 0.41 0.61 0.52 0.7
50000 ton/yr 0.38 0.58 0.49 0.67• The SRR varied between 19& 36% and 22 &44 % for 8000 and 50000 ton/annum respectively. Positive economic indicators have also been obtained if it is assumed that all stages are considered as an integrated project. • The price of biodiesel that provides a SRR of 10 % was in the range of $ 0.3-0.7/liter for the different assumed scenarios which is lower than the prevailing price of biodiesel (about $1/liter)
• Thus, in view of experimental results and
  economic assumptions, there are positive
  prospects for production of biodiesel from
  Jatropha Curcas under Egyptian conditions.
You can also read


