Eagle Eye Equities Index - July 26, 2021 - Sharekhan
←
→
Page content transcription
If your browser does not render page correctly, please read the page content below
Eagle Eye Equities
                                                     July 26, 2021

                                                                Index
                                                          Punter’s Call
                                                       Looking Trendy
                                                           Nifty Trader
                                                          Smart Charts
                                                     Momentum Swing
                                       CTFT (Carry Today For Tomorrow)
                                                             Bank Nifty
                                                      Bank Nifty Trader
                                                           Key Indices
                                                   Day Trader’s Hit List

       Visit us at www.sharekhan.com

For Private Circulation only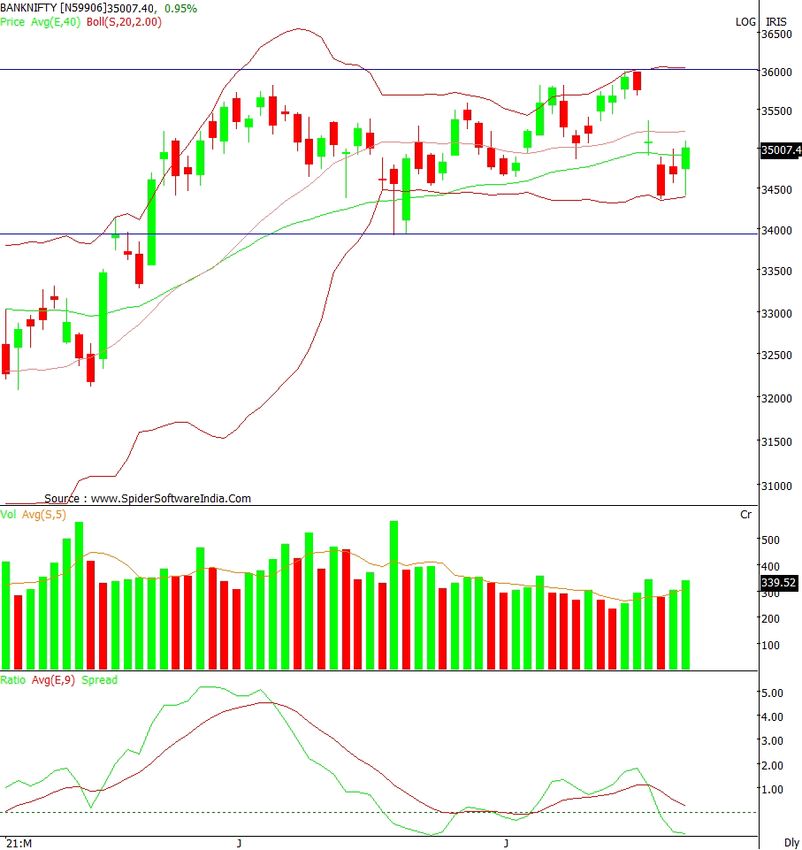
Sharekhan Eagle Eye Equities
Punter’s Call
Tug of war
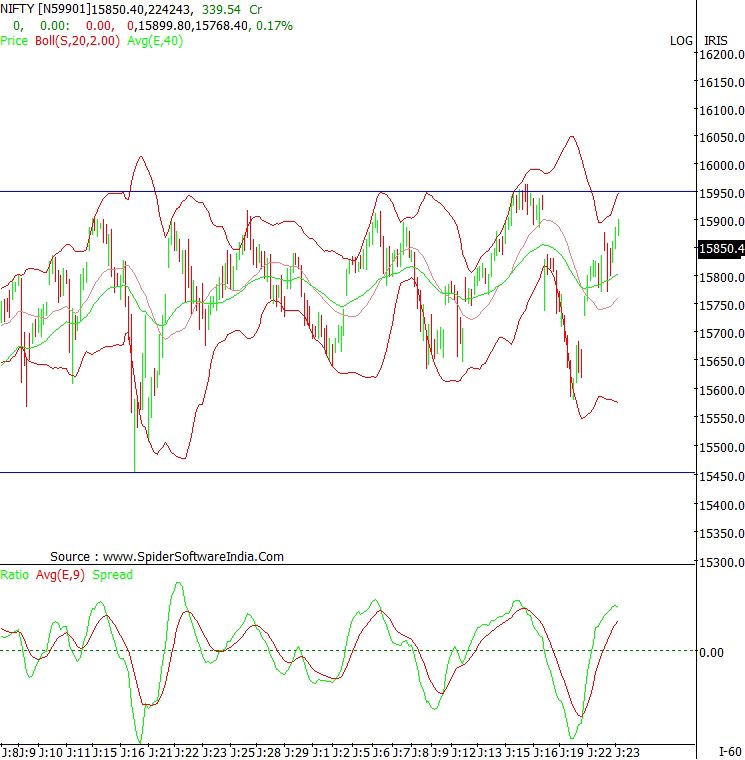
July 23, 2021 Nifty daily: 15,856.05
The Nifty witnessed a volatile day of trade on July
23. It opened on a positive note and swung both
ways to close the day with marginal gains. After a
sharp rebound from the junction of the 40-DEMA
and the daily lower Bollinger Band on July 22, the
Nifty consolidated on July 23 with a positive bias.
Broadly, the index is trading in the range of 15500-
16000 since the past one month and unless we get a
decisive move on either side the range bound price
action is likely to continue. Some Nifty heavyweights
shall be declaring their quarterly results during the
60-minute
weekend which can provide the much needed trigger
for the index to make a decisive move. In terms of
levels, 15950-16000 is the crucial resistance zone
while 15640-15570 is the support zone for the Nifty.
Other technical observations
On the daily chart, the Nifty is above the 20-day
moving average (DMA) and the 40-DEMA of 15788
and 15647, respectively. The momentum indicator is
bearish on the daily chart.
On the hourly chart, the Nifty is above the 20-hour
moving average (HMA) and the 40-HEMA of 15769
and 15805, respectively. The hourly momentum
indicator is bullish. The market breadth was negative Market breadth
BSE NSE
with 842 advances and 1103 declines on the National
Todays Close 52,975.8 15,856.05
Stock Exchange.
Advances 1,570 842
Decline 1,676 1,103
Unchanged 123 324
Volume (Rs.) 5,257.22 cr 68,660.84 cr
July 26, 2021 2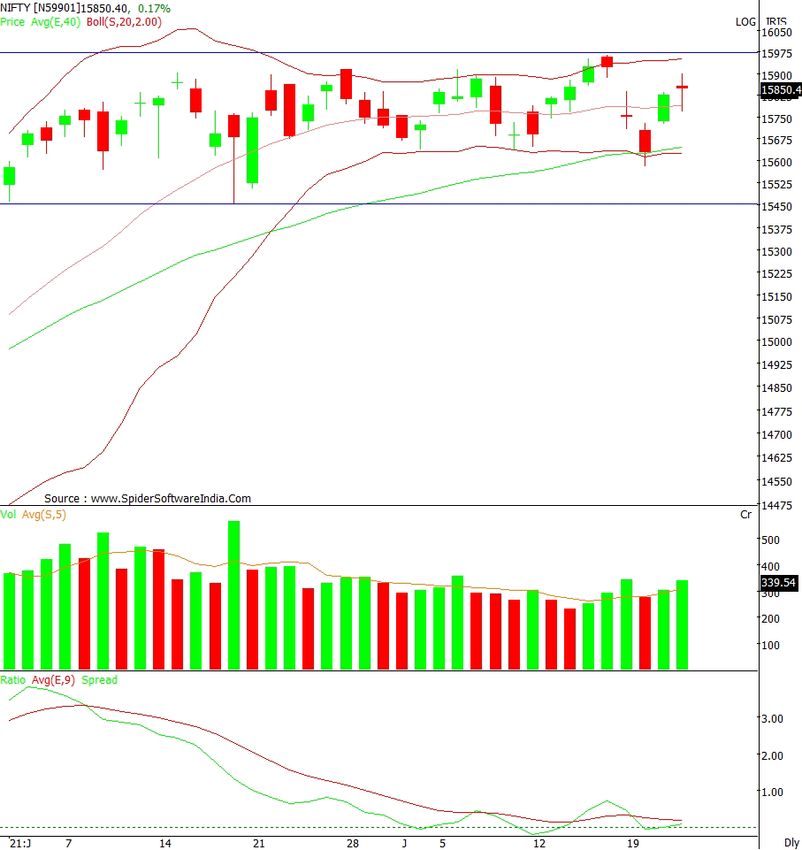
Sharekhan                                                                                                                          Eagle Eye Equities

Looking Trendy
Short Term Trend                                                           Medium Term Trend
              Lower                   Upper              Support /                                                                       Support /
Index                    Trend                                              Index          Target       Trend           Reversal
             Boundary                Boundary           Resistance                                                                      Resistance
Nifty         15450       ßà             16000         15450 /16000         Nifty          16800            á            15000        15000 / 16800
NOTE: Reversal on closing basis                                             NOTE: Reversal on closing basis

                                                                     Icon guide
                                    á
         á     Up                       Down                ßà       Sideways                 Downswing matures                    Upswing matures

Nifty Trader
                               Support                                                                      Resistance
                                15788                                                                         15962
                                15726                                                                         16000
                                 15647                                                                          16249
                              20 DSMA                                                                       40 DEMA
                                 15788                                                                          15647

Smart Charts
                                                               Stop Loss                               Call      Potential %
                                                                                Buy Price/
 Date           Scrip Name                       Action      (On closing                           Closing       P/L at Exit/      Target 1   Target 2
                                                                                 Sell Price
                                                                  Basis)                       Price/ CMP           Current
 25 Jun 21      Axis Bank July Fut                Buy            724.00             756.15          755.85              -0.04%      790.00     822.00
 22 Jun 21      M & M July Fut                    Buy            743.00             782.60          764.40              -2.33%      819.00     854.00
NOTE: Kindly note that all stop losses in Smart Charts are on closing basis unless specified.
TPB: Trailing profit booked

Momentum Swing
                                                                                                     Call     Potential %
                                                            Stop Loss/      Buy Price/
 Date           Scrip Name                  Action                                               Closing      P/L at Exit/       Target 1     Target 2
                                                              Reversal       Sell Price
                                                                                              Price/CMP          Current
 23 Jul 21      Auro Pharma July Fut         Buy               949.00             969.00         963.80            -0.54%          987.00      1017.00
 12 Jul 21      Reliance July Fut            Buy              2049.00           2101.40         2102.00             0.03%        2188.00      2230.00
NOTE: Kindly note that all stop losses in Momentum swing are on an intra-day basis.
TPB: Trailing profit booked
1) The stop loss should be placed after 9.17am in order to avoid freak trade.
2) The same will be revised in the TradeTiger terminal every day for the pop-ups.

CTFT (Carry Today For Tomorrow)
                                                                                                                 Potential %
                                                              Stop Loss/     Buy Price/       Call Closing
 Date          Scrip Name                      Action                                                            P/L at Exit/    Target 1     Target 2
                                                                Reversal      Sell Price       Price/CMP
                                                                                                                    Current

 23 Jul 21     SBI July Fut                      Buy             422.00            428.30           429.80              0.35%      435.00      440.00
 22 Jul 21     ITC July Fut                      Buy      Booked Profit            207.60           210.00               1.16%     212.00      215.00
TPB: Trailing profit booked
1) The stop loss should be placed after 9.17am in order to avoid freak trade.
2) The same will be revised in the TradeTiger terminal every day for the pop-ups.

July 26, 2021                                                                                                                                         3
Sharekhan Eagle Eye Equities
Bank Nifty
Short Term Trend Medium Term Trend
Lower Upper Support / Support /
Index Trend Index Target Trend Reversal
Boundary Boundary Resistance Resistance
Bank Nifty 33900 ßà 35200 33900 / 35200 Bank Nifty 37708 á 32500 32500/37708
NOTE: Reversal on closing basis NOTE: Reversal on closing basis
Icon guide
á
á Up Down ßà Sideways Downswing matures Upswing matures
Bank Nifty Trader Bank Nifty Daily
Support Resistance
34919 35214
34630 35347
34357 35675
20 DSMA 40 DEMA
35214 34919
Key Indices
Index Target Trend Reversal Support / Resistance
Nifty FMCG 37000 á 35790 35790 / 37000
Nifty IT 30600 á 28500 28500 / 30600
Nifty Metal 5500 á 5100 5100 / 5500
Nifty Pharma 15000 á 14350 14350 / 15000
Nifty Mid Cap 100 28200 á 26700 26700 / 28200
Nifty Small Cap 100 10750 á 10000 10000 / 10750
Index Lower Boundary Trend Upper Boundary Support / Resistance
Nifty Auto 10000 ßà 10450 10000 / 10450
Nifty Fin. Service 16100 ßà 16700 16100 / 16700
July 26, 2021 4Sharekhan Eagle Eye Equities
Day Trader’s Hit List
For July 26, 2021
Support Levels Close Resistance Levels
Scrip Name Action
S2 S1 (Rs.) R1 R2
Nifty 15646.0 15788.0 15850.40 15900.0 16000.0 Buy Above R1/ Sell Below S1
Bank Nifty 34724.0 34900.0 35007.40 35100.0 35750.0 Buy Above R1
Axis Bank 740.0 747.0 756.00 764.0 774.0 Buy Above R1
Bajaj Finance 6095.0 6140.0 6177.00 6244.0 6350.0 Buy Above R1
HDFC 2455.0 2477.0 2484.50 2502.0 2531.0 Buy Above R1
HDFC Bank 1384.0 1435.0 1443.00 1448.0 1467.0 Buy Above R1
Hindustan Unilever 2322.0 2350.0 2358.95 2374.0 2420.0 Buy Above R1/ Sell Below S1
INFOSYS 1566.0 1580.0 1589.00 1600.0 1625.0 Buy Above R1
ICICI Bank 663.0 668.0 676.00 678.0 690.0 Buy Above R1
ITC 208.0 210.0 212.40 214.0 221.0 Buy Above R1
Kotak Bank 1695.0 1710.0 1719.75 1728.0 1746.0 Buy Above R1
LT 1580.0 1602.0 1617.00 1628.0 1645.0 Buy Above R1
Maruti 7200.0 7246.0 7282.50 7340.0 7431.0 Buy Above R1
Reliance Industries 2065.0 2098.0 2103.00 2115.0 2200.0 Buy Above R1
SBI 422.0 425.0 428.60 432.5 436.0 Buy Above R1
SunPharma 684.0 688.0 694.00 699.0 720.0 Buy Above R1
Tata Steel 1262.0 1270.0 1280.00 1296.0 1320.0 Buy Above R1
TCS 3174.0 3200.0 3208.20 3227.0 3260.0 Buy Above R1/ Sell Below S1
Titan 1673.0 1697.0 1700.75 1715.0 1755.3 Buy Above R1/ Sell Below S1
Zeel 200.0 204.6 205.90 207.4 211.8 Buy Above R1
*Note: Closing price of Nifty futures is last traded price of Nifty futures on NSE
SL=Stoploss
July 26, 2021 5Know more about our products and services
For Private Circulation only
Disclaimer: This document has been prepared by Sharekhan Ltd. (SHAREKHAN) and is intended for use only by the person or entity
to which it is addressed to. This Document may contain confidential and/or privileged material and is not for any type of circulation
and any review, retransmission, or any other use is strictly prohibited. This Document is subject to changes without prior notice.
This document does not constitute an offer to sell or solicitation for the purchase or sale of any financial instrument or as an official
confirmation of any transaction. Though disseminated to all customers who are due to receive the same, not all customers may
receive this report at the same time. SHAREKHAN will not treat recipients as customers by virtue of their receiving this report.
The information contained herein is obtained from publicly available data or other sources believed to be reliable and SHAREKHAN
has not independently verified the accuracy and completeness of the said data and hence it should not be relied upon as such. While
we would endeavour to update the information herein on reasonable basis, SHAREKHAN, its subsidiaries and associated companies,
their directors and employees (“SHAREKHAN and affiliates”) are under no obligation to update or keep the information current. Also,
there may be regulatory, compliance, or other reasons that may prevent SHAREKHAN and affiliates from doing so. This document is
prepared for assistance only and is not intended to be and must not alone be taken as the basis for an investment decision. Recipients
of this report should also be aware that past performance is not necessarily a guide to future performance and value of investments
can go down as well. The user assumes the entire risk of any use made of this information. Each recipient of this document should
make such investigations as it deems necessary to arrive at an independent evaluation of an investment in the securities of companies
referred to in this document (including the merits and risks involved), and should consult its own advisors to determine the merits and
risks of such an investment. The investment discussed or views expressed may not be suitable for all investors. We do not undertake to
advise you as to any change of our views. Affiliates of Sharekhan may have issued other reports that are inconsistent with and reach
different conclusions from the information presented in this report.
This report is not directed or intended for distribution to, or use by, any person or entity who is a citizen or resident of or located in any
locality, state, country or other jurisdiction, where such distribution, publication, availability or use would be contrary to law, regulation
or which would subject SHAREKHAN and affiliates to any registration or licensing requirement within such jurisdiction. The securities
described herein may or may not be eligible for sale in all jurisdictions or to certain category of investors. Persons in whose possession
this document may come are required to inform themselves of and to observe such restriction.
The analyst certifies that the analyst has not dealt or traded directly or indirectly in securities of the company and that all of the
views expressed in this document accurately reflect his or her personal views about the subject company or companies and its or
their securities and do not necessarily reflect those of SHAREKHAN. The analyst and SHAREKHAN further certifies that neither he
or his relatives or Sharekhan associates has any direct or indirect financial interest nor have actual or beneficial ownership of 1% or
more in the securities of the company at the end of the month immediately preceding the date of publication of the research report
nor have any material conflict of interest nor has served as officer, director or employee or engaged in market making activity of the
company. Further, the analyst has also not been a part of the team which has managed or co-managed the public offerings of the
company and no part of the analyst’s compensation was, is or will be, directly or indirectly related to specific recommendations or
views expressed in this document. Sharekhan Limited or its associates or analysts have not received any compensation for investment
banking, merchant banking, brokerage services or any compensation or other benefits from the subject company or from third party
in the past twelve months in connection with the research report.
Either SHAREKHAN or its affiliates or its directors or employees / representatives / clients or their relatives may have position(s), make
market, act as principal or engage in transactions of purchase or sell of securities, from time to time or may be materially interested
in any of the securities or related securities referred to in this report and they may have used the information set forth herein before
publication. SHAREKHAN may from time to time solicit from, or perform investment banking, or other services for, any company
mentioned herein. Without limiting any of the foregoing, in no event shall SHAREKHAN, any of its affiliates or any third party involved
in, or related to, computing or compiling the information have any liability for any damages of any kind.
Compliance Officer: Mr. Joby John Meledan; Tel: 022-61150000; email id: compliance@sharekhan.com;
For any queries or grievances kindly email igc@sharekhan.com or contact: myaccount@sharekhan.com
Registered Office: Sharekhan Limited, 10th Floor, Beta Building, Lodha iThink Techno Campus, Off. JVLR, Opp. Kanjurmarg
Railway Station, Kanjurmarg (East), Mumbai – 400042, Maharashtra. Tel: 022 - 61150000. Sharekhan Ltd.: SEBI Regn. Nos.:
BSE / NSE / MSEI (CASH / F&O / CD) / MCX - Commodity: INZ000171337; DP: NSDL/CDSL-IN-DP-365-2018; PMS: INP000005786;
Mutual Fund: ARN 20669; Research Analyst: INH000006183;
Disclaimer: Client should read the Risk Disclosure Document issued by SEBI & relevant exchanges and the T&C on www.sharekhan.com;
Investment in securities market are subject to market risks, read all the related documents carefully before investing.You can also read