Clare Valley Wine Region - SA Winegrape Crush Survey 2020 Regional Summary Report - Vinehealth Australia
←
→
Page content transcription
If your browser does not render page correctly, please read the page content below
SA Winegrape Crush
Survey 2020
Regional Summary
Report

Clare Valley Wine
Region

Wine Australia July 2020
Clare Valley
Vintage overview
VINTAGE REPORT OVERVIEW OF VINTAGE STATISTICS
Below-average winter rainfall led to low soil-moisture reserves at the start The reported crush of Clare Valley winegrapes was 11,946 tonnes in
of the growing season in September and many vineyards applied 2020, down by 23 per cent from the 2019 reported crush of 15,583
irrigation during winter and spring to set up the vines for the forecast dry tonnes. It was the lowest recorded crush for the region since the survey
season. Dry conditions continued during spring, with the three months started in 1996. Over the past five years (up to 2019), the average crush
recording lower than average rainfall, and large volumes of irrigation for the Clare Valley has been 20,926 tonnes, making this year’s crush 43
water were used throughout the district to meet the plants’ requirements. per cent below the five-year average.
Maximum temperatures were also higher than average during spring There were 42 respondents to the survey who reported crushing grapes
which increased the vines’ demand for water. A 40°C day on 20 from the Clare Valley in 2020, compared with 41 in 2019.
November impacted on the fruit set of several varieties and was one of
The total estimated value of winegrapes in 2020 was just over $19 million
the factors that led to an extremely low-yielding harvest. Careful
compared with $22 million in 2019. The lower production was partly offset
management of grapevine water and nutrient requirements was
by an overall increase in the average purchase value of grapes, which
imperative this season to retain vine canopies and maximise yield.
increased by 14 per cent from $1373 in 2019 to $1562 per tonne.
Riesling was the star performer in terms of yield this season with yields
There were increases in average prices for the three largest varieties:
down on average by only 15-30 per cent. Red varieties, including Shiraz
Riesling up by 22 per cent to $1406 per tonne, Shiraz up 8 per cent to
and Cabernet Sauvignon, recorded lower yields, down on average by 40-
$1976 per tonne and Cabernet Sauvignon up by 16 per cent to $1747 per
80 per cent, challenging the profitability of some enterprises.
tonne.
Milder temperatures in the New Year, particularly in February, were a
The price dispersion data for red varieties shows a big upward shift in
welcome relief and provided ideal ripening conditions for flavour
prices paid, with 71 per cent of reds being purchased at $1500 per tonne
development and steady rates of sugar accumulation.
and above, compared with 51 per cent in 2019. For white varieties, 41 per
Good vine health and retaining the canopy had a huge bearing on results cent of tonnes were sold at $1500 or above, compared with just 5 per cent
and growers who achieved this produced excellent quality fruit this year. in 2019.
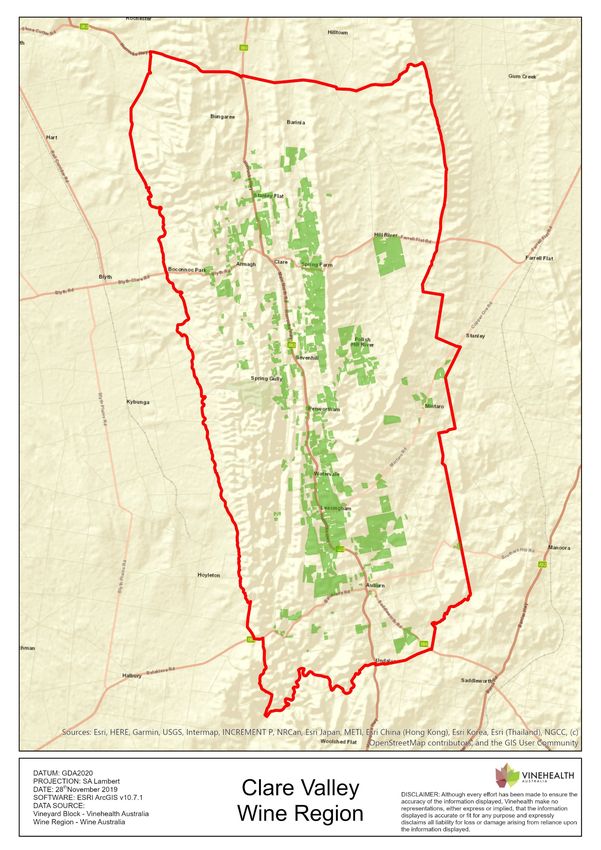
Vintage flowed well, with most of the fruit harvested by the end of March. According to Vinehealth Australia data, the total vineyard area in the Clare
Valley as at 30 April 2020 is 5050 hectares, a net increase of 34 hectares
Record rainfall for the month of April has led to an early break and heralds
compared with 2019, but about 200 hectares less than it was 5 years ago.
a good season ahead for 2020-2021.
There were 56 hectares of new vines planted in the region in the 2019-20
Lucy O’Brien - General Manager
season (including top-working and replacements), with one-third being
Clare Valley Wine & Grape Association
Cabernet Sauvignon and one-third Shiraz.
SA Winegrape Crush Survey 2020 2 Wine Australia July 2020Clare Valley
Winegrape intake summary table
Price dispersion - number of tonnes in each price range
Total tonnes total value Average Change in Winery Share of Total Est total value
purchased $300 to $600 to $1500 to purchased purch. value price YoY grown fruit winery crushed ALL grapes
< $300 $2000+Clare Valley
Historical weighted average price vs tonnes crushed
Average price
$ per tonne Tonnes crushed
Shiraz Cabernet Sauvignon
2500 40,000
Riesling Tonnes crushed (RH axis)
35,000
2000
30,000
25,000
1500
20,000
1000
15,000
10,000
500
5,000
0 0
2005 2006 2007 2008 2009 2010 2011 2012 2013 2014 2015 2016 2017 2018 2019 2020
SA Winegrape Crush Survey 2020 4 Wine Australia July 2020Clare Valley
Current plantings by variety and year planted
%
planted
Variety Pre-2017 2017 2018 2019 Total area in 2019
Red winegrapes
Cabernet Franc 16 0 0 2 18 11%
Cabernet Sauvignon 1,096 11 11 18 1,136 2%
Grenache 64 2 0 0 66 0%
Malbec 79 3 1 0 83 0%
Mataro (Mourvedre) 33 1 0 0 34 0%
Merlot 248 0 0 6 254 2%
Nebbiolo 3 0 0 0 3 0%
Sangiovese 25 0 0 0 25 0%
Shiraz 1,837 22 26 18 1,903 1%
Tempranillo 37 0 0 0 37 0%
Other Red 43 2 3 0 48 0%
Total red varieties 3,481 41 41 44 3,607 1%
White winegrapes
Chardonnay 142 0 0 0 142 0%
Pinot Gris 57 0 1 6 64 9%
Riesling 1,035 12 0 6 1,053 1%
Sauvignon Blanc 14 0 0 0 14 0%
Semillon 79 0 0 0 79 0%
Traminer (Gewurztraminer) 23 0 0 0 23 0%
Viognier 10 0 0 0 10 0%
Other White 37 2 1 0 40 0%
Total white varieties 1,397 14 2 12 1,425 1%
Unknown variety 17 0 0 0 17 0% Source:
Rootstock Block 1 0 0 0 1 0% Vinehealth
Total all varieties 4,896 55 43 56 5,050 1% Australia
SA Winegrape Crush Survey 2020 5 Wine Australia July 2020Explanations and definitions
INTAKE (CURRENT VINTAGE) DATA The calculated average purchase value per tonne is the average amount paid per
tonne of fruit across all wineries.
Definition of regions
Winery grown grapes are not included in the calculation of average purchase
Regions have been defined in accordance with Geographical Indication (GI)
value; nor are grapes grown by companies connected with the winery or under
boundaries. If a GI region has not been declared, or produces less than 5,000
lease arrangements.
tonnes, then the data is aggregated into the relevant GI zone. Disaggregation of
data into smaller regions such as Southern Fleurieu and Mount Benson is Average and total purchase values are not reported where there are fewer than
available on request from Wine Australia. three purchasers of a variety in a particular region. However the values are
included in the calculation of totals for each region.
Total crush
Important note on average purchase value
The total crushed is the total tonnes of grapes crushed from a particular source
region, whether processed in that region, another region in SA or interstate. All There is considerable variation in the pricing arrangements made by different
wineries in Australia are included in the survey collection process. However, not wineries. For example, some wineries make adjustment payments based on the
all wineries respond to the survey - therefore the total tonnage reported may average value per tonne reported in this survey and some pay quality bonuses
underestimate the true crush. It is estimated that the overall response rate for the based on the end use of the product. These additional payments are not included
survey is 88 per cent; however, individual regions may vary. Generally, regions in the reported figures. The average price also does not give any indication of the
will have a higher response rate when there is a high proportion of purchased distribution of prices, or variables that go into individual contracts.
winegrapes within the region.
Price dispersion data (shaded columns in Intake Summary tables)
Reported fruit is separated into fruit produced from the winery’s own or
All purchases for each variety are grouped into price segments according to the
associated vineyards (“own grown”) and from independent vineyards
price paid for that batch of fruit. The sum of tonnes in all the price segments may
(“purchased”).
not match the total tonnes purchased where there are tonnes reported without an
Calculated average purchase value associated price.
The survey requests wineries to provide the total amount paid for each parcel of Estimated total value of all grapes
fruit purchased (or the price per tonne). This is the price paid for fruit of a
The estimated total value of all grapes is calculated by multiplying the average
particular variety at the point of receival – not including specific amounts paid for
purchase value per tonne by all tonnes crushed. If there is a variety where there
freight. It includes any penalties or bonuses (eg Baumé) applied at the
are no purchases, then the average purchase value for the same variety across
weighbridge, but DOES NOT INCLUDE other bonuses or adjustments such as
similar regions, or across all other varieties of the same colour in the same region
end use quality bonuses, which are not available at the time the survey is
is used to determine an estimated value for the own grown grapes.
conducted (May-June 2020).
SA Winegrape Crush Survey 2020 6 Wine Australia July 2020Explanations and definitions - continued
PLANTING DATA
Source of planting data tables • Planting data tables are current as at 30 April 2020 and include all plantings
from the 2019–20 planting season.
Planting data is not collected by the Australian National Vintage Survey. The • Reference to “other varieties” includes rootstock, multi-purpose and table-
information is obtained from the vineyard register maintained by Vinehealth grape plantings.
Australia. • Vines planted in a particular year may include top-worked or replaced vines,
Vinehealth Australia is required under the Phylloxera and Grape Industry Act as well as new plantings in virgin ground. Where vines have been replaced or
1995 to maintain a complete and accurate register of vineyard owners in the topworked, the old variety record is removed. This explains why the area
state. Vineyard owners with plantings of 0.5 hectares or more are required to planted for earlier years may be different in the current report compared with
register with Vinehealth Australia, and provide details of any changes made to previous reports.
these vineyard plantings within three months of any such change. This • Where a zero (0) appears in a table, this may indicate the presence of a
information is kept strictly confidential and provided for this survey in a planting of less than 0.5 hectares, or it may indicate zero plantings. Rounding
deidentified and aggregated manner. may produce slight discrepancies in totals.
For more information on the planting data in this report or about registration of
vineyards, please contact the Vinehealth Australia office on (08) 8273 0550.
Explanatory notes for planting data tables
To protect confidentiality, the following rules are applied to reporting varieties:
• where there are fewer than 10 registered owners with plantings of a
particular variety across the state, that variety is not separately identified in
either the state or the regional reports but is grouped with “other
red/white”, AND
• where there are fewer than three registered owners with a particular grape
variety in a given region, that variety is not separately identified in the
regional report but is grouped with “other red/white” unless it is a white
variety listed in the top seven, or red variety in the top five by planted area
for the state for the current year.
.
SA Winegrape Crush Survey 2020 7 Wine Australia July 2020Acknowledgements
AUSTRALIAN NATIONAL VINTAGE SURVEY
Wine Australia is an Australian Commonwealth Government statutory authority,
The information for this report has been collected and analysed by Wine Australia as established under the Wine Australia Act 2013, and funded by grape growers and
part of the Australian National Vintage Survey. The SA Winegrape Crush Survey winemakers through levies and user-pays charges and the Australian Government,
Report has been prepared by Wine Australia on behalf of the South Australian Wine which provides matching funding for RDA investments and funds the ERWSP.
Industry Association, Wine Grape Growers South Australia and Primary Industries
and Regions SA.
Disclaimer
The survey publication is available on Wine Australia’s website wineaustralia.com, the
Vinehealth Australia website vinehealth.com.au and via links from the Wine Grape This information has been made available to assist on the understanding that Wine
Council SA website wgcsa.com.au and the South Australian Wine Industry Australia is not rendering professional advice. Wine Australia does not accept
Association website www.winesa.asn.au. responsibility for the results of any actions taken on the basis of the information
contained in this report, nor for the accuracy, currency or completeness of any material
Credits contained in it. Wine Australia expressly disclaims all and any liability and responsibility
Images – Wine Australia to any person in respect of consequences of anything done in respect of reliance,
GI maps – Vinehealth Australia whether wholly or in part, upon this report.
Note: data published in this report supercedes that in earlier reports. Minor variations in
reported figures can occur due to data revisions.
About Wine Australia
Any questions about the report should be directed to:
Wine Australia supports a competitive wine sector by investing in research,
Wine Australia Market Insights
development and adoption (RDA), growing domestic and international markets,
+61 8 8228 2000
protecting the reputation of Australian wine and administering the Export and Regional
Market.Insights@wineaustralia.com
Wine Support Package (ERWSP).
SA Winegrape Crush Survey 2020 8 Wine Australia July 2020You can also read