Clare Valley Wine Region - SA Winegrape Crush Survey 2019 Regional Summary Report - Vinehealth Australia
←
→
Page content transcription
If your browser does not render page correctly, please read the page content below
SA Winegrape Crush
Survey 2019
Regional Summary
Report

Clare Valley Wine
Region

Wine Australia July 2019
Clare Valley
                                                                Vintage overview

VINTAGE REPORT                                                                    OVERVIEW OF VINTAGE STATISTICS
Clare Valley vineyards have shown resilience through drought conditions           A total of 15,573 tonnes of Clare Valley winegrapes was crushed in 2019,
with Vintage 2019 producing lower yields of high quality fruit.                   down 33 per cent on the 2018 crush of 23,198. Over the past five years
                                                                                  (up to 2018), the average crush for Clare has been 21,509 tonnes,
Lower winter and spring rainfall produced smaller canopies and berries in
                                                                                  making this year’s crush 28 per cent below the five-year average and the
many vineyards which have enhanced quality across Shiraz, Riesling and
                                                                                  lowest since 2000.
the later-ripening Cabernet Sauvignon. These three varieties account for
more than 80 per cent of the Clare Valley’s winegrape production.                 There were 40 respondents to the survey who reported crushing grapes
                                                                                  from Clare Valley in 2019, compared with 36 in 2018.
The season kicked off with some localised frost events in September and
October, which led to yield losses in several vineyards across the region.        The total value of winegrapes in 2018 decreased by $5 million to $22
Localised hail also caused some losses in Stanley Flat and Hill River and         million as a result of the lower production, although this was partly offset
further south in a narrow band through Watervale and Leasingham.                  by an overall increase of 19 per cent in the average purchase value of
                                                                                  grapes.
Local estimates are that yield reductions in the region were limited to 30-
40 per cent in healthy vineyards with well-managed irrigation systems.            There were increases in average prices for all the major varieties. The
However, some dry-grown vineyard blocks had greater yield reductions.             average for Shiraz increased by 27 per cent to a record $1832 per tonne
                                                                                  and Cabernet Sauvignon increased by 39 per cent to $1510 per tonne
There were some extreme weather conditions during the growing season,
                                                                                  (the highest since 2003). The region’s largest variety, Riesling, increased
including the lowest temperature recorded in spring and the highest ever
                                                                                  by 9 per cent to $1151 per tonne while Chardonnay increased by 30 per
temperature in summer, but the grapes showed great resilience. Whites
                                                                                  cent to $918 per tonne (both the highest since 2008) .
have retained good acidity while the reds were sun-blessed and are
showing great colour and varietal intensity.                                      The price dispersion data shows that 51 per cent of red grapes were sold
                                                                                  at above $1500 per tonne, compared with 13 per cent in 2018. For
Riesling has been the star performer in terms of yield, with crops coming
                                                                                  whites, 94 per cent of the purchased fruit was purchased at between $600
in at only 10-15 per cent down on expectations, demonstrating what an
                                                                                  and $1500 per tonne – a relatively narrow dispersion range.
incredibly resilient variety Riesling is under our conditions.
                                                                                  There were 32 hectares of new vines planted in the region in the 2018
Low yields prompted a brief harvest. Good yields and quality have been
                                                                                  season. Almost all the new plantings were red varieties with Shiraz the
reported in red varieties such as Sangiovese, Grenache, Merlot and
                                                                                  largest (18 hectares).
Mourvedre, with some outstanding colours showing early. Shiraz and
Cabernet yields were more affected, but quality is looking strong.                The total vineyard area in Clare as at 30 April 2019 is 5,016 hectares – a
                                                                                  small net reduction since 2018 (5,060 hectares) and 350 hectares below
Tania Matz, Clare Valley Wine & Grape Association
                                                                                  the total area five years ago.

 SA Winegrape Crush Survey 2019                                               2                                                   Wine Australia July 2019
Clare Valley
Winegrape intake summary table
Price dispersion - number of tonnes in each price range
Total tonnes total value Average Change in Winery Share of Total Est total value
$300 to $600 to $1500 to
purchased < $300 $2000+ purchased purch. value price YoY grown fruit winery crushed ALL grapesClare Valley
Historical weighted average price vs tonnes crushed
Average price
Tonnes crushed
$ per tonne
2000 40,000
Shiraz Cabernet Sauvignon
1800 Riesling Tonnes crushed (RH axis)
35,000
1600
30,000
1400
25,000
1200
1000 20,000
800
15,000
600
10,000
400
5,000
200
0 0
2005 2006 2007 2008 2009 2010 2011 2012 2013 2014 2015 2016 2017 2018 2019
SA Winegrape Crush Survey 2019 4 Wine Australia July 2019Clare Valley
Current plantings by variety and year planted
Year planted
Total % planted
Variety Pre-2016 2016 2017 2018 area (ha) in 2018
Red winegrapes
Cabernet Franc 15 0 0 0 15 0%
Cabernet Sauvignon 1,096 1 9 9 1115 1%
Grenache 62 4 0 0 66 0%
Malbec 79 2 3 1 85 1%
Mataro (Mourvedre) 32 1 1 0 34 0%
Merlot 264 0 0 0 264 0%
Sangiovese 25 0 0 0 25 0%
Shiraz 1,829 13 17 18 1877 1%
Tempranillo 33 4 0 0 37 0%
Other Red 36 1 2 3 42 7%
RED WINEGRAPES 3,471 26 32 31 3,560 1%
White winegrapes
Chardonnay 147 0 0 0 147 0%
Pinot Gris 53 2 0 0 55 0%
Riesling 991 48 12 0 1051 0%
Sauvignon Blanc 14 0 0 0 14 0%
Semillon 106 0 0 0 106 0%
Traminer (Gewurztraminer) 15 0 0 0 15 0%
Viognier 11 0 0 0 11 0%
Other White 37 1 2 1 41 3%
WHITE WINEGRAPES 1,374 51 14 1 1,440 0%
Unknown variety 15 0 0 0 15 0%
Source:
Rootstock Block 1 0 0 0 1 0%
Vinehealth
TOTAL ALL VARIETIES 4,861 77 46 32 5,016 1% Australia
SA Winegrape Crush Survey 2019 5 Wine Australia July 2019Explanations and definitions
AUSTRALIAN NATIONAL VINTAGE SURVEY
The information for this report has been collected and analysed by Wine Australia
as part of the Australian National Vintage Survey. The SA Winegrape Crush
Survey Report has been prepared by Wine Australia on behalf of the South
Australian Wine Industry Association, Wine Grape Growers South Australia and
Primary Industries and Regions SA.
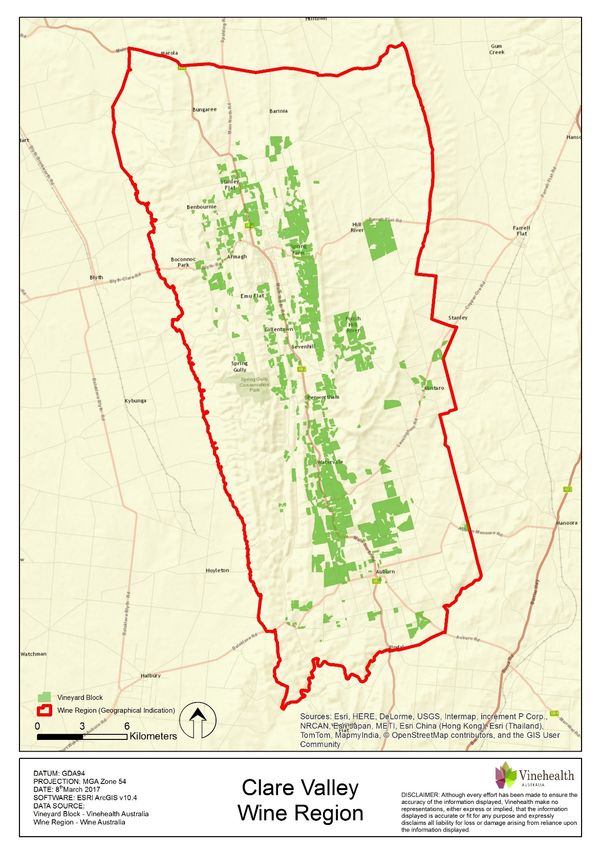
Maps and planting data tables are provided by Vinehealth Australia (see notes on
planting data tables).
The survey publication is available on Wine Australia’s website
wineaustralia.com, the Vinehealth Australia website vinehealth.com.au and via
links from the Wine Grape Council SA website wgcsa.com.au and the South
Australian Wine Industry Association website winesa.com.au
Photo credits
Cover image: Wine Australia
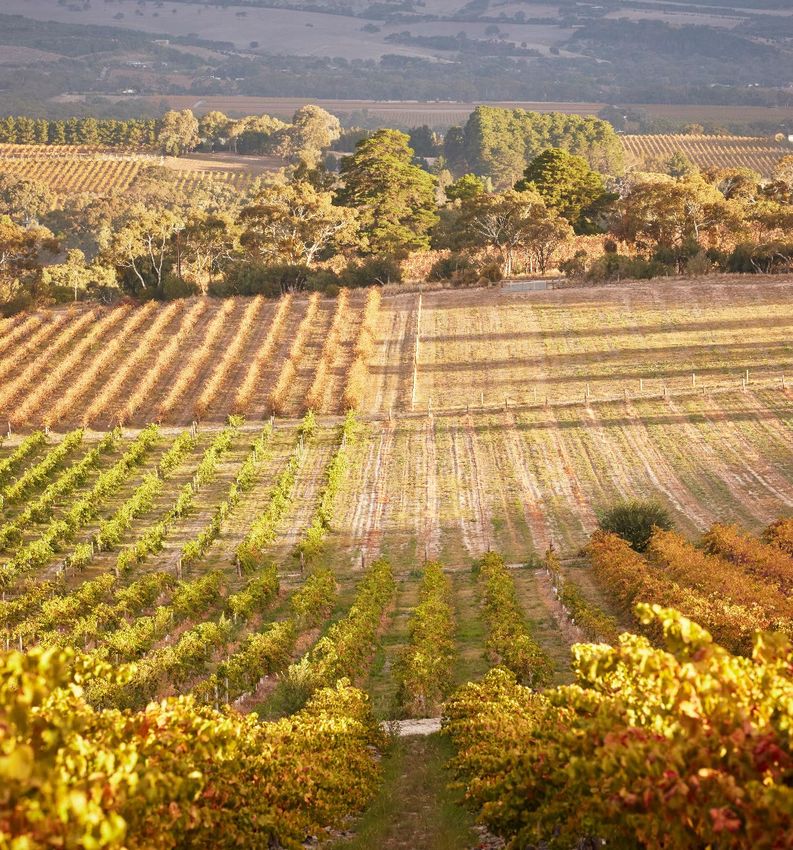
Current page: Ewen Bell / Wine Australia
Disclaimer
This information has been made available to assist on the understanding that
Wine Australia is not rendering professional advice. Wine Australia does not
accept responsibility for the results of any actions taken on the basis of the
information contained in this report, nor for the accuracy, currency or
completeness of any material contained in it. Wine Australia expressly disclaims
all and any liability and responsibility to any person in respect of consequences of
anything done in respect of reliance, whether wholly or in part, upon this report.
Note: data published in this report supercedes that in earlier reports. Minor
variations in reported figures can occur due to data revisions.
Any questions about the report should be directed to:
Wine Australia Market Insights
+618 8228 2000
Market.insights@wineaustralia.com
SA Winegrape Crush Survey 2019 6 Wine Australia July 2019Explanations and definitions - continued
INTAKE (CURRENT VINTAGE) DATA The calculated average purchase value per tonne is the average amount paid per
tonne of fruit across all wineries.
Definition of regions
Winery grown grapes are not included in the calculation of average purchase
Regions have been defined in accordance with Geographical Indication (GI)
value; nor are grapes grown by companies connected with the winery or under
boundaries. If a GI region has not been declared, or produces less than 5,000
lease arrangements.
tonnes, then the data is aggregated into the relevant GI zone. Disaggregation of
data into smaller regions such as Southern Fleurieu and Mount Benson is Average and total purchase values are not reported where there are fewer than
available on request from Wine Australia. three purchasers of a variety in a particular region. However the values are
included in the calculation of totals for each region.
Total crush
Important note on average purchase value
The total crushed is the total tonnes of grapes crushed from a particular source
region, whether processed in that region, another region in SA or interstate. All There is considerable variation in the pricing arrangements made by different
wineries in Australia are included in the survey collection process. However, not wineries. For example, some wineries make adjustment payments based on the
all wineries respond to the survey - therefore the total tonnage reported may average value per tonne reported in this survey and some pay quality bonuses
underestimate the true crush. It is estimated that the overall response rate for the based on the end use of the product. These additional payments are not included
survey is 88 per cent; however, individual regions may vary. Generally, regions in the reported figures. The average price also does not give any indication of the
will have a higher response rate when there is a high proportion of purchased distribution of prices, or variables that go into individual contracts.
winegrapes within the region.
Price dispersion data (shaded columns in Intake Summary tables)
Reported fruit is separated into fruit produced from the winery’s own or
All purchases for each variety are grouped into price segments according to the
associated vineyards (“own grown”) and from independent vineyards
price paid for that batch of fruit. The sum of tonnes in all the price segments may
(“purchased”).
not match the total tonnes purchased where there are tonnes reported without an
Calculated average purchase value associated price.
The survey requests wineries to provide the total amount paid for each parcel of Estimated total value of all grapes
fruit purchased (or the price per tonne). This is the price paid for fruit of a
The estimated total value of all grapes is calculated by multiplying the average
particular variety at the point of receival – NOT including freight. It includes any
purchase value per tonne by all tonnes crushed. If there is a variety where there
penalties or bonuses (eg Baumé) applied at the weighbridge, but DOES NOT
are no purchases, then the average purchase value for the same variety across
INCLUDE other bonuses or adjustments such as end use quality bonuses, which
similar regions, or across all other varieties of the same colour in the same region
are not available at the time the survey is conducted (May-June 2019).
is used to determine an estimated value for the own grown grapes.
SA Winegrape Crush Survey 2019 7 Wine Australia July 2019Explanations and definitions - continued
PLANTING DATA
Source of planting data tables • Planting data tables are current as at 30 April 2019 and include all plantings
from the 2018-19 planting season.
Planting data is not collected by the Australian National Vintage Survey. The • Reference to “other varieties” includes rootstock, multi-purpose and table-
information is obtained from the vineyard register maintained by Vinehealth grape plantings.
Australia. • Vines planted in a particular year may include top-worked or replaced vines,
Vinehealth Australia is required under the Phylloxera and Grape Industry Act as well as new plantings in virgin ground. Where vines have been replaced or
1995 to maintain a complete and accurate register of vineyard owners in the topworked, the old variety record is removed. This explains why the area
state. Vineyard owners with plantings of 0.5 hectares or more are required to planted for earlier years may be different in the current report compared with
register with Vinehealth Australia, and provide details of any changes made to previous reports.
these vineyard plantings within three months of any such change. This • Where a zero (0) appears in a table, this may indicate the presence of a
information is kept strictly confidential and provided for this survey in a planting of less than 0.5 hectares, or it may indicate zero plantings. Rounding
deidentified and aggregated manner. may produce slight discrepancies in totals.
Explanatory notes for planting data tables For more information on the planting data in this report or about registration of
vineyards, please contact the Vinehealth Australia office on (08) 8273 0550.
Regions are defined according to the Register of Australian Geographical
Indications.
To protect confidentiality, the following rules are applied to reporting varieties:
• where there are fewer than 10 registered owners with plantings of a
particular variety across the state, that variety is not separately identified in
either the state or the regional reports but is grouped with “other
red/white”, AND
• where there are fewer than three registered owners with a particular grape
variety in a given region, that variety is not separately identified in the
regional report but is grouped with “other red/white” unless it is a white
variety listed in the top six, or red variety in the top five by planted area for
the state for the current year.
.
SA Winegrape Crush Survey 2019 8 Wine Australia July 2019You can also read