LAV@HAZARD: a satellite-driven modeling strategy for quantifying lava flow hazards
←
→
Page content transcription
If your browser does not render page correctly, please read the page content below

LAV@HAZARD: a satellite-driven modeling
strategy for quantifying lava flow hazards
Ciro Del Negro, Eleonora Amato, Giuseppe Bilotta, Sonia Calvari, Annalisa Cappello,
Claudia Corradino, Gaetana Ganci, Alexis Herault, Federica Torrisi
INGV – CT, Laboratory of Technologies for Volcanology (TechnoLab)
SOTTOTITOLO
 Thematic area: Earth Observation
 VOLCANIC HAZARD MONITORING FROM SPACE
                                    Mount Etna Eruption on
                                     Christmas Eve 2018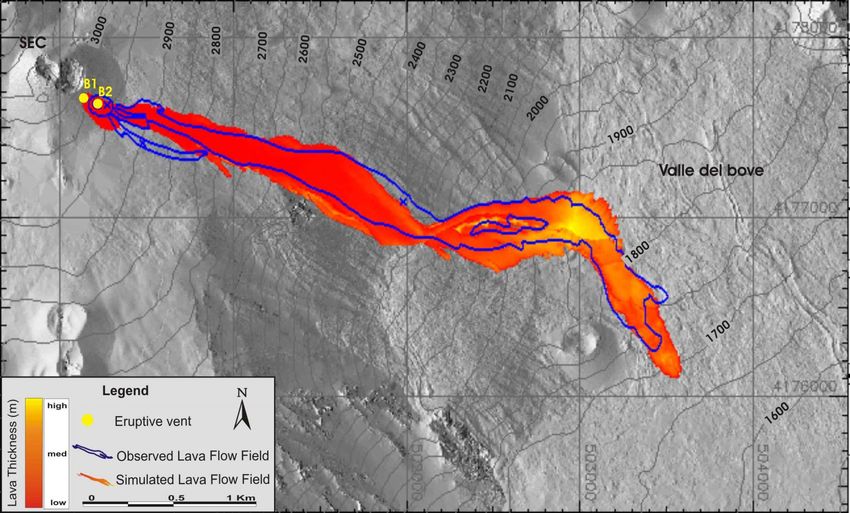
• SCIENTIFIC RATIONALE

             Hazard response chain
             Quantifying lava flow hazards by combining field observations,
             satellite data and numerical modeling has immediate
             applications to the real time monitoring of effusive eruptions.
             By monitoring, we mean here both following the manifestations
             of the eruption once it has started, as well as forecasting the
             areas potentially threatened by lava in an effusive scenario.
             Our strategy, based essentially on the combination of the
             HOTSAT system with the MAGFLOW model, now represents
             the first operational monitoring system that allows us to give
             during an eruption:
             (i) the current state of the effusive activity
             (ii) the probable evolution of the lava flow field
             (iii) the potential impact of lava flows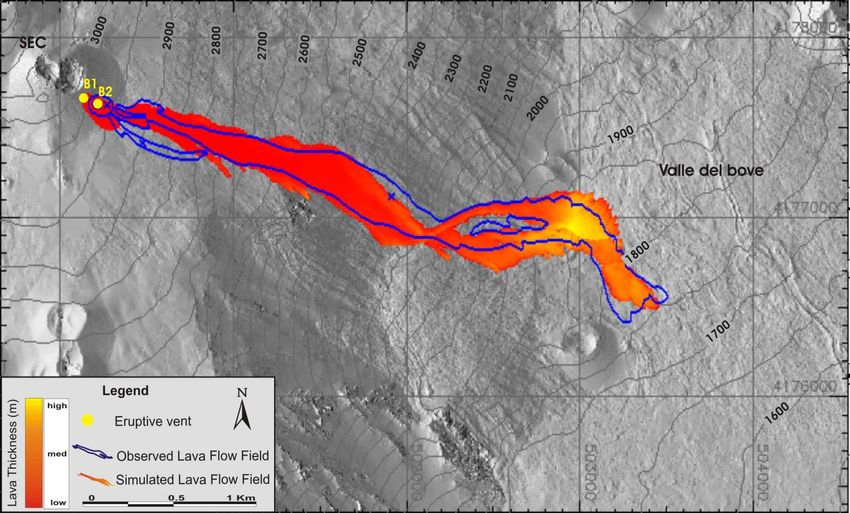
• OBSERVATIONAL INFRASTRUCTURE
Satellite-driven modeling strategy
The TechnoLab of the INGV-CT has developed a satellite-driven modeling strategy for quantifying
lava flow hazards during an ongoing eruption. This strategy involves three main steps:
(i) hotspot detection
(ii) effusion rate estimation
(iii) lava flow forecasting                                        For these tasks, we use two tools:
                                                                   - the HOTSAT system for hot-spot
                                                                   detection that works with satellite
                                                                   thermal infrared data and

                                                                   - the MAGFLOW model for lava
                                                                   flow simulations that takes into
                                                                   account how the effusion rate
                                                                   changes during eruptions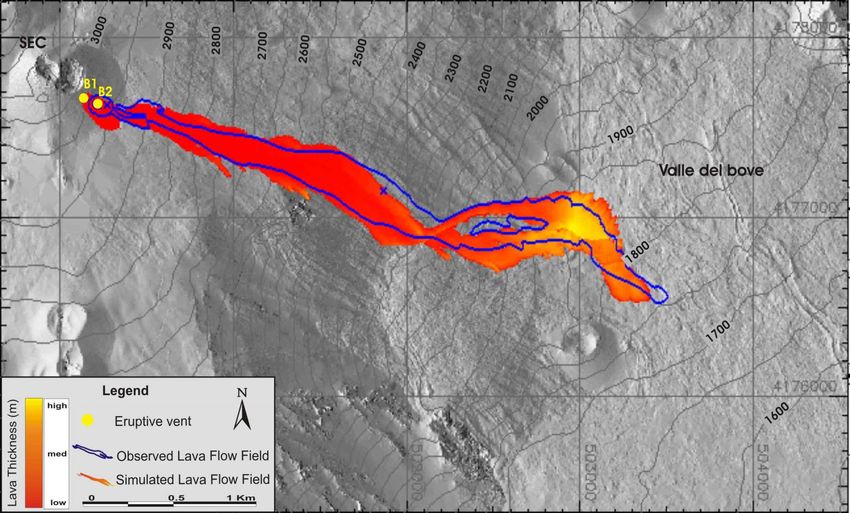
• OBSERVATIONAL INFRASTRUCTURE
MSG-SEVIRI             1. CLOUD INDEX         HOTSAT
Geostationary                                 Satellite data
Orbit                                         processing system
Spatial resolution:
VIS,IR=3 km
Temporal resolution:   2. HOTSPOT DETECTION
15 minutes

           HOTSAT
                       3. RADIANT HEAT FLUX
EOS-MODIS
Polar Orbit
Spatial resolution:
250 m to 1 km
Temporal resolution:
6-12 hours
                       4. TADR ESTIMATION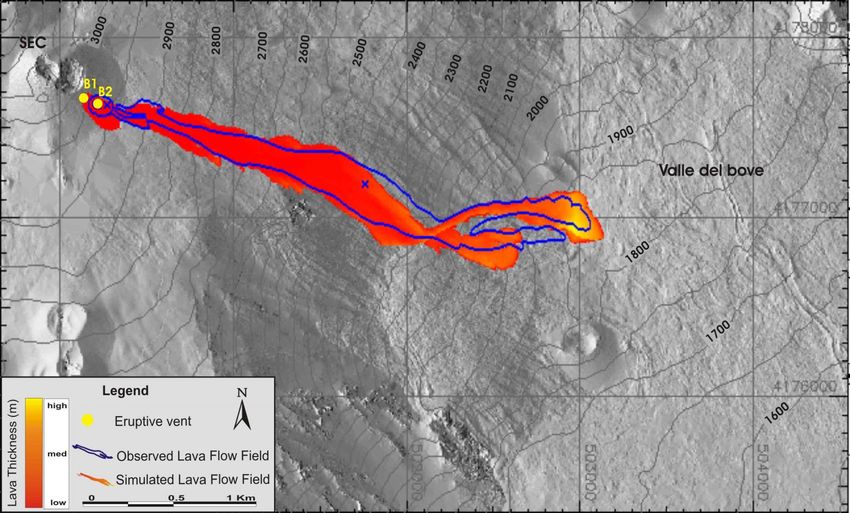
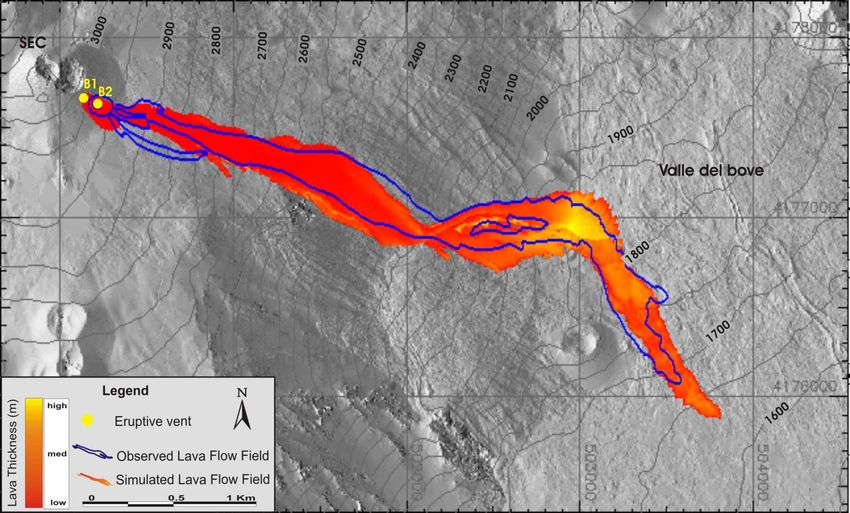
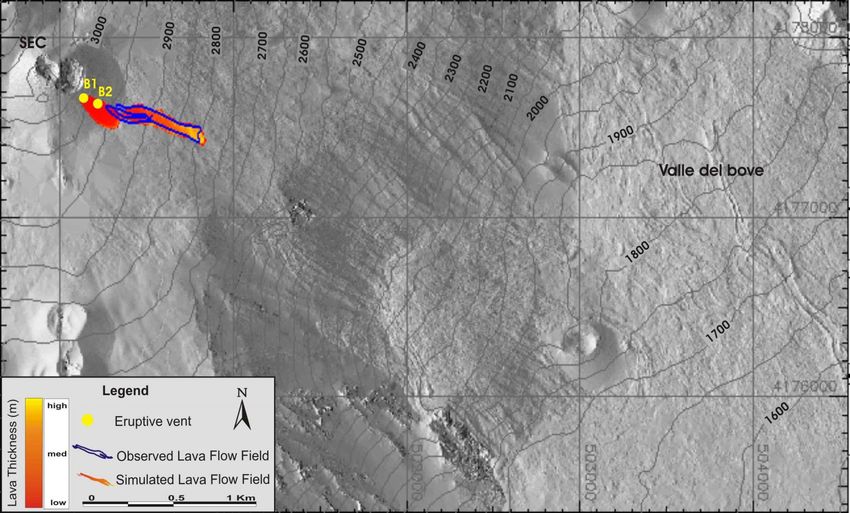
• MAGFLOW MODEL
       2006 Etna eruption: Simulations
       driven by satellite effusion rate

                                           24/07/2006
                                           23/07/2006
                                           22/07/2006
                                           21/07/2006
                                           20/07/2006
                                           15/07/2006
                                           19/07/2006
                                           17/07/2006
                                           16/07/2006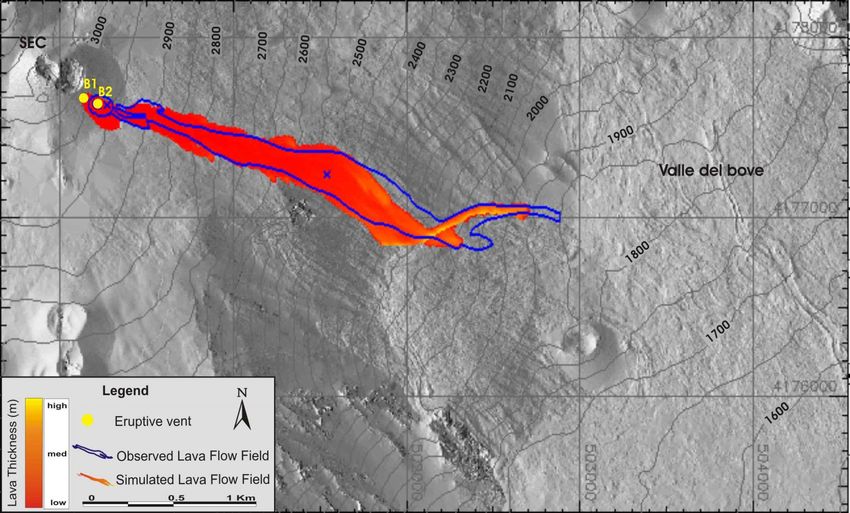
• INFRASTRUCTURE FOR DATA PROCESSING
  Codes implemented on Graphic Processing Units (GPUs)
  GPUs offer very high performances in parallel computing. The
  porting of MAGFLOW and HOTSAT from the original serial
  codes to the parallel computational platforms was
  accomplished using CUDA and OpenCL programming
  languages, providing ways to access the GPU capabilities.

                                 Beignet/    NVIDIA/     Intel/i7-   SPEED-UP – Run times of OpenCL
             Kernel             Haswell GT2 GeForce GT 4712HQ@2.3    implementations of HOTSAT in different
                                  Mobile      750M         GHz       devices (times in ms)

  compute_background_radiance      0.13      0.0569      0.243
     compute_hotspot_data         0.016      0.0133      0.068          BENEFIT Running MAGFLOW on GPUs
                                                                        provides a simulation spanning several
    compute_radiative_power       0.008      0.0091      0.078          days of eruption in a few minutes.
     compute_Tdiff_variance       1.943      0.3647      1.812
                                                                        Event duration     Running time
      compute_thresholds          2.299      0.6513      1.541
                                                                        7 days             2-3 minutes
     find_potential_hotspots      0.007      0.0108      0.065
            prepare               1.301      0.2771      3.376          1 month            10 - 15 minutes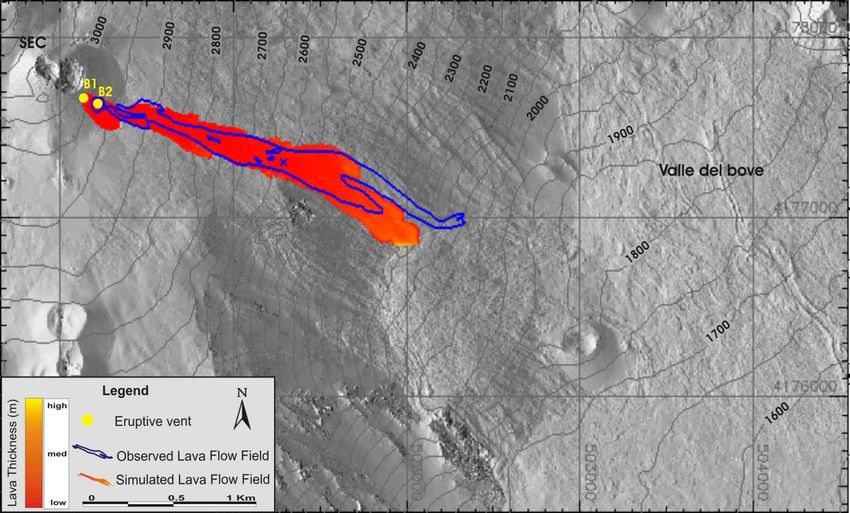
• INFRASTRUCTURE FOR DATA MANAGEMENT
Data storage: 10 TB/year

Data processing: cluster with 12 GPUs
4 x NVIDIA TITAN X
1 x VGA GTX TITAN
4 x NVIDIA GEFORCE GTX 1080Ti
1 x NVIDIA GEFORCE GTX 1050Ti
2 X NVIDIA GEFORCE GT 710

                                        Data processing center (CED)
                                         of the Etnean Observatory.

GPU cluster for AI applications.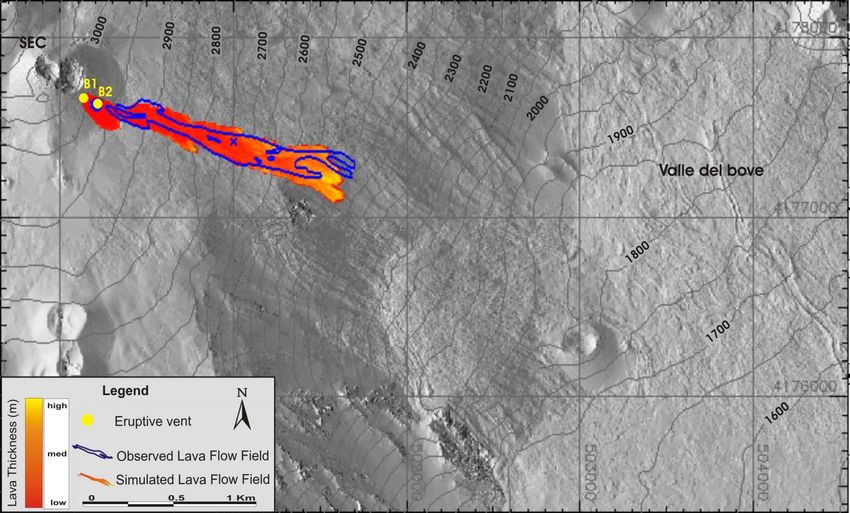
• PRODUCTS AVAILABLE
All products are collected in a WEB-GIS, named Lav@Hazard, based on Google Maps API:
http://ctmgweb.ct.ingv.it

The web structure consists of 4 modules:
1. satellite applications by HOTSAT;
2. hazard map visualization;
3. database of lava flow simulations (about 30.000);
4. real-time scenario forecasting by MAGFLOW
implemented in OpenCL.
5. report on the eruptive activity
• PRODUCTS AVAILABLE
Lav@Hazard: Satellite Module

HOTSAT system in included for hotspot detection   The radiative power is showed and the
by using MODIS and SEVIRI images.                 effusion rate is computed.
• PRODUCTS AVAILABLE
Lav@Hazard: Hazard Module                        Selection of a specific area and visualization of
                                                 the hazard map obtained activating only the
Lava flow hazard map for Etna flank eruptions.   inner grid vents and assigning each of them the
                                                 same activation and event probability.
• PRODUCTS AVAILABLE
Lav@Hazard: Scenario Module Visualization of all vents belonging to the
simulation grid that produce eruptions that can
Historical eruptions simulated by MAGFLOW. invade a specific point, with the eruptive class
associated and the altitude.• PRODUCTS AVAILABLE Lav@Hazard: Forecasting Module This module allows control of the MAGFLOW simulator implemented in OpenCL. In this way the model is able to produce scenario forecast in real-time as required by web applications. The user can select a vent location, some physical and rheological parameters necessary for the model and the expected effusion rates.
• PRODUCTS AVAILABLE
Lav@Hazard: Report Module
• SATELLITE DATA-SOURCES

  Satellite Sensor   Spatial Resolution   Revisit Time            Derived Product
   MSG-SEVIRI              3 km             15 minutes        Radiant Heat Flux, TADR
    EOS-MODIS              1 km                12 h           Radiant Heat Flux, TADR
 Sentinel 3-SLSTR          1 km           3-4 looks a day         Radiant Heat Flux
       VIIRS               375 m          3-4 looks a day         Radiant Heat Flux
  Landsat 8 – OLI        15 - 30 m          7-14 days          Lava flow thermal map
  Sentinel 2 – MSI       10 - 60 m           2-3 days          Lava flow thermal map
      EO-ALI             10 - 30 m         On demand           Lava flow thermal map

    EOS-ASTER            15 - 90 m         On demand        DEM, Lava flow area/thickness

  Pleiades-1A, -1B       0.5 - 2 m         On demand        DEM, Lava flow area/thickness

     Sentinel 1          10 – 40 m           12 days               Lava flow area
• LAVA FLOW HAZARD MONITORING FROM SPACE
Lav@Hazard: hazard modeling driven by satellite-derived parameters
High Spatial Lav@Hazard
1. Digital Elevation Model
Resolution
Optical shows how free
Images in 2. Hotspot Detection access to a
Stereo- PLEIADES
diversity of remote
Lav@Hazard
Tristereo
sensing data over
3. Radiant Heat Flux
volcanoes can
Low Spatial benefit hazards
High Temporal 4. TADR Estimation modeling efforts.
Resolution
Multispectral
Images 5. Active Lava Flow Area
SEVIRI FLOWSAT
Low Temporal
High Spatial SENTINEL 6. Eruptive scenarios
Resolution
Multispectral
Images
MAGFLOW• MACHINE LEARNING
Volcano Hazard Monitoring from
Space using Machine Learning
(ML) Methods
Monitoring of volcanic hazards presents extraordinarily
challenging problems, from detecting and quantifying
hazardous phenomena during eruptive events to
forecasting their impact to assess risks to people and
property. Helping address these problems, however, is
an abundance of satellite data-sets with ever‐improving
Grants for doctoral students temporal, spatial, and spectral resolutions that are
mostly open and publicly available.
2020-2023 This exceptional combination of pressing challenges
- PhD in Engineering, University of Catania and abundant data is leading to the growing use of
- PhD in Mathematics, University of Palermo data-driven approaches, including machine learning
models, to solve problems of volcanic hazards.
2021-2024 Machine learning, a type of AI in which computers learn
- PhD in Computer Science, University of Catania from data, is gaining importance in volcanology, not
only for monitoring purposes (i.e., in real-time) but also
for later hazards analysis (e.g. modelling tools).• PRODUCTS AVAILABLE
Mapping cooled new lava flow field using BNN (1/2)
Non-Supervised
TRAINING INPUT: Bayesian Neural
Classifier 34 training pixels each Network (BNN)
one belonging to one
DEM 2016 of the 34 classes
34 classes identified
for the cool lava field
SENTINEL 2: 27/09/2018
For each MSI image, Band 2
(492.4 nm), Band 3 (559.8 nm),
Band 4 (664.6 nm), and Band 8
SENTINEL 2: 29/12/2018 (832.8 nm) were considered. Spatial resolution: 10 m• PRODUCTS AVAILABLE
Mapping cooled new lava flow field using BNN (2/2)
Area BNN ≈ 810,000 m2
Area PlanetScope ≈
880,000 m2
PlanetScope: 09h19m 29DEC2018 [spatial resolution: 3 m]• PRODUCTS AVAILABLE Machine learning classifiers for detecting and classifying major explosions and paroxysms at Stromboli volcano using radar and optical satellite imagery
• CURRENT DISTRIBUTION OF PRODUCTS

DIPARTIMENTO DI PROTEZIONE CIVILE

@ Sala Operativa dell’Osservatorio Etneo
@ Bollettino settimanale stato attività Etna
@ Bollettino settimanale stato attività Stromboli
@ Comunicati straordinari sullo stato di attività dei vulcani siciliani
• PROGRAMS/PROJECTS OF REFERENCE

# ATHOS research programme (2017-2022)
Total Budget: € 200.000

# Convenzione INGV-DPC Allegato A
Budget: € 7200 in 2020

# Progetto Strategico Dipartimentale FIRST (2020-2023)
Total Budget: € 20.000 => PhD in Computer Science
• TEAM AND AFFILIATIONS
                                                             Laboratory of Technology for Volcanology
                                                             Etna Volcano Observatory – INGV-CT
                                                             • Ciro Del Negro, Research Director, INGV-OE
 Ciro Del Negro       Sonia Calvari      Gaetana Ganci
Research Director   Research Director     Researcher         • Sonia Calvari, Research Director, INGV-OE
                                                             • Gaetana Ganci, Researcher, INGV-OE
                                                             • Annalisa Cappello, Researcher, INGV-OE
                                                             • Giuseppe Bilotta, Researcher, INGV-OE

Annalisa Cappello Giuseppe Bilotta      Claudia Corradino
                                                             • Claudia Corradino, Research Fellow, INGV-OE
   Researcher       Researcher           Research Fellow
                                                             • Eleonora Amato, PhD Student in Mathematics, University of Palermo
                                                             • Federica Torrisi, PhD Student in Engineering, University of Catania
                                                             • Alexis Herault, Associate Researcher, CNAM-Parigi, France

Eleonora Amato       Federica Torrisi    Alexis Hérault
 PhD Student          PhD Student     Associate Researcher
• WORK IN PROGRESS
Volcano Hazard
Modelling
Machine Satellite
Learning Volcano Remote
Techniques Monitoring from Sensing
Space
Google Earth EngineYou can also read