Limits to the Regulation of the Ottawa River - 2019 Spring Flood Overview Ottawa River Regulation Planning Board - Ottawa River Regulation ...
←
→
Page content transcription
If your browser does not render page correctly, please read the page content below
Ottawa River   Commission de planification
   Regulation     de la régularisation
   Planning Board de la rivière des Outaouais

Limits to the Regulation
  of the Ottawa River
  2019 Spring Flood Overview

                      Ottawa River Regulation Secretariat
                                          Michael Sarich
                                         Manon Lalonde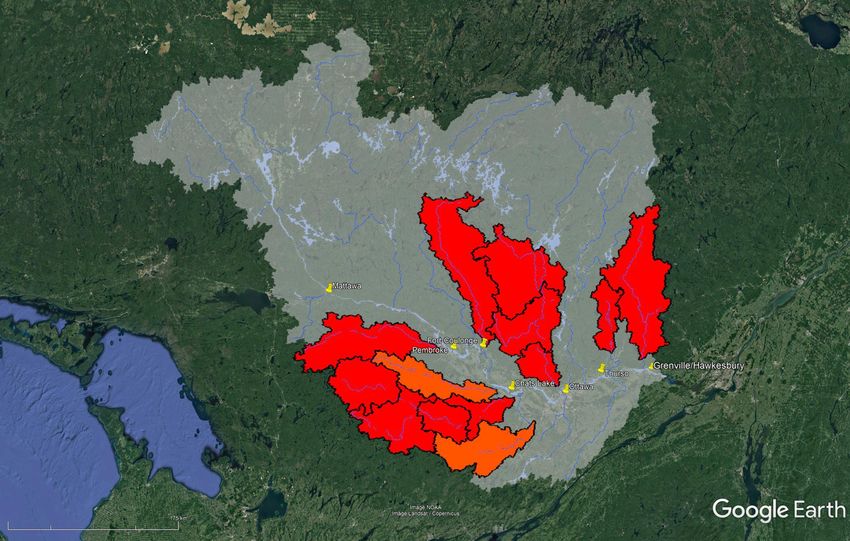
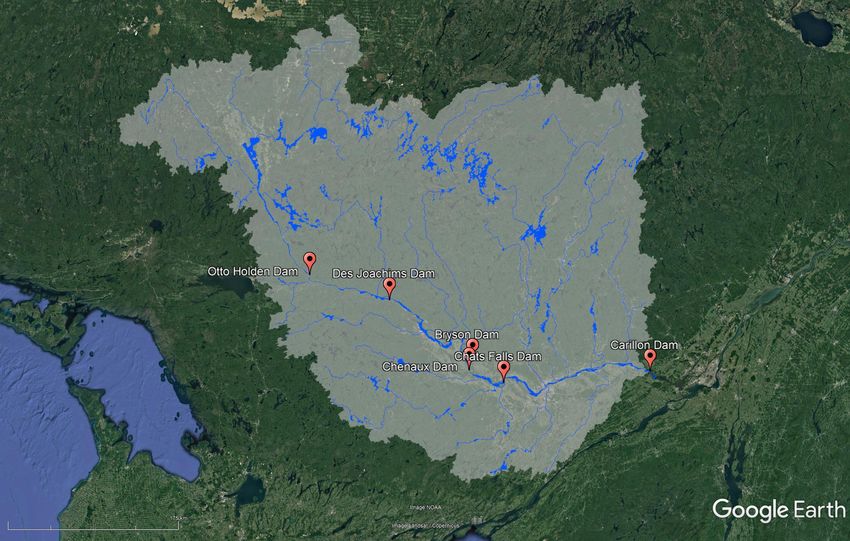
Ottawa River Watershed

                 SPRING FLOODS VARY
                  1950-2018:
                  Maximum daily flow
                  at Carillon dam
                  varied between
                  3,635 and 9,094 m3/s
                  In 2019:
                  Maximum daily flow
                  on April 30th
                  9,217 m3/s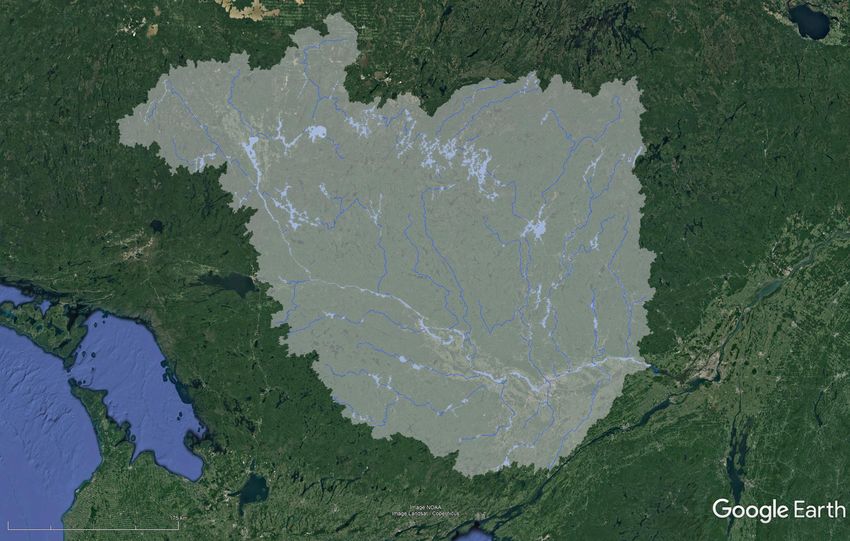
The Water Cycle
Natural Variability
                               2010     2017   2019      PETAWAWA RIVER
                   700
                   650
                   600                                  2019 Peak 46% higher than previous
                   550                                  historic peak of 1985
                   500                                  (Measurements from 1915 to 2019)
DISCHARGE (m³/s)

                   450
                                                        Note: Flows are within the green zone 50% of the time
                   400
                   350
                   300
                   250
                   200
                   150
                   100
                   50
                    0
                         JAN      FEB    MAR   APR    MAY    JUN       JUL      AUG      SEP      OCT      NOV   DEC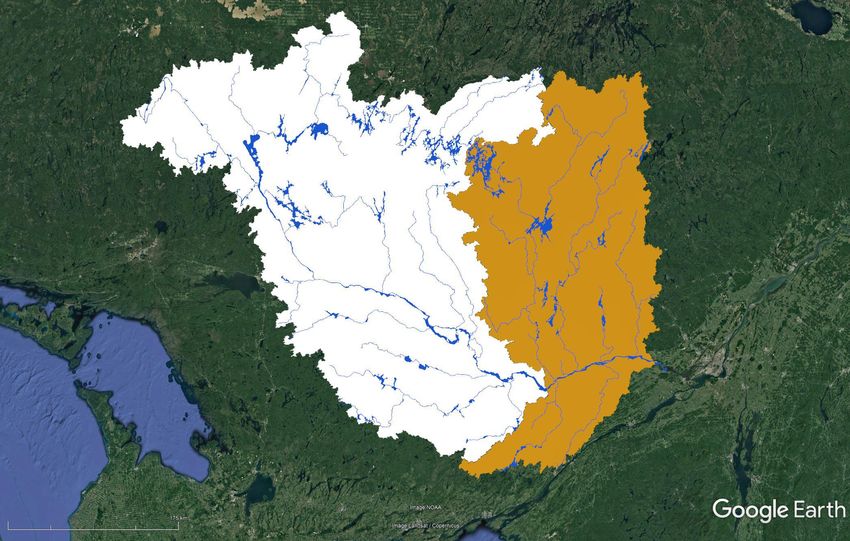
What about Flow Regulation?
13 Large
Reservoirs Reservoirs: large bodies of
water that are used to:
Release water during
winter
Retain water in the spring
Flow regulation
Increase flows during
winter
Reduce flows during
spring
1983 Agreement
Integrated management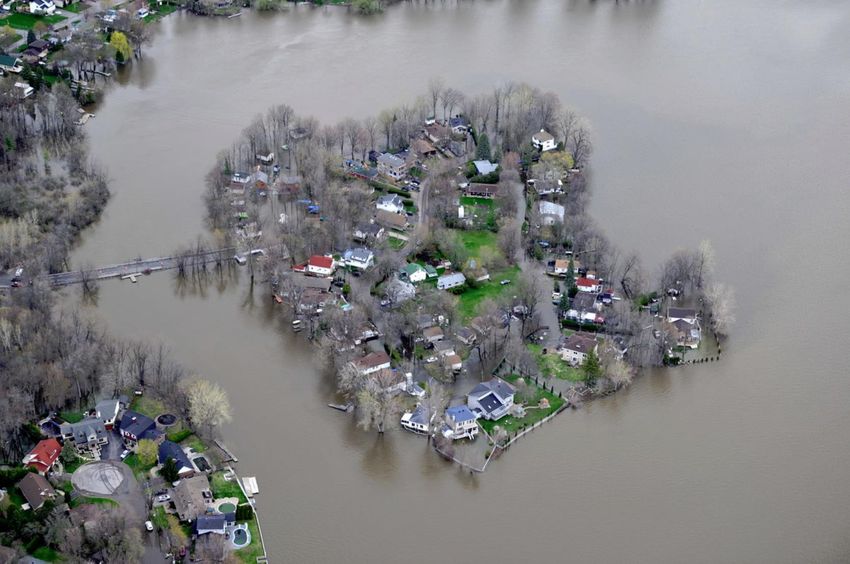
The 1983 Canada-Ontario Quebec Agreement
established:
Ottawa River Regulation Planning Board
Ottawa River Regulating Committee
Ottawa River Regulation Secretariat
Main role : to ensure that the flow from the principal
reservoirs of the Ottawa River Basin are managed on an
integrated basis : minimize impacts – floods & droughts
Secondary role : to ensure hydrological forecasts are
made available to the public and government agencies
for preparation of flood related messages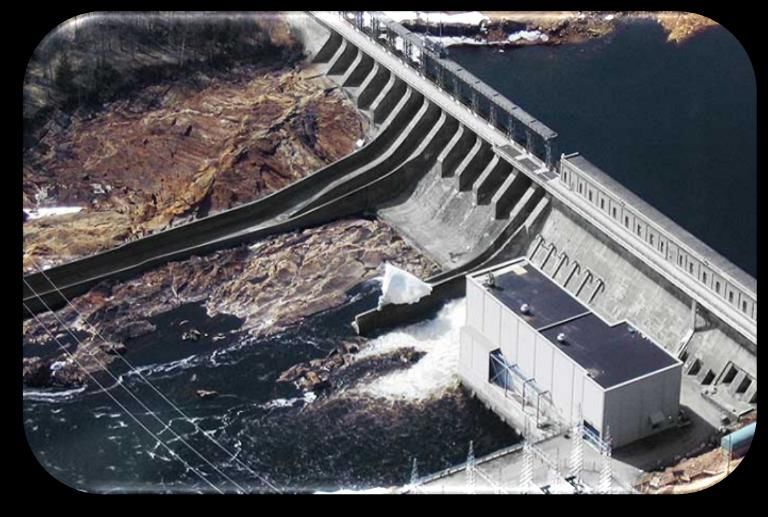
How is the Planning Board
structured?
Ottawa River Regulation Administrative and
general policy
Planning Board function
Ottawa River Ottawa River
Regulating Regulation
Committee* Secretariat
Operational unit Executive unit : supports
* Ontario Ministry of Natural Resources the Regulating Committee
and Forestry is an Associate Member and Planning Board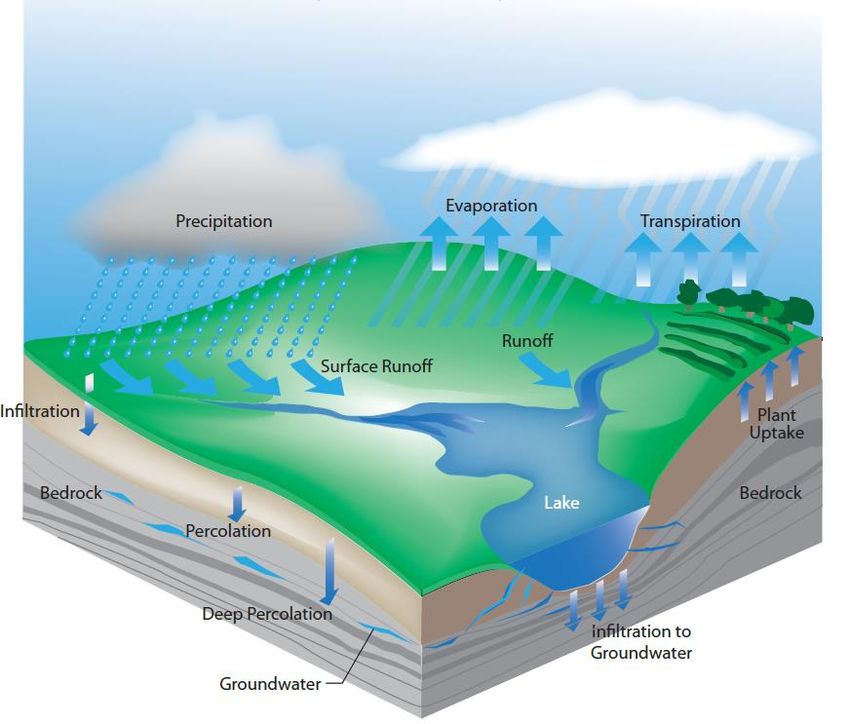
Planning Board Members
    Quebec                Canada              Ontario
                         Public Services   Ministry of Natural
Ministère de             and Procurement   Resources and
l’Environnement, et de   Canada            Forestry
la Lutte contre les
changements              Canadian Coast    Ontario Power
climatiques              Guard             Generation

Hydro-Québec             Environment and
                         Climate Change
                         Canada
Operators of the Principal Reservoirs
Operators of the 13 largest 30 Reservoirs – 13 large
reservoirs under the 1983 43 Hydropower plants
agreement:
3500 MW
Ontario Ministry of Natural
Resources and Forestry is an
Associate Member on the
Regulating Committee
• Contributes
hydrometeorological
information
• Disseminates flood forecast
information in Ontario
Figure credit: Hydro-Québec Carillon Dam
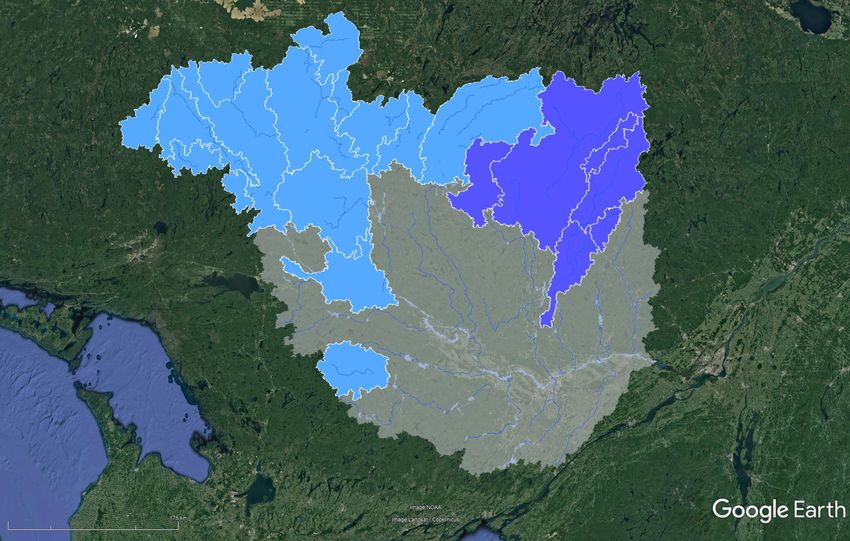
Ottawa River Watershed
• Mattawa
Basin Characteristics:
Most large reservoirs • Arnprior
located in the northern
portion
Over 60% of the basin
has no significant storage
(is uncontrolled)Ottawa River Watershed Basin Characteristics: Abitibi-Timiskaming to Ottawa is 62% of Total Area Half the Significant storage (51%)
Types of Structures

 Run-Of-River Dams             Reservoir Dams
Limited capacity to store   Capacity to store a portion
      spring runoff            of the spring runoff
  (Carillon, Chats Falls,    (Baskatong, Dozois, Des
 Chenaux, Bryson, Des       Quinze, Timiskaming, etc.)
Joachims, Otto Holden)
Major Run-Of-River Dams on the Ottawa River
Reservoir Management
             Annual Cycle

Winter           Spring         Summer             Fall
    Winter        Refill and
  drawdown       retention of   Summer level   Operations for
      and          water to     management       fall flood
 preparation       reduce        and drought    control and
for the spring   downstream       mitigation   reservoir refill
    freshet          flow
WATER STORED IN ABITIBI-TIMISKAMING-BARK LAKE
7.0
RESERVOIRS IN BILLIONS OF CUBIC METRES (1963-2019)
6.0
STORAGE VOLUME (Billions-m3)
5.0
4.0
3.0 Historically for the period 1963-2019
reservoir storage volume is found in
the green zone 50% of the time.
2.0
• Emptied-every winter
• Full after the spring run-off
1.0
0.0
JAN FEB MAR APR MAY JUN JUL AUG SEP OCT NOV DECLimits of Flow Regulation
Flooding occurs when:
• Spring runoff greatly
exceeds the size of
reservoirs
• There is significant spring Ottawa
runoff in areas where there
are no reservoirs
Example
Flooding extent and from
duration : 2017
• Is always reduced
• Eliminated in many yearsDaily work of the Regulating Committee
Collect all information relevant to flow forecasting (Secretariat)
Run flow models
(Hydro-Québec and Secretariat)
Assess forecast conditions(weather, inflows and levels/flow rates) and
optimize holding back to spring runoff in reservoirs to reduce flows
downstream to maximize flood alleviation (Regulating Committee)
Disseminate river conditions forecast to responsible authorities and the
public (Secretariat and MNRF – Surface Water Monitoring Centre)Keeping the Public Informed
of the Risk Flooding
6 Press Releases in 2019
11 April– Start of the spring
freshet
First peak – warning of the risk of
flooding:
• 16 April– levels similar to the first
peak of 2017
• 18 April– levels similar to the peak
of 2017
• 25 April– level possibly exceeding
those of 2017
Second peak–two notices:
• 3 May– Levels are high with
potential for further increases
• 9 May- Historic flooding from
Mattawa down to Lac Deschenes
ottawariver.ca / rivieredesoutaouais.caCommunicating the
Coming Flood Risk
Government Agencies
ON - MNRF, Surface Water Monitoring Centre
QC – Sécurité civile, COG
Municipalities (Courtesy Calls)
Traditional Media
Television, Radio and Newspapers
Website
Record internet usage
TwitterDaily updating of Website
Forecast Peak Flood Levels
                Utilized in the case of exceptional flooding
                • Used for the first time in 2017
                • Used once again in 2019
                • Published over 50 times in 2019

ottawariver.ca / rivieredesoutaouais.ca
Increased Forecasting 2017 : 3-day forecast at 4 locations 2019 : 4-day forecast at 6 locations
Events of 2019
Winter 2019 – Freshet Preparation
Snow on the Ground April 1st   Snowpack measurements
      % of Average

                                  Drawdown of reservoirs

                                https://www.tvanouvelles.ca/2019/04/11/dimportantes-crues-printanieres-a-craindre
Winter 2019 – Freshet Preparation
Spring Freshet 2019
                             Total Precipitation from April 1st to May 27th
                                              % of Normal

 Excess precipitation over
 the whole basin                                                           Saint-Maurice

 - Precipitation forecasts            Outaouais Supérieur                      159%
                                            175%
   limited over 1 week in
   advance
 - Historic tributary
   peaks!                                            Outaouais Inférieur
                                                           168%
Tributary Flooding 2019
Historic Tributary Flooding
Rouge river dam overtopping
http://www.cbc.ca/player/play/1507979331964/
New historic record peak flows from
the uncontrolled mid-basin tributariesWATER STORED IN ABITIBI-TIMISKAMING-BARK LAKE
7.0
RESERVOIRS IN BILLIONS OF CUBIC METRES (1963-2019)
2017
6.0
2019
STORAGE VOLUME (Billions-m3)
5.0
4.0
3.0
2.0
80% of the time storage volume is between the red lines
1.0 Average annual storage 4.9 billion m³
5.2 billion m³ stored in 2019
0.0
JAN FEB MAR APR MAY JUN JUL AUG SEP OCT NOV DECAt the flood peak 77% of the flow was from the uncontrolled sectors of the basin.
Ottawa River Water Volumes at Britannia
                                                                 (April 1st - June 6th)
                                                                                                      AVERAGE YEAR

                                    25.0
Billions of Cubic Metres (1E9 m³)

                                    20.0
                                                                2.3X
                                                                STORAGE
                                    15.0

                                    10.0

                                     5.0

                                     0.0
                                           Water Stored in Reservoirs     Water Volume At Britannia
Ottawa River Water Volumes at Britannia
(April 1st - June 6th) 2017 TOTAL
AVERAGE YEAR
25.0
4.0X
Billions of Cubic Metres (1E9 m³)
STORAGE
20.0
15.0
10.0
5.0
0.0
Water Stored in Reservoirs Water Volume At BritanniaOttawa River Water Volumes at Britannia 2019 TOTAL
(April 1st - June 6th) 2017 TOTAL
AVERAGE YEAR
4.4X
25.0 STORAGE
Billions of Cubic Metres (1E9 m³)
20.0
15.0
10.0
The total storage used in 2019
was 5.2 billion m³ but the
total water volume that
5.0 flowed through the river at
Britannia was 23.0 billion m³
0.0
Water Stored in Reservoirs Water Volume At BritanniaPEMBROKE LEVEL 2017
114.0
113.8 (1960)
(1947)
113.6 (1928)
113.4
113.2
113.0
112.8
ELEVATION (m)
112.6
112.4
112.2
112.0
111.8
111.6
111.4
111.2
111.0
110.8
110.6
JAN FEB MAR APR MAY JUN JUL AUG SEP OCT NOV DECPEMBROKE LEVEL 2017 2019
114.0
113.8 May 12th 113.69
113.6
113.4
113.2
113.0
112.8
ELEVATION (m)
112.6
112.4
112.2
112.0
111.8
111.6
111.4
111.2
111.0
110.8
110.6
JAN FEB MAR APR MAY JUN JUL AUG SEP OCT NOV DECAt Pembroke the overall reduction in flow from reservoir storage lowered the flood peak level by >70 cm or 28 in.
LAC COULONGE LEVEL                     2017

                109.4
                109.2
                109.0                           (1979)
                108.8
                108.6                               (2017)
                                      (1985)
                108.4
                108.2
                108.0
ELEVATION (m)

                107.8
                107.6
                107.4
                107.2
                107.0
                106.8
                106.6
                106.4
                106.2
                106.0
                105.8
                105.6
                        JAN   FEB   MAR   APR    MAY     JUN   JUL   AUG   SEP   OCT   NOV    DEC
LAC COULONGE LEVEL 2017 2019
109.4
109.2 May 12th 109.17
109.0
108.8
108.6
108.4
108.2
108.0
ELEVATION (m)
107.8
107.6
107.4
107.2
107.0
106.8
106.6
106.4
106.2
106.0
105.8
105.6
JAN FEB MAR APR MAY JUN JUL AUG SEP OCT NOV DECOn Lac Coulonge the overall reduction in flow from reservoir storage lowered the flood peak level by >80 cm or 30 in.
What determines the level
          in my area?

Arriving Upstream   Downstream Constrictions
       Flow             (Control Point)
Natural River Narrowings Restrict
the Passage of Water
Isle-aux-Allumettes
Rocher
Fendu
Grand calumet
Island Bryson
Narrowings cause water to
back up (similar to a funnel)
Before river flows become
high, run-of-river dam’s lower
their level above the dam and
conditions return to a near
natural stateUpstream Water Level Profile
Upper Reach (Not to Scale) Natural Constriction
16
15
Average Summer Level
14
Levels upstream of dams are typically
Level
13 stable for most of the year with a slight
slope from upstream to downstream.
12
11
10
100 90 80 70 60 50 40 30 20 10 0
Upstream DistanceUpstream Water Level Profile
Upper Reach (Not to Scale) Natural Constriction
16
Average Summer Level
Average Peak Level
15 2017-2019
Backwater Effect
14
Level
13
12
During flooding run-of-river dams lower levels
11
directly upstream to ensure they do not create a
backwater effect worsening upstream flooding.
10
100 90 80 70 60 50 40 30 20 10 0
Upstream DistanceUpstream Water Level Profile
Upper Reach (Not to Scale) Natural Constriction
16
Average Summer Level
Average Peak Level
15 2017-2019 During flooding upstream levels
Backwater Effect
are now determined by the point
of control. Even removing the
14 dam completely would achieve
no reduction in upstream levels.
Level
13
12 Same Level
11 Point of Control
10
100 90 80 70 60 50 40 30 20 10 0
Upstream DistanceREMOVAL OF ALL THE RUN OF RIVER DAMS WOULD STILL RESULT IN THE SAME FLOOD LEVELS!
Dam Mismanagement?

     Lowering of levels above run-of-river dams
is done every year and not just on the Ottawa River
DES JOACHIMS LEVEL 2019
153.0
152.5
152.0
ELEVATION (m)
151.5
151.0
150.5
Over the last seventy years the operational norm for
Des Joachims is to lower reservoir levels every spring.
150.0
A small storage volume is available and was used to
decrease flooding downstream in April 2019
149.5 Further raising of levels would have worsened
upstream flood levels in Mattawa by 40 cm
149.0
JAN FEB MAR APR MAY JUN JUL AUG SEP OCT NOV DECOttawa River Water Flow Regulation TOTAL 2019
During the Spring Freshet (April 1st-June 6th) AVERAGE YEAR
105X
12
POTENTIAL
STORAGE
10
Billions of Cubic Metres (1E9 m³)
8
6 The water volume that flowed through
the Des Joachims dam in 2019 was
much larger than the volume that could
4 have been stored.
Minimal and short-term possible
benefit to downstream locations
2 Certainty of making upstream flood
levels 40 cm worse in Mattawa
0
Available Storage in Des Joachims Water Volume At Des JoachimsExceptional Spring Flooding
Historic flooding from Pembroke down to Montreal
Record levels recorded at Pembroke, Westmeath/Lac Coulonge, Chats
Lake, Britannia beach
Level in Gatineau/Hull similar to 2017
• Highest since start of recording in 1964
Flow rate at Carillon dam similar to 2017
• Probably the highest flow in recorded history (1880’s->)
Exceptional floods occurred in 20’s, 50’s, 70’s, 2017 and
2019
Other exceptional floods are to be expected in the futureRisks of Living in the
Floodplain
Risk over a 50-yr Period 100-yr Flood
Over a 50-year Is actually a 1%
period, there’s 40% flood, meaning that
chance of getting a on any given year,
100-yr flood event there is a 1% chance
at least once of having a flood of
this magnitudeLimitations of Regulation
Size of reservoirs smaller than spring runoff, large
portion of the watershed uncontrolled
Flooding cannot be prevented
Peak of the flood is substantially reduced
Amount of precipitation, rate of snowmelt and natural
stream characteristics are main factors in flood levels
Meteorological factors are known only a few days aheadInformation
Current Water levels
Toll free number 24 hours per day
Ottawa-Gatineau Outside
613-995-3443 English 1 800 778-1246
613-995-3455 French 1 800 778-1243
Flow forecasts
Web Site: http://www.ottawariver.ca
during freshet
Twitter @ORRPB
Ottawa River Regulation Secretariat
373 Sussex Dr, Block E1, Room E120
Ottawa, Ontario
Email : secretariat@ottawariver.caYou can also read