NATIONAL MANGO BOARD August 18, 2020 - Manuel Michel, , linkedin.comin/manuel-michel-3b62101b/ Adrian Tennant ...
←
→
Page content transcription
If your browser does not render page correctly, please read the page content below

NATIONAL MANGO BOARD
     August 18, 2020

           Manuel Michel, mmichel@mango.org, linkedin.com/in/manuel-michel-3b62101b/
           Adrian Tennant, atennant@bigeyeagency.com, linkedin.com/in/adrianctennant/
                Tricia Bramley, tbramley@mango.org, linkedin.com/in/triciabramley/
Manuel Michel
Executive Director

National Mango Board

mmichel@mango.org

linkedin.com/in/manuel-michel-3b62101b/
MANGO IMPORT VOLUME
                                20
                                                                                       Monthly Arrivals at U.S. Entry Ports                                  18.6
Boxes (4 kg) in Millions                                                                                                                                            18.4
                                18
                                           2019           2020                                                                                                                       15.2 15.4
                                16
                                                                                                                                    13.5
                                14
                                12
                                                                                       9.6              9.2
                                10                      8.8                  8.4                                                             8.3
                                                                                                                   7.7
                                 8
                                 6          4.9
                                 4
                                 2
                                 0
                                                  Jan                              Feb                       Mar                        Apr                     May                       Jun

                                5
                                                                                                MANGO IMPORT VOLUME                                                                         H1 2020 =
                                                                                             Weekly Arrivals at U.S. Entry Ports                                                            +0% YoY
     Boxes (4 kg) in Millions

                                4               2019              2020

                                3

                                2

                                1
                                            January                          February                   March                       April                     May                         June
                                0
                                      1     2      3          4    5     6         7     8     9   10   11    12         13   14   15   16    17   18   19    20    21     22   23   24   25     26   27   3
                                Sources: National Mango Board and USDA Market News
WHOLE MANGO AT RETAIL                                               H1 2020 =
                                                                                      Volume Velocity and Avg. Price                                       +5% YOY
                           400                                                                                                               389                $4.00
                                                                                                                                                     343
Units / Store / Week

                                            2019 Volume Velocity                    2020 Volume Velocity                      331
                                            2019 Avg. Price                         2020 Avg. Price                                  307
                           300                                                                                                                                  $3.00
                                                                                                    238      245      241
                                                                             202
                           200         153       175                                          168                                                               $2.00
                                                                    142
                                                                    $1.23                     $1.17                 $1.05           $0.94          $0.88
                           100           $1.06                                                                                                                  $1.00
                                              $0.98                         $1.00                   $1.05     $0.94          $0.82          $0.78
                             0                                                                                                                                  $-
                                             Jan                         Feb                     Mar             Apr            May            Jun

                                                                                      WHOLE MANGO AT RETAIL                                                H1 2020 =
                                                                                          Sales Velocity                                                   +10% YOY
                           $400
    Sales / Store / Week

                                       2019 Avg. Sales          2020 Avg. Sales                                                             $304 $301
                                                                                                                                     $289
                           $300                                                                                              $270
                                                                                                      $250            $252
                                                                                                             $229
                                                                            $202             $196
                           $200                                     $175
                                       $162      $171

                           $100

                             $0
                                             Jan                         Feb                     Mar               Apr          May            Jun
                             Sources: Nielsen Answers on Demand® (26 weeks ending 6/27/20)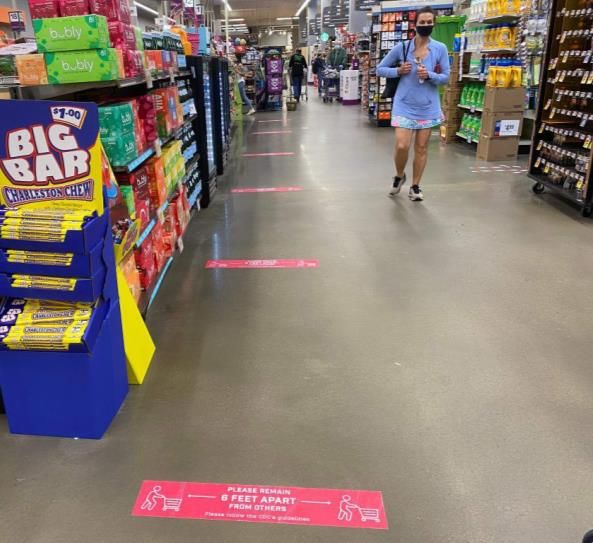
FRESH-CUT MANGO AT RETAIL
                                                                                       Volume Velocity and Avg. Price
                               40                                                                                                                                 $20.00
Units / Store / Week

                                            2019 Volume Velocity                     2020 Volume Velocity
                                            2019 Avg Price                           2020 Avg Price
                                                                                                                                                               H1 2020 =
                               30                                                                                                                              -1%$15.00
                                                                                                                                                                   YOY
                                                                                                 21   21        21             20      21              21
                                                                       18                                              19                       19
                               20          17      16                         17                                                                                  $10.00

                                                 $4.90                      $4.64                    $4.98            $5.05           $5.01          $4.98
                               10                                                                                                                                 $5.00
                                         $4.79                      $4.63                       $4.87         $4.86           $4.80            $4.88

                                0                                                                                                                                 $-
                                              Jan                         Feb                      Mar           Apr             May              Jun

                                                                                     FRESH-CUT MANGO AT RETAIL
                                                                                                                                                               H1 2020 =
                                                                                            Sales Velocity
                                                                                                                                                               +3% YOY
                               $125
        Sales / Store / Week

                                         2019 Sales Velocity          2020 Sales Velocity                                               $107
                                                                                                  $101 $105                                             $104
                                                                                                                 $101 $95       $96              $93
                               $100
                                                    $82                  $87 $83
                                             $81
                                $75

                                $50

                                $25

                                    $0
                                                 Jan                         Feb                      Mar             Apr             May              Jun
                                Sources: Nielsen Answers on Demand® (26 weeks ending 6/27/20)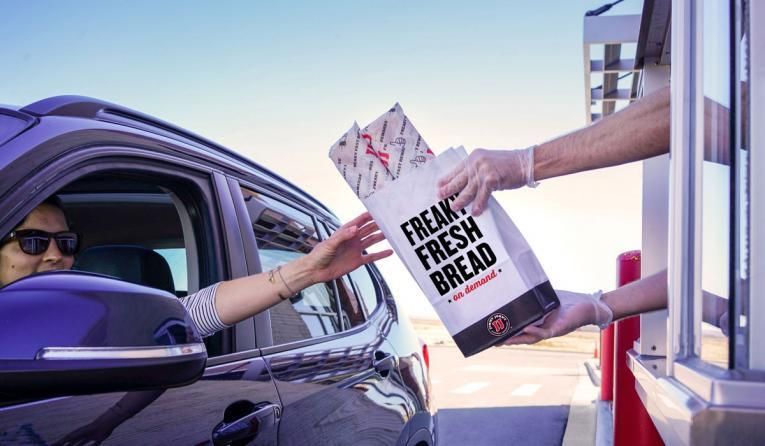
FROZEN MANGO
                                                                                              Import Volume
              9,000
                                                                                           8,519
                                  2019           2020
              8,000
                                                                                                                                              H1 2020 =
                                                                                                                                              +22% YOY
              7,000                                                                                        6,703

                                                                                   5,951
Metric Tons

              6,000                                              5,813

              5,000        4,535                       4,508                                                                4,644
                                                                                                                                    4,200
                                                                                                   3,942                                    3,795
              4,000                                                                                                3,756
                                        3,459
              3,000

              2,000

              1,000

                  0
                                  Jan                          Feb                     Mar             Apr                 May          Jun
                Sources: USDA-FAS Global Agricultural Trade System (GATS) Online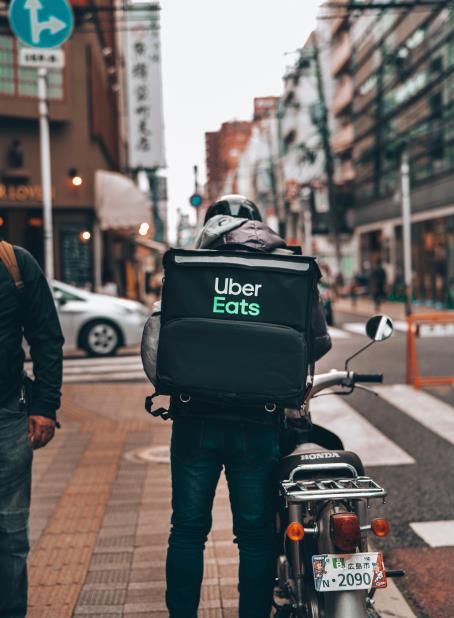
FROZEN MANGO AT RETAIL                                          H1 2020 =
                                                                                            Volume Velocity and Avg. Price                                   +29% YOY
                        20                                                                                                              19                         $8.00
                                      2019 Volume Velocity              2020 Volume Velocity                            18                              18
                                      2019 Avg. Price                   2020 Avg. Price                 17
  Units/Store/Week

                        15                       14                                                                                                                $6.00
                                        13                                                                      13              13              13
                                                                     12    12                   12                     $4.55
                                                                                                       $4.40                           $4.56           $4.24
                                       $4.09                             $4.22
                        10                                          $4.12                                      $4.14           $4.14           $4.12               $4.00
                                            $4.03                                              $4.17

                            5                                                                                                                                      $2.00

                        -                                                                                                                                          $0.00
                                           Jan                         Feb                        Mar             Apr             May             Jun

                                                                                       FROZEN MANGO AT RETAIL                                                  H1 2020 =
                                                                                            Sales Velocity                                                     +39% YOY
                       $100                                                                                                             $88
Sales / Store / Week

                                     2019 Avg. Sales          2020 Avg. Sales                                           $84
                                                                                                        $74                                             $78
                        $75
                                        $52    $55                          $52                $51              $52            $53              $52
                                                                    $49
                        $50

                        $25

                         $0
                                             Jan                          Feb                        Mar             Apr             May             Jun

                            Sources: Nielsen Answers on Demand® (26 weeks ending 6/27/20)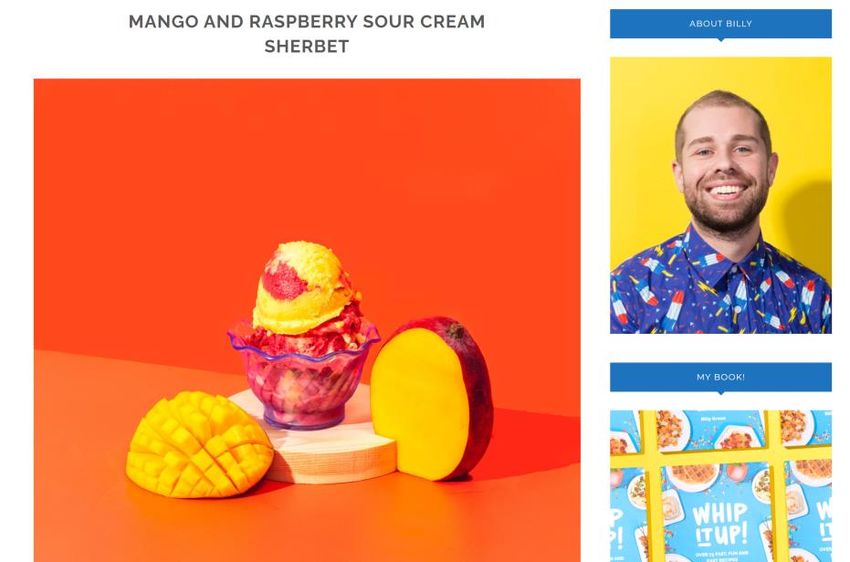
Summary: 2020 U.S. Mango Market
● Overall, mango market has experienced an increase in
  consumer demand during the first half of 2020

● Fresh-whole and fresh-cut mango had to overcome distribution
  challenges in early April, but rebounded into May and June

● Frozen mango has had higher than normal supply and demand
  during the first half of 2020
Adrian Tennant
VP, Insights

Bigeye

atennant@bigeyeagency.com

linkedin.com/in/adrianctennant/

Unprecedented Disruption
“Never before in the recent past of of our nation have we been
forced to confront the magnitude of abrupt changes that
COVID-19 circumstances foisted upon us all. So the food
industry… suddenly found itself facing an unprecedented
disruption.”
David Fikes,
Executive Director, FMI Foundation
Unprecedented Disruption
US Economy Suffers Historic   Stimulus Checks Drive   Restaurant Industry   Food Delivery Surges
Slowdown                      Increased Food Sales    Collapses
US Economy Suffers Historic Slowdown Amid Pandemic

                                                                 -33%
                                                                 Decline in GDP in the
                                                                 second quarter of 2020

US Bureau of Economic Analysis, July 2020; Statista, July 2020
How Americans Used Their Stimulus Checks
59%
of surveyed households
said they used, or planned
to use, their stimulus
payment for food during
the COVID-19 pandemic
Weekly Household Pulse Survey, US Census Bureau, July 9-14 2020; Statista, July 2020Foodservice Collapse
Year-over-year change in seated
diners at restaurants on the
OpenTable network, including
online reservations, phone
reservations, and walk-ins
OpenTable, March 2020; Statista, March 2020Changes in Where Consumers Shop
Shop at fewer stores 40%
78% Shop online more
Avoid stores I usually shop at
28%
15%
of shoppers have made a Changed store I shop at most frequently 11%
change to where they
shop as a result of the Shop at different types of stores 10%
COVID-19 pandemic
No longer shop in-store 10%
FMI and The Hartman Group, June 2020Changes in How Consumers Shop
Spend more money each visit 44%
89% Shopping trips are faster
Purchase a narrower range of products
32%
25%
of shoppers have made a
change to how they shop
as a result of the COVID-
Spend more money online 16%
19 pandemic
FMI and The Hartman Group, June 2020Changes in Who Shops for Grocery Items
Only one person shops when previously 24%
36%
two or more shopped
Someone outside the household (e.g. a 11%
relative or friend) shops
of shoppers have made a
change to who shops
Different person in household shops now 3%
as a result of the COVID-
19 pandemic
FMI and The Hartman Group, June 2020Cooking at Home More, Eating Healthily
Cook more of my meals 41%
36% Plan more meals in advance 27%
of shoppers report
healthier eating habits,
Try new dishes more often 20%
compared to before
COVID-19.
FMI and The Hartman Group, June 2020E-Commerce: Years Happening in Weeks Bank of America, U.S. Department of Commerce, ShawSpring Research, 2020
Food and Beverage: Fastest Growing E-Com Category

58%
Year-over-year growth of
food and beverage items
purchased via digital
channels in 2020

eMarketer, May 2020
Grocery Delivery and Pickup: Sales Growth

233%
Sales growth between
August 2019 and March
2020

80%
Sales growth between
March and June 2020.

Sales of grocery delivery and pickup in the United States in August 2019 and March to June 2020 (in billions US dollars)
Statista, July 15, 2020
Winners: Delivery and Pickup
Estimated year-over-year
increase in Amazon Fresh
orders.

323%

eMarketer, July 2020; Statista, July 2020; MarketWatch, July 2020; Quartz, April 2020; Edison Trends, April 2020, CNBC, June 2020.
Implications
New Habits?

88%                   48%                   38%
of adults expect a    of adults expect to   of respondents
persistent change     prepare meals         expect to
to cooking, dining,   more frequently       eat out less often
and shopping habits
Tricia Bramley
Director, Marketing & Communications

National Mango Board

tbramley@mango.org

linkedin.com/in/triciabramley/
Break or Pivot?
What happens with retail?
With foodservice?
How do we reach consumers now?
How do we look to the future?
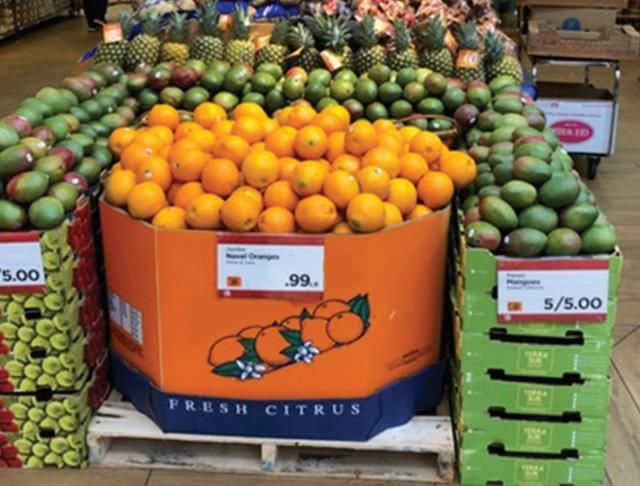
26The Retail Pivot
27The Retail Pivot
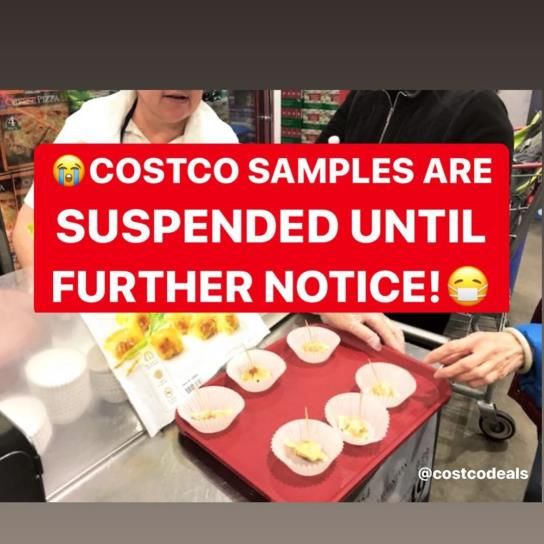
In-Store Sampling Paused Retailers conserve floor space Shoppers make trips quick
28The Retail Pivot
29The Retail Pivot: Frozen
We focused on narratives we could control and amplify in
a world of chaos and uncertainty
• Build awareness and consumption of frozen mangos
Increase overall knowledge
• Leverage consistent availability and versatility
• Leverage packing
30The Foodservice Pivot
31The Foodservice Pivot
“Restaurants and employees are feeling the catastrophic effect of the COVID-19 pandemic
across the country. Since March 1, the industry has lost more than 3 million jobs and $25
billion in sales, and roughly 50% of restaurant operators anticipate having to lay off more
people in April.” – National Restaurant Association
Keep mangos top of mind with operators, chefs, and
media
• Recipe and content development
• Chef’s video series – techniques and
how to’s
• Advertising – social media, foodservice
trade publications, advertorials, and
partnerships
• Social good opportunities
32The Social Pivot
33The Social Pivot
Targeting
Targeted ads based Interactive campaigns Paid activations Sponsored posts
on archetypes and partnerships
• Multiple variations
of ads
• Performance
constantly
evaluated and
adjusted
• Social listening to
stay aware of
concerns and
conversation
34The Social Pivot
Mango Madness Happier Hours and Demos Recipe Development
Instagram Stories Simple recipes Recipe inspiration
execution Nutrition focus Travel through taste
Vote on favorite Easy to make at home Tap into ‘Quarantine
recipes. One will win! Kitchen’ initiatives
35The Web Pivot
36The Web Pivot
Targeted Landing Pages
• Copy and imagery matched
every ad we ran
• Benchmarked all of our
metrics before we ran our
ads
• A/B tested placement and
UX for optimization
• Retargeted for additional
messaging
37The Full Plan Pivot: Results
38The Full Plan Pivot Results
On the web:
• Users are up 98%
through June
• New Users are up 102%
• Pageviews are up 112%
• Pages per session are up
almost 10%
• Average session
duration is up 11%
On social:
• Audience growth is up
12%
• Total engagements is up
60%Pivoting into 2021
40The Full Plan Pivot: What Next?
We don’t know what 2021 will look like, so we’re using this time period to our
advantage
• Data is king!
• Learning about our consumers: what makes them tick? What do they need
from us?
• Finding more archetypes to focus on
• Optimize our user experience journeys on our sites
• Enhance our partnerships with retailers and influencers
And now it’s time to get back to basics
• Create exciting meaningful content that resonates and educates
• Enhance our future programs with this data
41Thanks for attending!
Manuel Michel, mmichel@mango.org, linkedin.com/in/manuel-michel-3b62101b/
Adrian Tennant, atennant@bigeyeagency.com, linkedin.com/in/adrianctennant/
Tricia Bramley, tbramley@mango.org, linkedin.com/in/triciabramley/
42https://www.usatoday.com/story/money/food/2020/03/0
6/costco-samples-coronavirus-suspends-free-
samples/4980216002/
43You can also read