Saudi Arabian Mining Company (Ma'aden) - Investor Presentation - Q2 2021 Results - Tadawul

Page created by Jerome Watkins
 
CONTINUE READING
Saudi Arabian Mining Company (Ma'aden) - Investor Presentation - Q2 2021 Results - Tadawul
Growing a Saudi Global
                                              Mining Giant

Saudi Arabian Mining Company (Ma’aden)
Investor Presentation – Q2 2021 Results

                                             10 th August 2021
Frederik Michaelsen
Senior Investor Relations Advisor

                                    2 of 40
Disclaimer
This presentation contains statements that are, or may be deemed to be, forward looking statements, including statements about the beliefs and expectations of the
Saudi Arabian Mining Company Ma’aden (the "Company"). These statements are based on the Company's current plans, estimates and projections, as well as its
expectations of external conditions and events. Forward-looking statements involve inherent risks and uncertainties and speak only as of the date they are made. As a
result of these risks, uncertainties and assumptions, a prospective investor should not place undue reliance on these forward-looking statements. A number of important
factors could cause actual results or outcomes to differ materially from those expressed in any forward-looking statements. The Company is not obliged to, and does not
intend to, update or revise any forward- looking statements made in this presentation whether as a result of new information, future events or otherwise.

This communication has been prepared by and is the sole responsibility of the Company. It has not been reviewed, approved or endorsed by any financial advisor, lead
manager, selling agent, receiving bank or underwriter retained by the Company and is provided for information purposes only. In addition, because this communication
is a summary only, it may not contain all material terms and in and of itself should not form the basis for any investment decision.

The information and opinions herein are believed to be reliable and have been obtained from sources believed to be reliable, but no representation or warranty, express
or implied, is made with respect to the fairness, correctness, accuracy, reasonableness, or completeness of the information and opinions. There is no obligation to
update, modify or amend this communication or to otherwise notify you if any information, opinion, projection, forecast or estimate set forth herein, changes or
subsequently becomes inaccurate.

You are strongly advised to seek your own independent advice in relation to any investment, financial, legal, tax, accounting, or regulatory issues discussed herein.
Analyses and opinions contained herein may be based on assumptions that if altered can change the analyses or opinions expressed. Nothing contained herein shall
constitute any representation or warranty as to future performance of any financial instrument, credit, currency, rate, or other market or economic measure.
Furthermore, past performance is not necessarily indicative of future results. The Company disclaims liability for any loss arising out of or in connection with your use of,
or reliance on, this communication.

These materials may not be published, distributed or transmitted and may not be reproduced in any manner whatsoever without the explicit consent of Ma’aden’s
management. These materials do not constitute an offer to sell or the solicitation of an offer to buy the securities in any jurisdiction.

Non-IFRS financial measures
Some of the financial information included in this presentation is derived from Ma’aden consolidated financial statements but are not terms defined within the
International Financial Reporting Standards (IFRS) as applied In the Kingdom of Saudi Arabia. Such information is provided as the Company believes they are useful
measures for investors. A reconciliation of this information with the consolidated financial statements is included in the presentation

                                                                                                                                                                                3 of 40
Abdulaziz A. Al Harbi
Chief Executive Officer (A)

                              4 of 40
Ma’aden outperformed both, peers and the market
Relative Share Price Performance (indexed to 100)
                                                                                                                                    Ma’aden 2019 Equity
                                                                                                                                     increase (Debt for                   Annualized return since the IPO
300%
                                                                            Ma’aden 2014                                                Equity swap)                      (in percent)
                                                                             Rights issue
                                                                            250 M Share                                                                                   Ma’aden           11.6%
250%

                                                                                                                                                                          Mining Giants1     9.5%
200%
                                                                                                                                                                          Pure Players2      8.2%

150%                                                                                                                                                                      Saudi INDEX        4.1%
  Ma’aden
   IPO
100%
                                                                                                                                                                          Absolute return in Q2 2021
                                                                                                                                                                          (in percent)
 50%                                                                                                                                                                      Ma’aden             24%

                                                                                                                                                                          Absolute return in H1 2021
  0%
                                                                                                                                                                          (in percent)
                                                                                                                                                                          Ma’aden             75%

                                           TASI             Mining Giants1                  Pure players2               MAADEN

       1 Includes Anglo American, BHP, Glencore, Rio Tinto, Vale, Vedanta      2 Includes Aluminum Corp of China, Rusal, Mosaic, Phosagro, Barrick, GoldFields, Newmont
                                                                                                                                                                                                       5 of 40
Health, Safety, Security & Environment
(HSSE)

                                         6 of 40
EHSS Performance
Ma’aden compares favorably with peers
           All Incidents Frequency Rate - AIFR                                                            Benchmarking
 1.00                                                                          1.00

 0.80                                                                          0.80

 0.60                                                                          0.60

                                0.37
 0.40   0.31                                                                   0.40
                   0.27                                                 0.30
                                             0.22
                                                                                                                                             0.17
 0.20                                                      0.14                0.20

 0.00                                                                          0.00
        2017       2018         2019         2020         2021-Q1   2021-Q2           2016         2017    2018        2019   2020           2021
                                                                                                                                           (Rolling)

               Ma'aden              Contractor               Combined                  Ma'aden               ICMM                    Newmont

                                                                                       Rio Tinto             Barrick                 BHP

                  AIFR:   Recordable Injuries X 200,000
                          Manhours worked

                                                                                                                                                       7 of 40
Q2 2021 Update

                 8 of 40
Q2 2021 - Financial Performance Update
Ma’aden recorded a net profit of SR1,349mn in Q2

         • Sales was SR6.1bn Q2; up 12% q-o-q, due to higher commodity prices of all products, partially offset by the decrease
           in sales volumes of all products, except Phosphate and Alumina. Sales was up 52% y -o-y; due to higher prices of all
           products, partially brought down by lower volumes of Ammonia, Gold and Alumina.

         • EBITDA was SR2.8bn in Q2; up 25% q-o-q, mainly due to higher commodity prices despite lower volumes and higher
           operating expenses. EBITDA up 157% y-o-y, due to higher sales, lower G&A and exploration, despite higher raw
           material prices and selling & marketing expenses.

         • Net profit was SR1.35bn in Q2; up 59% q-o-q, mainly due to higher EBITDA combined with lower finance charges and
           depreciation. Compared to net loss of SR0.73bn in Q2-20, mainly due to higher EBITDA, higher share in JV net income
           and lower finance cost, partially offset by higher selling & marketing, zakat & income tax and lower income from time
           deposits.

         • Cash generated from operations was SR1.9bn; up 39% q-o-q.

         • Working capital was SR5.6bn at the end of Q2; up 10% q-o-q due to higher inventories and receivables, partially offset
           by higher payables.

                                                                                                                                    9 of 40
Q2 2021 - Production Update
Ammonia and Gold production down; Phosphate and Alumina production up

         • Ammonium Phosphate production was 1,407kt (up 31% q-o-q and up 16% y-o-y)

         • Ammonia production was 359kt (down 28% q-o-q and down 36% y-o-y)

         • Aluminum production was 249kt (down 3% q-o-q and down 1% y-o-y)

         • Alumina production was 489kt (up 11% q-o-q and up 14% y-o-y)

         • Flat Rolled Products production was 68kt (down 7% q-o-q and down 1% y-o-y)

         • Gold production was 80koz (down 18% q-o-q and down 30% y-o-y)

         • Copper production was 16.5kt (down 1% q-o-q and down 3% y-o-y)

                                                                                        10 of 40
Unplanned shutdowns in Q2 2021
Issues caused by the fire on May 2021 to be resolved in Q3

          Unscheduled shutdown in Ammonia (MPC)
          • Leaking tubes in the reformer convections section
          • Duration was 18 days
          • Repairs completed on May 14th 2021

          Fire at MPC on May 20th
          • Announced on the Tadawul stock exchange
          • Duration in Q2 was 41 days
          • Repairs ongoing; to be completed in Q3

                                                                11 of 40
Market Prices & Outlook

                          12 of 40
Phosphate & Ammonia Prices
Both, Phosphate and Ammonia prices continued to rise
             $600                                                              $600

                                                                               $550
             $500
                                                                               $500

             $400                                                              $450

                                                                               $400
             $300
                                                                               $350

             $200                                                              $300

                                                                               $250
             $100
                                                                               $200

               $0                                                              $150

                                                     DAP        Ammonia
                                              (Avg. KSA FOB)   (Avg. ME FOB)
                                                                                      13 of 40
Aluminum & Alumina Prices
The spread between Aluminum and Alumina widened further
             $2,500                                                                       $650

                                                                                          $600
             $2,300
                                                                                          $550

             $2,100                                                                       $500

                                                                                          $450
             $1,900
                                                                                          $400

             $1,700                                                                       $350

                                                                                          $300
             $1,500
                                                                                          $250

             $1,300                                                                       $200

                                    LME Cash Aluminum Price   Alumina Price Index (API)

                                                                                                 14 of 40
Gold & Copper Prices
Gold slightly up, the Copper rally came to an end
              $2,000                                                                $11,000

              $1,900
                                                                                    $10,000
              $1,800

              $1,700
                                                                                    $9,000
              $1,600

              $1,500                                                                $8,000

              $1,400
                                                                                    $7,000
              $1,300

              $1,200
                                                                                    $6,000
              $1,100

              $1,000                                                                $5,000

                                                    Gold in $/oz   Copper in $/kt

                                                                                              15 of 40
Yaser A. Barri
SVP, Finance & Chief Financial Officer (A)

                                             16 of 40
Q2 2021 - Financial Performance

                                  17 of 40
Q2 2021 - Consolidated Key Financial Results

                                               18 of 40
Q2 2021 Net Profit – Quarter on Quarter Comparison
Net profit in Q2 2021 up 59%, mainly due to the price effect

 Movement in net profit by line items (q-o-q)

   Profit / (Loss) attributed to the shareholders’ of the parent company
   Profit / (Loss) attributed to minority interest

                                                                      -340
                                                                                  13               1,349
                                                                                           -163
                                         992

           848
                                                                                                     1,105

            761

                                                                                                      245
            87
        Net profit                      Price                      Sales vol.   Finance   Others   Net profit
         Q1-21                          effect                       effect       cost              Q2-21
                                                                                                                19 of 40
Q2 2021 Net Profit – Year on Year Comparison
A net profit in Q2 2021, compared to net loss in Q2 2020

 Movement in net profit by line items (y-o-y)

   Profit / (Loss) attributed to the shareholders’ of the parent company
   Profit / (Loss) attributed to minority interest

                                                                     -87
                                                                                258       -266    1,349

                                                                                                    1,105

                                      2,172
                                                                                                     245

          -434

          -293

        -728
       Net loss                       Price                       Sales vol.   Finance   Others   Net profit
        Q2-20                         effect                        effect       cost              Q2-21

                                                                                                               20 of 40
Q2 2021 - Consolidated Sales and EBITDA by Segment
Phosphate accounts for 52% of Group EBITDA, Aluminum for 39%, Gold for 9%

        Consolidated                                          Phosphate
                                         vs.        vs.                                       vs.        vs.
                              Q2-21    LY Qtr.   Prev. Qtr.                         Q2-21   LY Qtr.   Prev. Qtr.

        Sales (SRmn)          6,101     52%      12%          Sales (SRmn)          3,136    93%        16%

        EBITDA* (SRmn)        2,750     157%     25%          EBITDA* (SRmn)        1,423    326%       42%

        EBITDA margin         45%       18%      5%           EBITDA margin         45%      25%        8%

                                                              52% of Group EBITDA

        Aluminium                                             Gold
                                         vs.        vs.                                       vs.        vs.
                              Q2-21    LY Qtr.   Prev. Qtr.
                                                                                    Q2-21   LY Qtr.   Prev. Qtr.

        Sales (SRmn)          2,408     47%      14%          Sales (SRmn)          557      -26%       -13%

        EBITDA* (SRmn)        1,071     194%     24%          EBITDA* (SRmn)        256      -31%       -22%

        EBITDA margin         44%       22%      4%           EBITDA margin         46%      -3%        -5%

        39% of Group EBITDA                                   9% of Group EBITDA

                                                                                                                   21 of 40
Quarterly EBITDA and EBITDA margins
Record EBITDA in Q2 2021 and margins continue to rise

                                       55%
             52%                               53%
                   50%                               51%
                               47%
                                                           44%                                                                       45%
                         43%                                                                                                 40%
                                                                                                                     36%

                                                                   33%          33%                          32%
                                                                         30%          29%
                                                                                                     27%
                                                                                               25%
                                                                                                                                     2,750

                                                                                                                             2,193
                                       1,966                                                                         2,003
                                               1,815 1,727
                                                           1,681
             1,428 1,504 1,345 1,541                               1,392 1,310 1,439 1,416                   1,470
                                                                                               1,091 1,069

                                                       EBITDA (mn SR)          EBITDA Margin

                                                                                                                                             22 of 40
Q2 2021 - Consolidated statement of cash flows
Healthy cash flow from operating activities
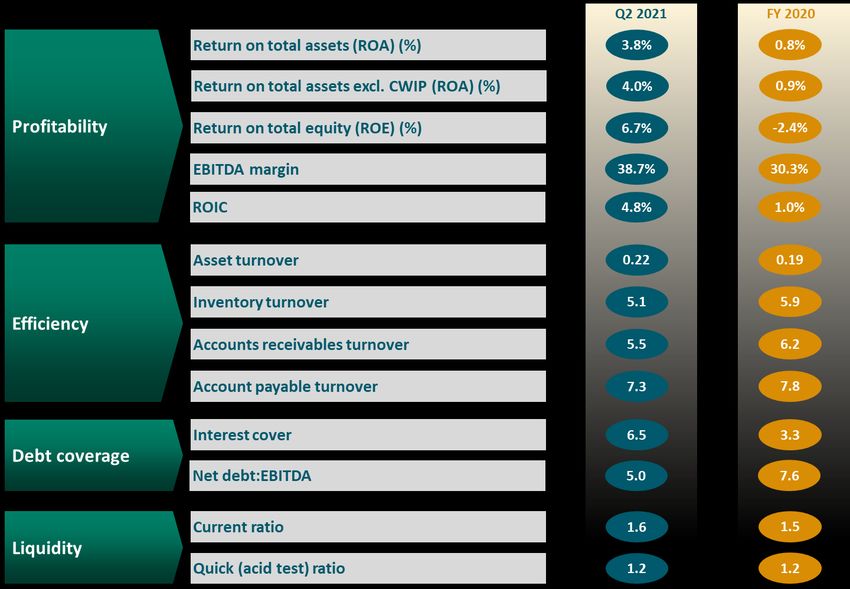
                                                 23 of 40
Financial Ratios
Net debt to EBITDA ratio continues to decrease

                                                 24 of 40
Q2 2021 - Operational Performance

                                    25 of 40
Phosphate & Ammonia: Production & Sales in Q2 2021
The fire in May 2021 affected Ammonia production in Q2 2021

          Ammonium Phosphate Fertilizer                                                Ammonia
  1,600                                                           600                                               563
           1,407 1,375
  1,400                                                                                     498
                                                   1,209 1,239    500
  1,200                        1,071 1,080
  1,000                                                           400   359
                                                                                                                            336
    800                                                           300                               269
    600
                                                                  200
    400
                                                                              87
    200                                                           100

      0                                                             0
            Q2 2021              Q1 2021                Q2 2020         Q2 2021              Q1 2021                    Q2 2020

                 Production (in kmt)   Sales (in kmt)                         Production (in kmt)      Sales (in kmt)

                                                                                                                                  26 of 40
Aluminum & Alumina: Production & Sales in Q2 2021
Alumina production increased; Aluminum production slightly down

                  Aluminum                                                                                                            Alumina
258                                                                                                            600
                       256 256                                                                                       489
256                                                254                                                         500                       441                     429
254                                                                                                            400
252                                          251
                                                                                                               300
250   249 249
                                                                                                               200
248
                                                                                                                            67                                         70
246                                                                                                            100                               42
244                                                                                                              0
      Q2 2021           Q1 2021              Q2 2020
                                                                    Flat Rolled Products                             Q2 2021              Q1 2021                Q2 2020
                                                         90
         Production (in kmt)      Sales (in kmt)                    80                   81                                Production (in kmt)        Sales (in kmt)
                                                         80                       73                           72
                                                              68                                       69
                                                         70

                                                         60

                                                         50

                                                         40
                                                              Q2 2021            Q1 2021               Q2 2020

                                                                   Production (in kmt)        Sales (in kmt)
                                                                                                                                                                            27 of 40
Gold & Copper: Production & Sales in Q2 2021
Gold production down, Copper production flat

                            Gold                                                               Copper
 140                                                                 17.5
                                                               116                                                        17.0
                                                       115
 120                                                                 17.0
                             97                                                                   16.6
                                     96                                     16.5
 100                                                                 16.5
         80   82                                                                   16.2
  80                                                                                                                              16.0
                                                                     16.0
  60                                                                                                      15.4
                                                                     15.5
  40
                                                                     15.0
  20

   0                                                                 14.5
         Q2 2021              Q1 2021                      Q2 2020           Q2 2021               Q1 2021                    Q2 2020

               Production (in koz)        Sales (in koz)                            Production (in kmt)      Sales (in kmt)

                                                                                                                                         28 of 40
Updates on Ma’aden’s Projects

                                29 of 40
Fertilizer Projects
Major capacity expansions are under way

         Ammonia 3
         • Expected to produce 1,1kmt p.a.
         • US$1,113mn Budget
         • Completion: Q4 2021 (20kmt) and full operational Q1 2022

         Phosphate 3
         • Expected to produce 3,0kmt p.a.
         • US$4,219mn Budget
         • Completion: 2025 (Phase 1) 2027 (Phase 2)

         Remediation at Wa’ad Al-Shamal
         • Phosphate production to improve from 2.8kmt in 2021 to 3.1kmt in 2025

                                                                                   30 of 40
Gold & Base Metal Projects
On track to achieve the long term target of producing 1mn ounces of gold

          MMGP
          • Expected to produce 250k ounces p.a.
          • US$880mn Budget
          • Completion: Q2 2022

          Mahd Expansion
          • Expected to produce 250k ounces p.a.
          • US$761mn Budget
          • Completion: 2025

          Ar-Rujum
          • Expected to produce 250k ounces p.a.
          • US$785mn Budget
          • Completion: 2026

                                                                           31 of 40
Q&A

      32 of 40
Growing a Saudi Global
                Mining Giant

Thank You
Appendix

           34 of 40
COVID-19 Update
100% of employees are now vaccinated

  1.20

  1.00

  0.80                                                                                                                                 0.73

  0.60

  0.40
                                                                                                                                       0.18
  0.20
                                                                                                                                       0.01
  0.00

                                        Overall                                 Direct                             Contractors
         Infection rate is the percentage of the overall workforce with an active COVID-19 infection.
         This is calculated by the following formula:

         # of Active Infections X 100 = Rate of Infection
            Workforce

         (The provided data included all Maaden Affiliates Employees including contractor count. The total number is approx. 25,000)
                                                                                                                                              35 of 40
Debt repayment profile
Scheduled debt repayment profile (in USD millions)

 2,000
                MIC      MGBM          MWSPC          MBAC     MRC       MAC          MPC      Pre-Refinance Repayment
 1,800

 1,600

 1,400

 1,200

 1,000

   800

   600

   400

   200

    -
         2021   2022    2023    2024    2025   2026     2027   2028   2029     2030   2031   2032    2033     2034       2035

                                                                                                                                36 of 40
Unplanned shutdowns in Q1
Q1 issues have been fully resolved

          Unscheduled shutdown in phosphate (MPC)
          • Reactor leak, but neither safety injuries or environmental damage
          • Duration was 26 days
          • Repairs completed on 15 March 2021

          Unscheduled shutdown in Ammonia (MWSPC)
          • The roof lining was damaged.
          • Duration was 9 days
          • Repairs completed on 16 April 2021

                                                                                37 of 40
You can also read