FY2019 AGM PRESENTATION CORPORATE - KIMLY LIMITED - SGX
←
→
Page content transcription
If your browser does not render page correctly, please read the page content below
KIMLY LIMITED

FY2019 AGM
CORPORATE
PRESENTATION
21 January 2020
CONTENTS Corporate Profile Strategy Recalibration Financial Highlights Outlook
CORPORATE PROFILE
Listed on 20th March 2017 on the SGX Catalist
Board, Kimly Limited is a leading and established
operator of coffeeshops, food courts and other
food outlets across Singapore, with a proven track
                                                                   KIMLY LIMITED
record of nearly 30 years.

Kimly operates a total of 70 food outlets under its
Outlet Management Division and 135 food stalls
under its Food Retail Division as at 26th November
2019.                                                 Outlet Management        Food Retail
                                                          Division              Division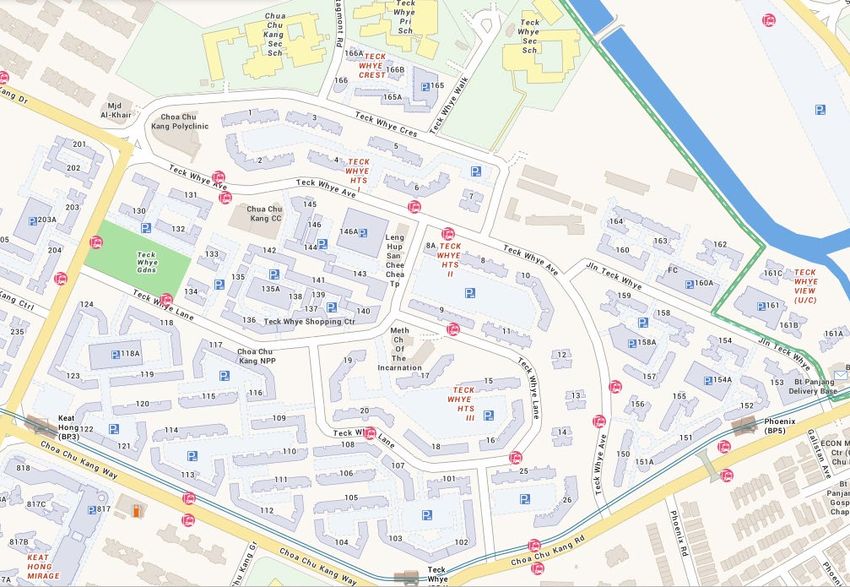
EXPANDING OUR FOOTPRINT

                                                     Mixed Vegetable   Seafood Zi Char
       Location          Type          Drink Stall                                       Dim Sum Stall   Kanaaji
                                                        Rice Stall          Stall

Blk 691, Woodlands   Awarded
Drive 73             under HDB
                     PQM
Blk 365, Sembawang   Awarded
Crescent             under HDB
                     PQM
Blk 322, Sumang      Awarded
Walk                 under HDB
                     PQM
Blk 143, Teck Whye   Acquisition
Lane

Blk 106, Bidadari    Managing      Under 3rd party
Park Drive           Agent         brand

Flavors @ U-Town     Awarded
                     new lease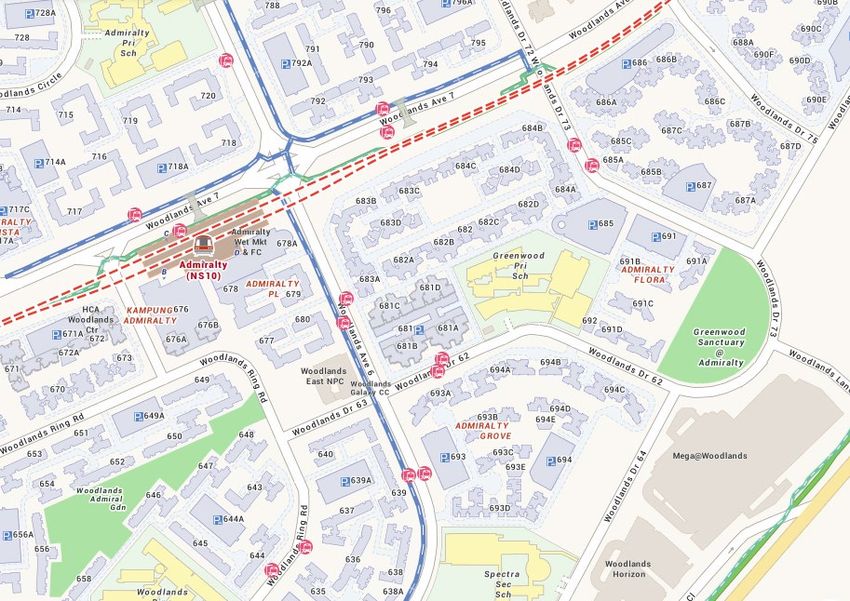
STRATEGY RECALIBRATION

                                 Asset Ownership
    Asset
  ownership
                         • Direct ownership to enlarge revenue
                          streams.
                         • Maximizing Central Kitchen’s
                          capabilities with Food Retail expansion.
                         • Stability of Food Retail businesses
                          through long term leases.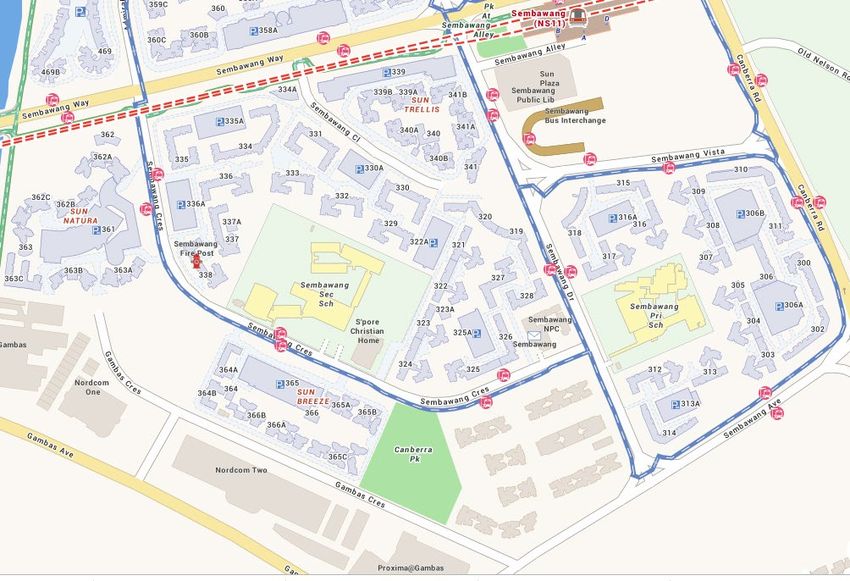
STRATEGY RECALIBRATION

Rationale of Asset Ownership
• To further expand the Group’s network of food outlets
• To establish new food outlets and food stalls as and
  when strategic locations become available
• Enable the Group to mitigate uncertainty surrounding
  its private leases, which can be influenced by market
  competition
STRATEGY RECALIBRATION
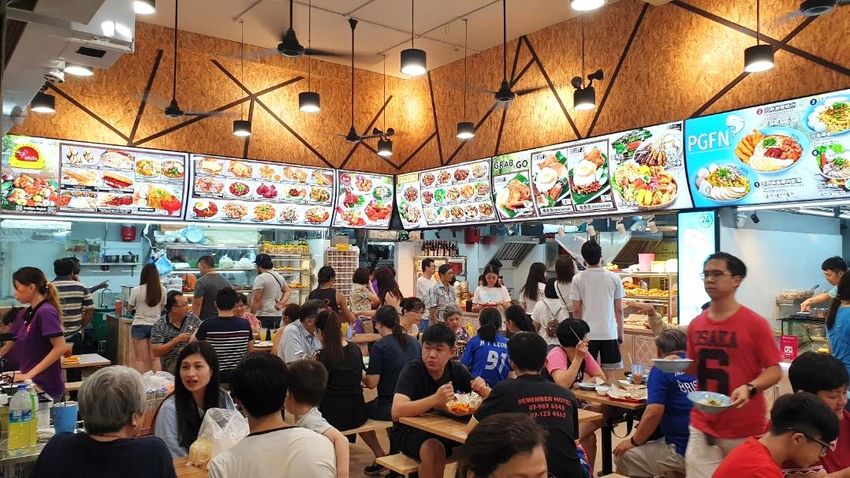
Newly-acquired coffeeshop: Blk 143, Teck Whye Lane
Acquisition
S$14.0 million
Consideration
Teck Whye Neighborhood Centre
Net Floor Area 224 sqm
Opening Date In Operations
Food Retail Dim Sum Stall and Mixed Vegetable
Blk 143 Teck Whye Lane
Division Rice Stall
Densely Populated Matured Housing
Estate, Schools and Private
Characteristics residential clusters. Served by 3 LRT
stations. Teck Whye LRT Station
Keat Hong LRT Station
Phoenix LRT Station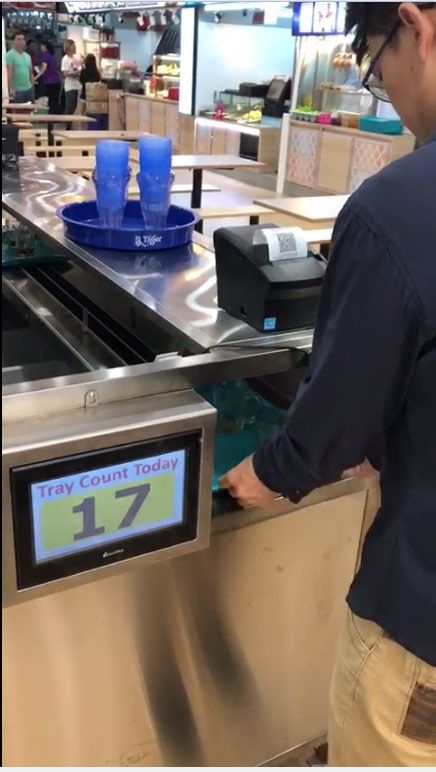
STRATEGY RECALIBRATION
Newly-acquired coffeeshop: Blk 143, Teck Whye Lane

STRATEGY RECALIBRATION
Further enlarging our footprints
* Non-binding term sheet between Jin Wei Holdings Pte. Ltd. and several
vendors for the acquisition of a portfolio of coffeeshop leases,
coffeeshop units and industrial canteen units
     Target Properties comprises:
     •Four long term leasehold coffeeshop properties units, which are HDB commercial
      units located within mature HDB estates;

     •Three freehold industrial canteen units, which are located in mature and populated
      industrial areas in close proximity to residential areas; and

     •Three short term coffeeshop leases, which are HDB direct leases, located within
      mature and populated HDB residential areas (The acquisition by the Group of
      interests in the entities holding the HDB leases for the three coffeeshop properties
      does not constitute an assignment of tenancy).

 *Please refer to the Group’s announcement released on 22 October 2019 for more information.
OUTLET MANAGEMENT DIVISION
  AWARDED UNDER HDB PQM: Blk 691, Woodlands Drive 73

Opening Date           In Operations

                       Seafood Zi Char Stall and Mixed
Food Retail Division   Vegetable Rice stall.
                                                                 Blk 691,
                                                                 Woodlands Dr 73

                       Matured Housing Estate, established
                       footfall, close proximity to industrial
Characteristics        parks. More new housing estates are
                       being constructed in close proximity.
OUTLET MANAGEMENT DIVISION AWARDED UNDER HDB PQM: Blk 691, Woodlands Drive 73
OUTLET MANAGEMENT DIVISION

      AWARDED UNDER HDB PQM: Blk 365, Sembawang Crescent

Opening Date           In Operations

                       Dim Sum stall and Mixed Vegetable
Food Retail Division   Rice stall.

                       Combination of a new and matured
Characteristics        Housing Estate, near schools, close
                       proximity to industrial parks.
                                                             Blk 365, Sembawang Crescent
OUTLET MANAGEMENT DIVISION AWARDED UNDER HDB PQM: Blk 365, Sembawang Crescent
OUTLET MANAGEMENT DIVISION

        AWARDED UNDER HDB PQM: Blk 322, Sumang Walk

Opening Date      In Operations

Food Retail       Dim Sum stall and Mixed Vegetable
Division          Rice stall.
                                                        Blk 322, Sumang Walk

                  Right beside park connector, highly
                  populated Schools and
                  Condominiums. Served by 2 LRT
Characteristics   and 1 MRT stations. Limited F&B
                  establishments in Sumang, Punggol
                  estates.
OUTLET MANAGEMENT DIVISION
Progressing with time
Enhancing Tray Return Reward System
Customers will return used cutlery and crockery to collection
device located at a convenient area within the food outlet
Reward: QR code for discount at food stall (synchronised with
POS system to allow monitoring)
Workload for cleaners and food outlet staff is reduced
Cashless Payment at Bukit Batok Blk 292, U-Town, Jurong
West Blk 651
Convenient alternative cashless payment methods, staying
relevant to our younger customers who are more familiar with
such cashless payment methods
More than 50% of transactions are made through cashless
payment options at Flavors@U-Town’s drinks stall.OUTLET MANAGEMENT DIVISION
Progressing with time
Launch of New Improved Taste of our Traditional Kopi &
Teh Peng!
Cater to consumers’ preference
Traditional Kopi
and Teh Peng
Can DrinksOUTLET MANAGEMENT DIVISION
Progressing with time: Flavours @ University Town, NUS
IN OPERATIONS
Estimated
(Asset enhancement done in
Opening Date 2019)
Drinks stall, Kanaagi Japanese
Food Retail
food stall, Mixed Vegetable Rice
Division stall
Serves a large captive population F l a v o r s @ U- T ow n
in University Town. Close
proximity to student
Characteristics accommodation. Anchored by
heritage hawker, Tian Tian
Chicken Rice from Maxwell.OUTLET MANAGEMENT DIVISION Progressing with time: Flavours @ University Town, NUS
FOOD RETAIL DIVISION
 Seafood “Zi Char” Stalls
Harnessing the strengths of our Central Kitchen and IT capabilities
to improve productivity

Increase number                                                     Reduced
    of semi-            Better           Tablet ordering         workload for    Central Kitchen
 finished food      consistency in         + Food pager         stall workers,     increase in
items prepared       food quality          system + POS        reduce reliance    productivity
  at central                             system + HQ ERP          on highly-     with machinery
    kitchen                                                     skilled chefs
FOOD RETAIL DIVISION Mixed Vegetable Rice Stalls Harnessing the strengths of our Central Kitchen and IT capabilities to improve productivity Replacing manual repetitive low value work with the help of food processing machines. Increased productivity Improved quality and consistency control Improve revenue per worker contribution Cost savings through bulk purchase
FOOD RETAIL DIVISION
Mixed Vegetable Rice Stalls
Harnessing the strengths of our Central Kitchen and IT capabilities to improve
productivity
Implementation of Combi-Oven
Automation of several cooking processes Automation of several
cooking processes
Freeing up precious time so our frontline staff
can do more higher value work, eg: improving
customer service and hygiene management Reduced man-hour
requirements for food
Reduced man-hour requirements for food preparation
preparation
Energy-saving and heat reduction capabilities
to make work environment more conducive to Implementation of
attract more seniors to join our industry Combi-OvenFOOD RETAIL DIVISION
Dim Sum Stalls
Harnessing the strengths of our Central Kitchen and IT
capabilities to improve productivity
• The Group continues to devise new attractive products catering to changing consumer preferences.
Target
Incentive
Program to
Increased improve
Strong
reach of sales
response
online
from
Newest delivery
customers
product in footprint
Dim Sum
menu
Bak Kwa
PauFINANCIAL HIGHLIGHTS
FY2019 Revenue
S$208.3 m
REVENUE BY BUSINESS SEGMENT (S$’M)
3.0% / S$6.1 m y-o-y
202.2
208.3 Outlet Management
80.9
192.1 88.6
97.2
S$111.1 m
172.2
74.6
2.2% / S$2.5 m y-o-y
46.7%
43.8% - Due mainly to cessation of
42.1%
43.4% operation of a coffeeshop
113.6
97.6
111.2 111.1
Food Retail
S$97.2 m
56.2% 53.3%
56.6% 57.9% 8.8% / S$8.6 m y-o-y
- Due mainly to revenue
contribution from new
FY2016 FY2017 FY2018 FY2019 businesses (Tonkichi and
Outlet Management Division Food Retail Division Rive Gauche) and
delivery salesFINANCIAL HIGHLIGHTS
PROFITABILITY
Gross Profit (S$’m) & EBITDA (S$’M) & EBITDA MARGIN (%)
Gross Profit Margin (%) 27.5 27.1 27.4 20.00%
45
27.0 26.0
40.2 40.7 16.0%
40 37.2 38.4 14.1% 16.00%
21.6% 20.0%
23.0
13.6%
19.9%
35
19.5% 12.5%
12.00%
19.0
30
25 15.0 8.00%
20
11.0 4.00%
15
10 7.0 0.00%
FY2016 FY2017 FY2018 FY2019 FY2016 FY2017 FY2018 FY2019
Gross Profit Gross Profit Margin EBITDA EBITDA MarginFINANCIAL HIGHLIGHTS
NET PROFIT AFTER TAX (S$’M)
30 16.0% NPAT
25 24.2
14.1% 14.0% S$20.1 m
21.4 21.9 12.0% 8.4% / S$1.8 m y-o-y
20.1
20
10.0%
- The increase in gross profit of
11.2%
10.8% $0.5 mil was affected by higher
15 9.6%8.0%
6.0%
selling and distribution expense,
administrative expense and
10
4.0%
5 income tax expense.
2.0%
0 0.0%
FY2016 FY2017 FY2018 FY2019
NPAT Net Profit MarginFINANCIAL HIGHLIGHTS
PBT (S$’M) & PROFIT MARGIN (%) BY BUSINESS SEGMENT
11.8
12
10.9
11.5 Outlet Management
10.4
11.2% 10.6%
S$10.4 m
10.2%
8
9.4% 11.0% / S$1.1 m y-o-y
8.00% - Due mainly to
continued pressure
4
on rents and payroll
costs
gestation period for
0 0.00%
new outlets located
FY2016 FY2017 FY2018 FY2019 in new precincts.
Profit Before Tax Profit MarginFINANCIAL HIGHLIGHTS
PBT (S$’M) & PROFIT MARGIN (%) BY BUSINESS SEGMENT
21.2% 19.7%
22.2% 19.2
19.0
18.8
18.0
20.7% Food Retail
15.5
21.00%
S$19.2 m
15.0 2.2% / S$0.4 m y-o-y
Lower profit margin due to:
13.00% Continued pressure on
11.0 ingredients and payroll costs
restaurant and confectionery
business have a lower profit
7.0 5.00% margin
FY2016 FY2017 FY2018 FY2019
Profit Before Tax Net Profit MarginFINANCIAL HIGHLIGHTS
Sep 2019 Cash and cash equivalents
CASH GENERATIVE BUSINESS LEADING TO S$87.2 m
STRONG OPERATING CASH FLOW
Net Cash Generated From Operating Activities (S$’M) Sep 2019 Net cash
36.0
36.4 S$53.9 m
32.0
28.4 29.0 FY2019 net cash generated from operating
28.0
activities
24.0
S$36.4 m
20.0
16.0
12.0
7.2 Lower net cash generated from operating activities in
8.0
FY2018 due to consideration receivable of $16.0 m
4.0 pursuant to the Rescission.
0.0
FY2016 FY2017 FY2018 FY2019FINANCIAL HIGHLIGHTS
DIVIDENDS DIVIDENDS
FY2018 FY2019 Total of 1.40 SG cents per
Total of 0.96 SG cent ordinary share
per ordinary share
Interim
Interim
Dividend
50.7% payout ratio Dividend 80.2% payout ratio
0.28 4.36% dividend yield 0.56 6.0% dividend yield
Singapore cent Singapore cent
per share, paid per share,
in May 2018 paid in July
2019
Final Dividend Final Dividend
0.68
(subject to approval)
Singapore cent
per share, paid in
February 2018
0.84
Singapore cent per share,
payment date TBAOUTLOOK
Expansion of footprint in mature
Recalibration of corporate
and populated estates with Barring unforeseen
strategy and leveraging on
established footfalls, growing of circumstances, the Group expects
improved central kitchen and
market presence and standing as to continue to be profitable in the
supply chain functions to pursue
one of the leading F&B operators financial year ahead
asset ownership
in SingaporeYou can also read