TURKISH INSURANCE MARKET OVERVIEW & STRUCTURE COOPERATE GOVERNANCE AND INTERNAL SYSTEMS - And Dilek SAKALLIOĞLU Senior Insurance Supervisor TOKYO ...
←
→
Page content transcription
If your browser does not render page correctly, please read the page content below

TURKISH INSURANCE MARKET
      OVERVIEW & STRUCTURE
               And
   COOPERATE GOVERNANCE AND
        INTERNAL SYSTEMS

   Dilek SAKALLIOĞLU
Senior Insurance Supervisor

  TOKYO – Octaber, 2017

                               1
TURKISH INSURANCE MARKET
  OVERVIEW & STRUCTURE

                       2
Industry Structure and Recent Trends
Premium Volume and Coverage
The Turkish insurance sector is a growing part of the country’s financial services
industry. In 2016, the insurance sector comprised about 4% of all financial
services sector assets
In 2016, Insurance sector achieved 40.5 billion TL gross premium (35 billion non
– life) and realized an increase by 30% in nominal term and 20% in real terms.
(Milyon ₺) 2012 2013 2014 2015 2016
Premium Income
Non Life Premium 17.118 20.832 22.711 27.296 35.450
Life Premium 2.710 3.395 3.280 3.761 5.039
Total Premium 19.829 24.227 25.991 31.056 40.488
Non Life Share (%) 86,33 85,99 87,38 87,89 87,55
Life Share (%) 13,67 14,01 12,62 12,11 12,45
Insurance Coverage
Non Life Coverage 49.326.172 62.334.348 75.961.929 85.389.071 89.115.156
Life Coverage 387.781 485.712 564.914 670.804 746.487
Total Coverage 49.713.953 62.820.060 76.526.843 86.059.874 89.861.644
3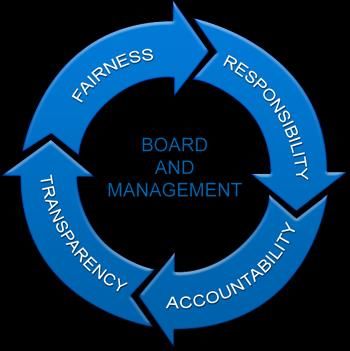
Industry Structure and Recent Trends
The Turkish market is dominated by the non-life sector which accounts for
more than 87 percent of premiums.
20.3 18.0 15.9 14.3 12.2 13.4 14.7 15.4 15.6 13.7 14.0 12.6 12.1 12.45
79.8 82.0 84.1 85.7 87.8 86.6 85.4 84.6 84.4 86.3 86.0 87.4 87.9 87.6
1 2 3 4 5 6 7 8 9 10 11 12 13 14
系列1 系列2
Insurance penetration remains low compared to OECD and EU, however, and in
combination with growing per capita income, is fueling industry expectations of
long term sector growth.
4
Industry Structure and Recent Trends
Gross Domestic Premium and Pension Fund Versus GDP
The Turkish insurance sector is a growing part of the country’s financial services
industry. In 2016, it takes about 4.2 percent of GDP and share in financial sector
has been increasing gradually.
3.00
2.46 2.53
2.50 2.29
2.00 1.37 1.68
1.50 1.69
1.55
1.43 1.51 1.45
1.00
0.50 0.20 0.16
0.14 0.12 0.10
0.00
系列1 系列2 系列3
5
Industry Structure and Recent Trends
Number of Companies
There are 61 authorized insurers operating in Turkey.
37 non-life insurers
18 life and pension companies
4 pure life insurers
2 reinsurers (Milli Re, VHV Re)
Most of insurers are joint stock companies, there are two mutual insurers.
International participation is very strong in the industry .
27 non-life insurers, 17 life insurers and 1 reinsurers have foreign capital
participation.
Foreign groups’ market shares are 65% (EU origin groups have a 50%).
Four Islamic banks have ownership linkages with insurers and interest in
the market for Takaful products.
6
Industry Structure and Recent Trends
Market share of top 10 companies is 75% in Non-life business.
Market share of top 10 companies is 82% in Life business
Non-life Sector - as percentage of total Life Sector - as percentage of total
premiums (%) premiums (%)
1 Allianz Sigorta AŞ 16.83 1 Ziraat Hayat Emeklilik AŞ 17.58
2 Anadolu Anonim Türk Sigorta Şirketi 13.06 2 Acıbadem Sağlık ve Hayat Sigorta AŞ 12.00
3 Axa Sigorta AŞ 10.38 3 Anadolu Hayat ve Emeklilik AŞ 8.13
4 Mapfre Sigorta AŞ 8.14 4 Metlife Emeklilik ve Hayat AŞ 7.74
5 Sompo Japan Sigorta AŞ 6.52 5 Allianz Yaşam ve Emeklilik AŞ 7.41
6 Aksigorta AŞ 5.52 6 Garanti Emeklilik ve Hayat AŞ 6.65
7 Güneş Sigorta AŞ 4.00 7 Halk Hayat ve Emeklilik AŞ 6.43
8 Ziraat Sigorta AŞ 3.90 8 Vakıf Emeklilik AŞ 6.07
9 Eureko Sigorta AŞ 3.60 9 AvivaSa Emeklilik ve Hayat AŞ 5.15
10 Groupama Sigorta AŞ 3.35 10 Cigna Finans Emeklilik ve Hayat AŞ 4.89
7
Industry Structure and Recent Trends in Non - life Insurance
Motor insurance accounts for approximately 55 percent,
Property insurance accounts for approximately 25 percent,
Construction and engineering insurance accounts for approximately 4 percent,
Personal Accident and Healthcare Insurance account for close to 16 percent of
premiums.
Non – Life premium shares in total Groos Written Premium
2.8
9.1 11.7
2.3
4.1
17.7 1 2 3 4 5 6 7 8 9
37.3 1.6
13.4
8
Industry Structure and Recent Trends
The Source of Premium Production
In 2016, there were 15,600 licensed insurance agents and 144 insurance
brokers
Insurance policies are distributed mainly through licensed agents and brokers,
banks, and direct sales. In Turkey, private insurance agents have a significant
weight in distribution channels.
They produced 61.5% of total premium in 2016 while banking agencies and
brokers had a share of 22.4% and 10.5%, respectively. 4.3% of total premium
was generated by the companies on their own.
1.24 4.12 1.43 1.99
11.78 5.88
6.27
1 2 3 1 2 3
13.46
4 5
4 5
69.40
Non- Life
Life 84.43
2016 (%)
2016 (%)
9
Industry Structure and Recent Trends
Life Insurance
The life sector makes up 12 percent of gross premiums.
In life sector premiums ; 100 8.0 6.6
11.3
5.7
7.3
5.6
6.6
3.8
5.2
10.1
80
Term life products 91 percent, 60
系列3 系列2
Whole life 5 percent, 40 81.9 82.1 87.0 87.8 91.0
Group term life is 75 percent, 20 系列1
Individual whole life 10 percent, 0
86 percent of life production from credit life policies (casco, property).
100 14.1
16.2 16.8 15.5 17.1
80
60
系列2 系列1
83.8 83.2 84.5 82.9 85.9
40
20
0
10Industry Structure and Recent Trends – Pension System
State contribution 25%
Automatic participation system from January 2017
6.7 million participants as of September 2017
As of September 2017; 63.3 billion funds and 9.4 billion state contribution
11Industry Indicators and Solvency Position
Distribution of Total Assets of Insurance, Reinsurance and
Pension Companies (%) Total assets increased by
3.4 2.9 2.5 2.7 2.4
Reinsurance Co.
24 percent comparing
60.6 59.3 62.7 62.8 62.6
with the previous year
Life / Pension Co. (from 98 billion in 2015
37.8
36.0 34.8 34.5 35.0
to 122 billion in 2016)
Non-Life Co.
2.4 3.3 4.3 4.5 5.5
100
17.7
18.7 18.8 19.7 17.5
80 4.5 2.5 3.0 2.5
3.0
系列4 系列3
Type of investments
60
75.4 75.5 74.0 72.8 74.5
系列2 系列1
40
20
12Industry Indicators and Solvency Position
Distribution of Total Assets
3.30
3.27
9.57
26.00
1 2 3 4 5
57.86
2.05
12.49
1 2 3 4
29.74 55.84
Distribution of Liabilities
13Industry Indicators and Solvency Position
Non-life, Life &Pension Companies – Solvency ratios (%)
450.00
400.00
350.00 386.91 356.56
352.83
300.00
250.00
200.00 Non Life Companies
150.00 136.40
120.39 Life/Pension Companies
100.00
50.00
106.20
0.00
2014 2015 2016
Non-life, Life &Pension Companies – Assets covering technical reserves (%)
180.00 156.98
155.30
160.00 150.15
140.00
120.00 系列1
129.03 124.93
100.00 121.15
80.00 系列2
60.00
40.00
20.00
0.00
1 2 3
14Industry Indicators and Solvency Position
Technical Profitibality
Non-Life Companies
100
75.35 78.42 69.37 79.57
74.54 74.25
80 69.76
68.95 70.23 68.57
65.06 67.25 65.05
63.18
60
40
25.55 26.19 26.24 25.12 24.26
22.35 21.81 21.51 21.17 21.99 22.28 23.17 22.56 21.28
20
4.33 7.26 2.35 4.38 0.03 4.10 4.68 5.09
0.47 2.58 1.16 0.42
-3.53 -1.79
0
-20
Loss Ratio Expenses Ratio Technical Profitability Ratio
15Industry Indicators and Solvency Position
Technical Profitibality
Life &Pension Companies
120
105.96
87.42
100
87.48 85.66
78.59
75.44
80 71.07
64.74 64.52 69.46 65.33 67.24
58.59
60 52.26
27.84
40 31.10 33.22 33.48 31.50
25.77 26.06 26.39 27.91 27.39 30.12
19.28 25.46
16.77 15.44
12.07 14.20 15.75
20
3.87 5.27 6.32 8.55
18.22 3.34 3.88
16.36
8.68 12.46
0
Loss Ratio Expenses Ratio Technical Profitability Ratio
16Industry Indicators and Solvency Position
Return on assets - ROA
12
11.2
10
8 6.3 7.1 5.9 8.0
4.7 4.9 7.1
6 4.9 4.7 4.2 3.7
3.1 3.4
4 2.8 2.2 1.7
4.4 4.7 2.9
2 0.4 2.9 3.4
1.7 2.0 -0.7
0 -1.5
-2 -3.3
-4
-6
Non Life Companies Life/Pension Companies
Return on equities - ROE
50 45.5 37.7
40
24.0 26.8 27.2 25.1 26.7
30 24.2
21.0 19.6 18.9
14.3 12.6 16.5
20 17.5
20.2 15.2
10 26.8 4.5 12.0
9.1 10.1 3.6 1.2 14.7
-2.0
0
-5.5
-10
-10.4
-20
系列1 系列2
17Industry Structure and Recent Trends
The market is characterized by several insurance products that are compulsory
for consumers. (e.g. earthquake insurance, and motor third party liability)
Compulsory Insurance Products
1. Motor third party liability for bodily injury and property
10. Professional liability cover for tour operators.
damage.
11. Medical malpractice insurance for doctors and
2. Earthquake insurance on private dwellings.
dentists.
3. Third party liability for bodily injury and medical
12. Professional indemnity insurance for independent
expenses for passengers on intercity and international
auditors
transport.
4. Third party liability for passengers on vessels 13. Sea pollution liability for companies situated near the
registered to carry 12 or more passengers. shoreline
5. Personal accident cover for intercity coach
14. Public liability insurance for private security guards.
passengers.
15. Third party legal liability and passenger liability for
6. Personal accident cover for miners.
aircraft.
7. Professional indemnity insurance for companies 16. Insurance of goods that are subject to finance
providing professional services to banks. leasing.
8. Liability of companies engaged in the production, 17. Professional indemnity insurance for electronic
storage, and handling of LPG cylinders. signature certificate providers.
9. Liability insurance for companies engaged in the
production, storage, transport, and sale of combustible,
explosive or flammable materials.
18Risks and Vulnerabilities Turkey is a country that is integrated with the global financial markets and attracting foreign capital intensively. As a result, the global risks have effects on Turkish Insurance Sector. Republic of Turkey Prime Ministry Undersecretariat of Treasury has been regulating the market in order to eliminate these risks and also minimize their effects. Risks: - Long Tail Liabilities - Natural Catastrophes - Longevity
Risks and Vulnerabilities Long Tail Liabilities Uncertainty about claims and litigation is one of the main risks for the sector. With the modifications on compulsory motor third party liability (MTPL) insurance general requirements (terms&conditions), steps were taken in order to make the pricing more effective in which companies make a loss for a long time. Natural Catastrophes The fact that earthquake has been the most experienced disaster in the last 60 years in Turkey is not a coincidence since almost all of our country is within an earthquake region (nearly 90%). Moreover, this type of earthquake is not only able to affect the region, but also the country's economy, as well. Supporting the insurance operations with events aimed at increasing public awareness, Natural Disaster Insurance Institution and Turkish Catastrophe Insurance Pool (TCIP) highlights that Compulsory Earthquake Insurance is primary social responsibility. TCIP has 136 billion Euro coverage capacity for earthquake losses in Turkey.
Risks and Vulnerabilities
Longevity
Aging population is now a problem for Turkey. This phenomenon
has also results such as increase in care and health needs.
In this respect, Turkish Treasury and insurance companies are
working collaboratively and attention is paid to awareness of
pension.
The regulation on annuity products have been fulfilled and the work
on special public instruments for companies which will sell these
products in order to manage investment risks is under way.COOPERATE GOVERNANCE and
INTERNAL SYSTEMS
221- What are the cooperate governance and internal systems?
Cooperate Governance:
The framework of rules and practices by which a board of directors
ensures
accountability,
fairness,
responsibility and
transparency
in a company's relationship with its all stakeholders (financiers,
customers, management, employees, government, and the community).
23Internal Systems:
Internal systems are divided into three groups. These
are internal control, internal supervision and risk
management
Internal Control: The objective of the internal control
system is to
ensure the protection of company’s assets,
effective and productive performance of activities in
accordance with the laws and other relevant legislations,
company policies and rules and insurance practices,
reliability of accounting and financial reporting system
and timely availability of information
24 Risk Management: Risk management is definition,
measurement and analysis of the risks exposed by the
company based on separate activities and across the
company.
Effective risk management processes should define the
risks and set forth what the required controls are and how
the risks will be managed.
Internal Supervision: The objective of the internal
supervision system is to assure the senior management
that the company activities are carried out in line with the
laws and other relevant regulation in addition to the
company strategies, policies, principles and targets and
that internal control and risk management systems are
effective and efficient.
252- Why these terms are very important?
After the Enron and WorldCom accounting scandals in USA, it is
understood the importance of more controlled and lung running
management.
The new management mentality is meaning that the board of
directors doesn’t manage the company independently from
stakeholders, employees, customers and the community or by their
own rules. This new management system necessitates strong
internal systems.
26 The board of directors assumes
the final responsibility for the creation of
internal systems and their effective,
sufficient and compliant operation,
protecting the information obtained from
accounting and financial reporting system
and
defining the authorizations and
responsibilities within the company.
27Expected topics in the GLOPAC Program are
listed as follows
1- Do Japanese regulations compel the board to
implement the cooperate governance principles
in the company?
2 – Are Japanese insurance companies required
to report information on their internal systems to
the Supervisory Authority, if they required doing
so, what kind of information/reports should be
submitted?
28 3 - Management risk is the effect of company
management style on company operations.
Therefore, management risk indirectly affects
the company's capital. However, it is very
difficult to measure these qualitative risks.
How kind of methods can be used to measure
management risk?
Are there any methods to measure the
management risk on capital adequacy for
Japanese insurance companies?
2930
You can also read