Scorpio Bulkers Inc. Q3 2020 Earnings October 27, 2020
←
→
Page content transcription
If your browser does not render page correctly, please read the page content below
Scorpio Bulkers Inc.
Q3 2020 Earnings
October 27, 2020
                       1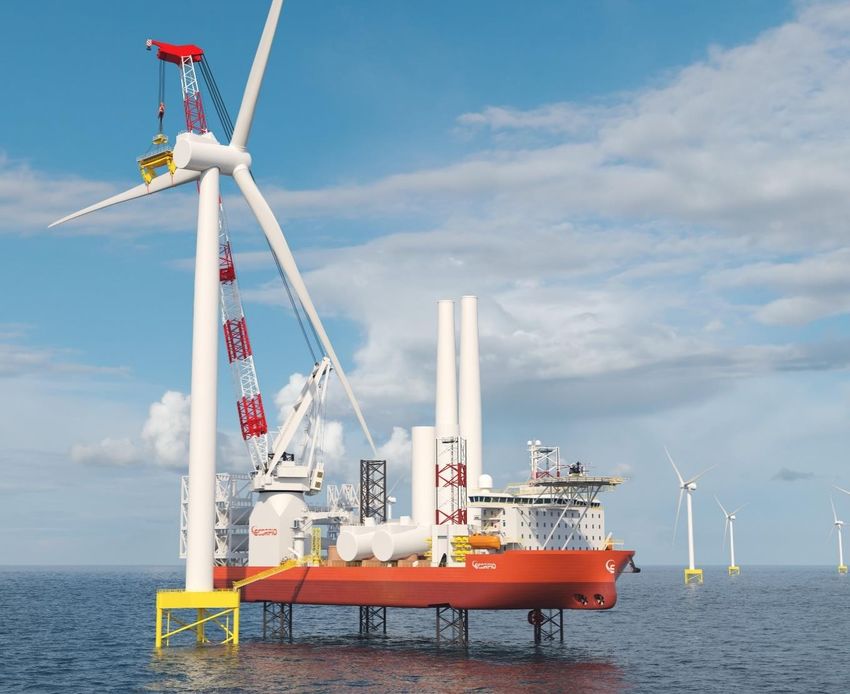
Disclaimer and Forward-looking Statements
This presentation includes “forward-looking statements” within the meaning of the safe harbor provisions of the United States Private Securities Litigation Reform Act of 1995. These
forward-looking statements reflect Scorpio Bulkers Inc.’s (“Scorpio’s”) current views with respect to future events and financial performance. The words “believe,” “anticipate,”
“intend,” “estimate,” “forecast,” “project,” “plan,” “potential,” “may,” “should,” “expect” and similar expressions identify forward-looking statements. The forward-looking
statements in this presentation are based upon various assumptions, many of which are based, in turn, upon further assumptions, including without limitation, management’s
examination of historical operating trends, data contained in Scorpio’s records and other data available from third parties. Although Scorpio believes that these assumptions were
reasonable when made, because these assumptions are inherently subject to significant uncertainties and contingencies which are difficult or impossible to predict and are beyond
Scorpio’s control, Scorpio cannot assure you that it will achieve or accomplish these expectations, beliefs, projections or future financial performance.

Risks and uncertainties include, but are not limited to, the failure of counterparties to fully perform their contracts with Scorpio, the strength of world economies and currencies,
general market conditions, including fluctuations in charter hire rates and vessel values, changes in demand in the bulk carrier markets, changes in Scorpio’s operating expenses,
including bunker prices, drydocking and insurance costs, the fuel efficiency of our vessels, the market for Scorpio's vessels, availability of financing and refinancing, charter
counterparty performance, ability to obtain financing and comply with covenants in such financing arrangements, changes in governmental and environmental rules and regulations
or actions taken by regulatory authorities including those that may limit the commercial useful lives of bulk carriers, potential liability from pending or future litigation, general
domestic and international political conditions, potential disruption of shipping routes due to accidents or political events, and other important factors described from time to time
in the reports Scorpio files with, or furnishes to, the Securities and Exchange Commission, or the Commission, and the New York Stock Exchange, or NYSE. Scorpio undertakes no
obligation to update or revise any forward-looking statements. These forward-looking statements are not guarantees of Scorpio's future performance, and actual results and future
developments may vary materially from those projected in the forward-looking statements.

Earnings before interest, taxes, depreciation and amortization (“EBITDA”), earnings before interest and taxes (“EBIT”), adjusted net income and related per share amounts, as well
as adjusted EBITDA, adjusted EBIT and TCE Revenue are non-GAAP performance measures that the Company believes provide investors with a means of evaluating and understanding
how the Company’s management evaluates the Company’s operating performance. These non-GAAP financial measures should not be considered in isolation from, as substitutes for,
nor superior to financial measures prepared in accordance with GAAP.

Unless otherwise indicated, information contained in this presentation concerning Scorpio’s industry and the market in which it operates and expects to operate, including its general
expectations about its industry, market position, market opportunity and market size, is based on data from various sources including internal data and estimates as well as third
party sources widely available to the public such as independent industry publications, government publications, reports by market research firms or other published independent
sources. Internal data and estimates are based upon this information as well as information obtained from trade and business organizations and other contacts in the markets in
which Scorpio operates and management’s understanding of industry conditions. This information, data and estimates involve a number of assumptions and limitations, are subject to
risks and uncertainties, and are subject to change based on various factors, including those discussed above. You are cautioned not to give undue weight to such information, data
and estimates. While Scorpio believes the market and industry information included in this presentation to be generally reliable, it has not independently verified any third-party
information or verified that more recent information is not available.

                                                                                                                                                                                         2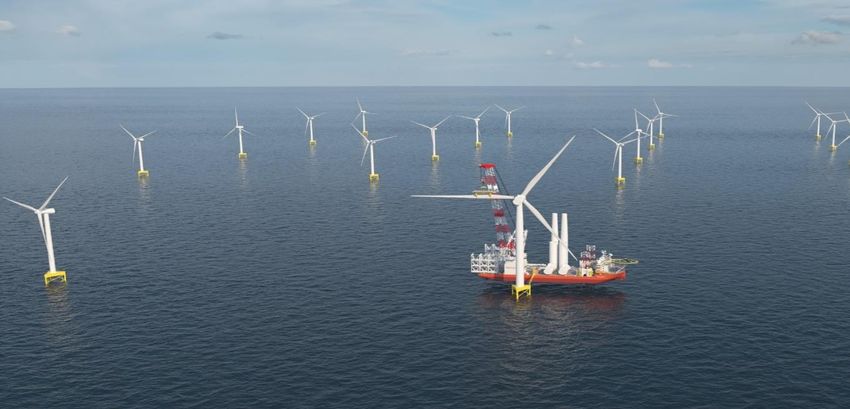
Corporate & Financial Highlights
Q3 20 Financial   •   GAAP Net Loss of $36.6 million / Loss per Share of $3.12
Results               • a loss of approximately $3.7 million and cash dividend income of $0.2 million, or $0.30 per diluted share, from the Company’s
                        equity investment in Scorpio Tankers Inc. and a write-down of $19.6 million, or $1.67 per diluted share, related to the
                        classification of SBI Rock as held for sale and the agreement to sell the SBI Sousta
                  •   Adjusted Net Loss of $17.0 million / Adjusted Loss per Share of $1.45 excluding the $19.6 million write-down of the SBI Rock and SBI
                      Sousta
                  •   Earnings before Interest, Depreciation and Amortization (EBITDA) of a loss of $13.9 million and Adjusted EBITDA of $5.7 million and
                      cash flow used in operations of $12.6 million
                  •   Share and per share results included herein have been retroactively adjusted to reflect the one-for-ten reverse stock split of the
                      Company’s common shares, which took effect on April 7, 2020
TCE               •   Average Ultramax TCE of $8,930 per day in Q3 2020
                  •   Average Ultramax TCE of $11,226 per day booked to date in Q4 2020
                  •   Average Kamsarmax TCE of $10,142 per day in Q3 2020
                  •   Average Kamsarmax TCE of $12,740 per day booked to date in Q4 2020
Liquidity         •   As of October 26, 2020, the Company had cash and cash equivalents of approximately $105.5 million

Vessel Sales      •   Agreed to sell 3 Kamsarmax vessels and 5 Ultramax vessels for a total sales price of $143.3 million.
                  •   The sales are expected to generate approximately $40.3 million in additional liquidity
                  •   Recorded a loss of $19.6 million in Q3 2020 and is expected to recorded a loss of approximately $45.2 million in Q4 2020
                  •   Deferred finance charges of approximately are expected to be written-off in Q4 2020
Dividend          •   The Company’s Board of Directors declared a dividend of $0.05 per share on October 27, 2020

                                                                                                                                                             3
Historical TCE Rates
$16,000
$14,000
$12,000
$10,000
$8,000
$6,000
$4,000
$2,000
$0
Q1 18 Q2 18 Q3 18 Q4 18 Q1 19 Q2 19 Q3 19 Q4 19 Q1 20 Q2 20 Q3 20 Q4 20*
Kamsarmax Ultramax
* Projections based on 45% and 42% of the days for the Ultramax and Kamsarmax fleet, respectively as of October 23, 2020
4Financial Performance Summary
REVENUE ADJUSTED EBITDA
$80 $70.0 $66.7
$80
$60
$65.2 $28.1
$62.5 $63.2 $23.3 $32.8
$60.6 $60.3 $40 $28.8 $26.1
$60 $54.3 $20.4
$50.4 $50.6 $20 $5.7
$46.7
$40.8 $0
$40
-$20
$26.2 -$20.6
-$40
$20
-$60
-$80
$0 -$100 -$83.1
Q1 18 Q2 18 Q3 18 Q4 18 Q1 19 Q2 19 Q3 19 Q4 19 Q1 20 Q2 20 Q3 20 Q1 18 Q2 18 Q3 18 Q4 18 Q1 19 Q2 19 Q3 19 Q4 19 Q1 20 Q2 20 Q3 20
OPERATING CASH FLOW ADJUSTED EBIT
$35 $60 $50.9 $49.8
$21.1 $40
$18.6 $19.6 $18.9 $15.5
$20 $10.6 $9.4 $8.7
$11.2 $2.9 $3.5
$11.1
$0
$4.5
-$20 -$10.7
$0
-$40
-$0.7 -$36.3
-$60
-$13.8 -$12.6 -$80
-$21.3 -$100
-$98.5
-$35 -$120
Q1 18 Q2 18 Q3 18 Q4 18 Q1 19 Q2 19 Q3 19 Q4 19 Q1 20 Q2 20 Q3 20 Q1 18 Q2 18 Q3 18 Q4 18 Q1 19 Q2 19 Q3 19 Q4 19 Q1 20 Q2 20 Q3 20
5Vessel Sales
Vessel Name Vessel Type Year Built Sales Price Related Debt Credit Facility Expected Delivery Date
SBI Rock (1)(2) Kamsarmax 2016 $18,030 $6,015 $184.0 Million Delivered October 2020
SBI Sousta Kamsarmax 2016 $18,435 $12,684 $184.0 Million Q4 2020
SBI Conga (2) Kamsarmax 2015 $18,400 $12,009 $184.0 Million Q4 2020
SBI Phoenix (2) Ultramax 2017 $17,000 $12,313 $90.0 Million Q4 2020
SBI Samson (1)(2) Ultramax 2017 $17,000 $12,313 $90.0 Million Delivered October 2020
SBI Hera Ultramax 2016 $18,460 $12,759 $184.0 Million Q4 2020
SBI Zeus Ultramax 2016 $18,500 $12,759 $184.0 Million Q4 2020
SBI Hyperion Ultramax 2016 $17,500 $12,313 $90.0 Million Q4 2020
(1) The sale of the SBI Rock and SBI Samson have been completed as of October 26, 2020.
(2) Related debt has been repaid between October 1, 2020 and October 26, 2020.
Write-downs totaling approximately $19.6 million was recorded in Q3 02020 related to the classification of the SBI Rock as held for sale and the agreement to sell the SBI Sousta.
Estimated write-downs totaling approximately $45.2 million is expected to be recorded in Q4 2020 a result of the sales of the SBI Conga, SBI Phoenix, SBI Samson, SBI Hera, SBI Zeus and SBI
Hyperion.
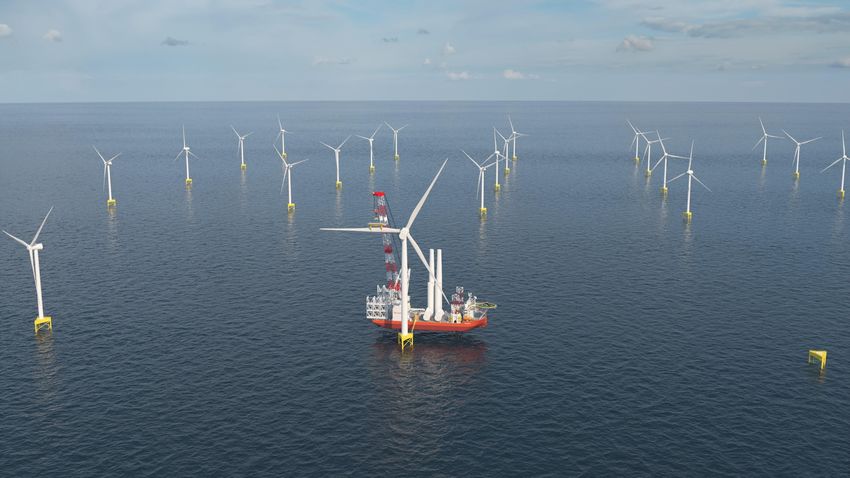
6Our Transition to Offshore Wind Continues
• Our transition continues, and our Scorpio WTIV Letter of Intent
conviction towards offshore wind is
validated constantly
• We are witnessing an unprecedented
alignment of scientific, political, and
commercial forces, leading to accelerated
plans around the world to develop wind
energy
• We expect to sign the contract for the
construction of our first wind turbine
• On August 4, 2020, the Company signed a Letter of Intent
installation vessel (“WTIV”) imminently,
“LOI” to construct a GustoMSC NG-16000X design WTIV
but other steps will follow
• The vessel will be built at DSME in Korea for delivery in
• We are re-tooling our organization and our 2023 and includes a 1500t Leg Encircling Crane (LEC) from
mission to deliver the service that our Huisman Equipment B.V. for a total cost of $280-$290
million and the contract will include options to construct
customers will require
up to an additional three units
7Overview of Scorpio’s Next Generation WTIV
WTIV Overview Scorpio WTIV
• WTIVs transport and install offshore wind turbines onto
pre-prepared foundations
• Larger WTIVs enable more efficient installation
• Greater carrying capacity- more turbines can be
transported at once
• Greater lifting capacity- a larger crane with more
‘hook height’
• Attributes that our customers care about:
• Variable load – what is the maximum weight that can
be ‘jacked up’?
• Deck space – how many towers, nacelles, and blades
can fit onboard?
• Water depth – in what water depth can the vessel
install a turbine?
• Crane hook height – how high can the crane reach?
• Crane capacity – how much weight can the crane lift?
• Environmental features – hybrid battery power, fuel
cell ready, and enhanced comfort and safety features
8The Global Offshore Wind Market Expected to Grow 7x by 2030
Global estimate 99 GW and 225 GW by 2025 & 2030, Offshore Wind in GW -Cumulative additions
respectively
• Siemens Gamesa estimate of 178 GW by 2030
• BNEF global offshore wind estimate of 183 GW by 2030
• Low estimates post 2027, especially for developing countries
• IRENA 228 GW and 1000 GW by 2030/2050 respectively
Europe
• CP expects 103 GW by 2030
• Equinor sees potential of 50-70 GW of European wind by 2030
• Wind Europe estimates 70-100 GW by 2030
China
• CP expects 67 GW by 2030
• BNEF estimates 44 GW by 2030
US
• CP expects 22 GW by 2030
• BNEF estimates 19 GW by 2030
• 4C Offshore estimates 12 GW by 2030
Source: Clarksons Platou AS, Clarksons Platou Securities AS. 9www.scorpiobulkers.com
10You can also read