Unilever First Half 2017 Results Paul Polman / Graeme Pitkethly 20th July 2017 - Presentation
←
→
Page content transcription
If your browser does not render page correctly, please read the page content below
Unilever First Half 2017 Results
Paul Polman / Graeme Pitkethly
20th July 2017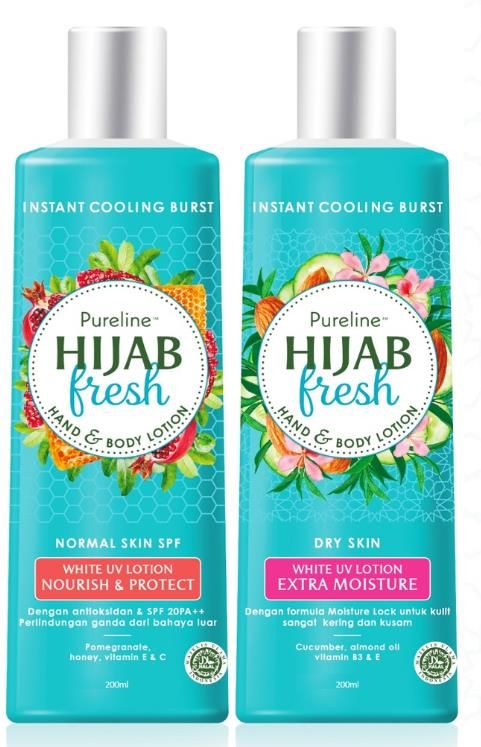
SAFE HARBOUR STATEMENT
This announcement may contain forward-looking statements, including ‘forward-looking statements’ within the meaning of the United
States Private Securities Litigation Reform Act of 1995, including statements related to underlying sales growth and underlying operating
margin. Words such as ‘will’, ‘aim’, ‘expects’, ‘anticipates’, ‘intends’, ‘looks’, ‘believes’, ‘vision’, or the negative of these terms and other
similar expressions of future performance or results, and their negatives, are intended to identify such forward-looking statements. These
forward-looking statements are based upon current expectations and assumptions regarding anticipated developments and other factors
affecting the Unilever Group (the “Group”). They are not historical facts, nor are they guarantees of future performance.

Because these forward-looking statements involve risks and uncertainties, there are important factors that could cause actual results to
differ materially from those expressed or implied by these forward-looking statements. Among other risks and uncertainties, the material
or principal factors which could cause actual results to differ materially are: Unilever's global brands not meeting consumer preferences;
Unilever's ability to innovate and remain competitive; Unilever's investment choices in its portfolio management; inability to find sustainable
solutions to support long-term growth; customer relationships; the recruitment and retention of talented employees; disruptions in our
supply chain; the cost of raw materials and commodities; the production of safe and high quality products; secure and reliable IT
infrastructure; successful execution of acquisitions, divestitures and business transformation projects; economic and political risks and
natural disasters; the effect of climate change on Unilever's business; financial risks; failure to meet high and ethical standards; and
managing regulatory, tax and legal matters. These forward-looking statements speak only as of the date of this announcement. Except as
required by any applicable law or regulation, the Group expressly disclaims any obligation or undertaking to release publicly any updates or
revisions to any forward-looking statements contained herein to reflect any change in the Group's expectations with regard thereto or any
change in events, conditions or circumstances on which any such statement is based. Further details of potential risks and uncertainties
affecting the Group are described in the Group's filings with the London Stock Exchange, Euronext Amsterdam and the US Securities and
Exchange Commission, including in the Annual Report on Form 20-F 2016 and the Unilever Annual Report and Accounts 2016.

Paul Polman
Delivering against our long-term growth model
Connected 4 Growth is accelerating performance:
Increased agility & resilience
Continued growth ahead of our markets
Step-up in profitability
Sustainable investment-led business model:
Compounding returns on investment
Attractive & growing dividends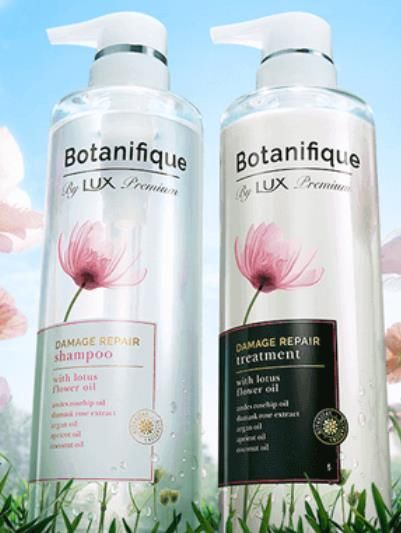
Challenging market conditions

  Consumer demand        Emerging market currencies                        Short-term
    remains weak                more stable                              trade disruption
                                vs. USD rebased to 100
                         110

        H1’2017
                                                           India
   Market value growth
                                                         Indonesia                   GST

        +2%
                                                                                   in India
                                                           Brazil                             Calendar
                                                                     De-stocking              effects in
                                                                      in Brazil               Indonesia
                          90

                         June ‘16                  June ‘17
Good all-round performance – Connected 4 Growth delivering
               Competitive growth                      Savings ahead of plan
       Unilever            Unilever excl. spreads
                                                    >€1 billion in H1’2017
                                    3.4%
        3.0%

         H1 USG         H1 market growth

               Profitable growth                        Strong cash delivery

     Underlying                  Underlying                    +€0.6 bn   €1.4 bn
   Operating Margin          Earnings Per Share
                                                     €0.8 bn
    +180 bps                       +14%
                                                    H1’2016               H1’2017
C4G: a simpler, faster organisation
           2011-2016                           From 2017
      4 Global Categories                  Connected 4 Growth           Already delivering results:

 PC       HC      Foods    Refresh                                      More Global:
                                      PC       HC     Foods & Refresh
                                                                        Number of global projects -10%

                                                                        Size of new global projects +20%

         8 Cluster teams                                                More Local:
                                     CCBTs    CCBTs       CCBTs
                                                                        Number of local projects   +25%
      Building global scale           More global and more local
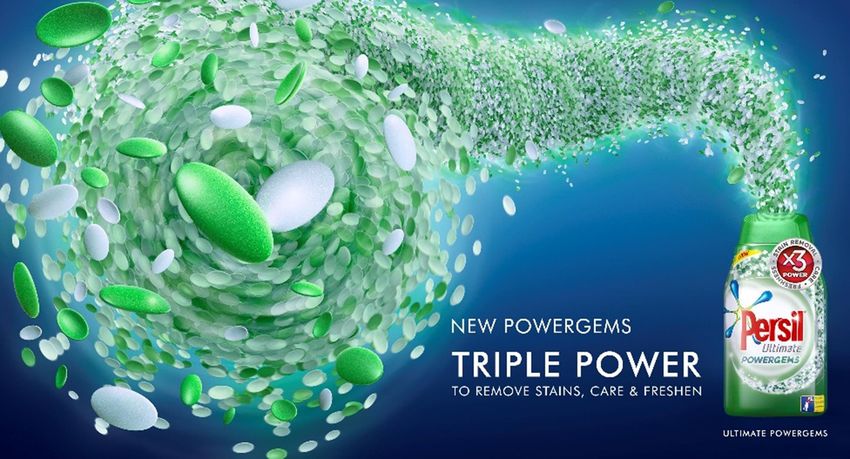
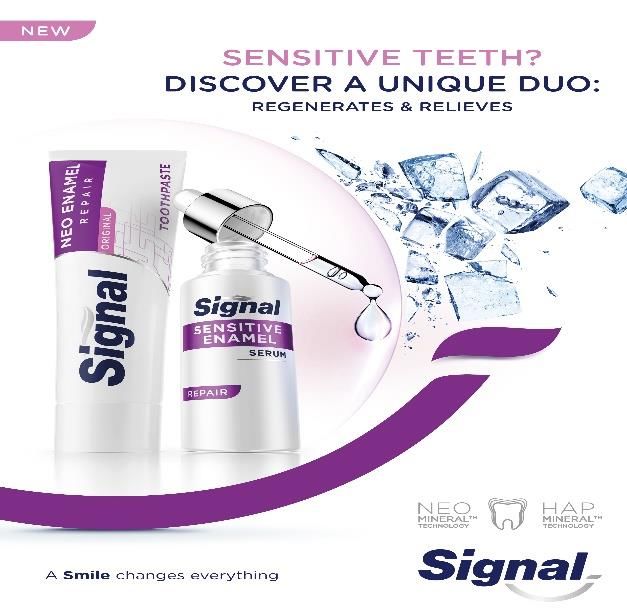
Differentiated technology
   Persil Powergems        Signal Enamel Repair        Magnum Double

 100% active ingredients   Regenerate technology   Magnum 16% growth H1’17

White space expansion
  Hijab fresh             Baby Dove                         Dermalogica

                         New segment                    Launching in China

                         Omo              TRESemmé                        Grom

New brand launch   Launching in Iran   Launching in China          In-home launch
Local agility
 Lux Botanifique         Breyers delights        Liquid bouillons      Cif spray and mousse

                       Accelerated for summer                           Launched in 8 months

                            Omo black                                  Dove Sakura variant

Meeting local trends   Launched in 2 months     Launched in 4 months    Launched in 5 months
Value-creating M&A, faster pace of change
Clear criteria for acquisitions
Strategic fit: Financial discipline:
• Extending into new segments or channels • DCF yield > WACC
• Or, building scale & realising synergies • ROIC / WACC cross over
80% of investment 2009 to 2015 meeting/ exceeding target financial returns
29 Apr 09 06 Dec 10 10 May 11 06 Dec 11 06 Sep 13 02 Dec 14 01 May 15 03 Aug 15
Recent acquisitions growing > 20% in H1 2017
10 Aug 16 20 Oct 16 01 Dec 16 01 Feb 17 01 May 17 AnnouncedInvestment to build new channels
E-commerce Beauty Out-of-home
Grocery.com Market place Mass Prestige
Pureplay Direct
40% growth, ahead of the market Drugstores growing 2x faster Retail stores growing at 15-20%
Building capability in all models Building scale in prestige Building equity with 1300 retail storesGraeme Pitkethly
H1 2017 – All categories growing and improving margins

              Personal Care          Home Care               Foods               Refreshment

 Growth                                                     0.6%
                   2.6%                 3.3%                                        6.1%
                                                       2.0% ex. spreads

 Margin         +240 bps              +110 bps             +100 bps               +230 bps

 •   Personal Care: Innovation and re-investment of savings back-weighted
 •   Home Care: Good growth despite a strong comparator
 •   Foods: Good growth for Knorr, decline in spreads and some non-core brands
 •   Refreshment: Strong performances in both ice cream and tea
H1 2017 – growth by region
Asia / AMET / RUB Latin America North America Europe
€12.1 bn €4.2 bn €4.8 bn €6.6 bn
USG 5.5% USG 5.0% USG 0.3% USG (0.8)%
UVG 0.8% UVG (1.0)% UVG (0.2)% UVG (0.6)%
Excl spreads: Excl spreads:
USG 0.9% USG 0.1%
UVG 0.3% UVG 0.2%H1 2017 - Turnover up 5.5%
USG +3.0%
+1.7%
0.8%
0.0% 3.0%
€27.7 bn
€26.3 bn
H1 2016 UVG UPG M&A FX H1 2017
turnover turnoverUpdate on savings programmes
Half 1 delivery Operational KPIs – examples
> €1 billion savings B&MI vs. 2016
Overheads > €200m Absolute agency fees -17%
Brand & Production cost of TV ads -14%
> €300m
Marketing
Overheads
Number of airline flights -30%
> €500m
Supply Chain
Middle & Senior managers -13%
On track to deliver €6bn savings in 2017-2019H1 2017 - Underlying Operating Margin up 180 bps
+10bps
+130bps
17.8%
+40bps
+30bps
16.0%
H1 2016 Gross Margin Brand & Marketing Overheads H1 2017
InvestmentH1 2017: Underlying Earnings Per Share
Underlying EPS up 11.8% at constant rates
(1.5%) +3.1%
(1.7%) +14.4%
(3.7%) 0.4% 2.6%
+16.9%
€1.13
€1.82
€0.99
H1 2016 Operational JVs, associates, Tax Financing, Currency H1 2017
performance other income, number of
minorities sharesCash flow & balance sheet
Free cash flow Inventory Net debt Pension deficit
Average inventory days € billion € billion
€1.4bn
-2 13.8
+€600m days 12.6 3.2
vs. H1’16
1.6
+€1.2bn
excl. pensions injection Last 12 months Dec-16 Jun-17 Dec-16 Jun-17
• Dividend increased by 12% as announced in April
• €0.6 billion cash injection to UK pension fund in H1 2017
• €1.4 billion shares bought back, on track to complete €5 billion programme this yearPaul Polman
Strong innovation plan in the second half
2017 outlook
Ahead of our markets, 3-5% underlying sales growth
Underlying operating margin now expected to be up at least 100bps
Strong cash flowUnilever First Half 2017 Results
Paul Polman / Graeme Pitkethly
20th July 2017You can also read