Investor Presentation - Third Quarter 2019
←
→
Page content transcription
If your browser does not render page correctly, please read the page content below

Investor
Presentation
Third Quarter 2019

© 2019
                     1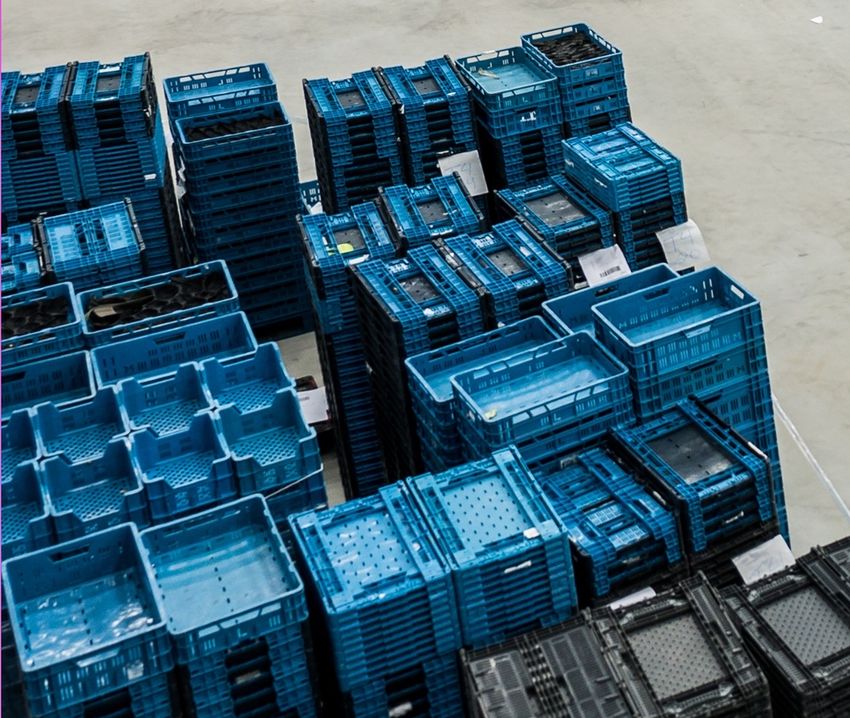
Safe Harbor Statement
This presentation and the accompanying oral commentary contain forward-looking statements within the meaning of the Private Securities
Litigation Reform Act of 1995. All statements other than statements of historical fact could be deemed forward-looking, including, but not limited to,
any statements about expectations, projections, trends, plans, ambitions, strategies, and objectives of management for the future; potential
markets or market size, technology or business developments, enforceability of our intellectual property rights or our position within the industry;
and any statements of assumptions underlying any of the foregoing. Forward-looking statements are also based on estimates and information
available to us at the time of this presentation and are not guarantees of future performance.
Forward-looking statements are subject to significant risks, uncertainties and assumptions. Actual results could differ materially from our current
expectations as a result of many factors, including those identified in the “Risk Factors” section of our most recent filings on Forms 10-K and 10-Q
filed with the Securities and Exchange Commission. If the risks or uncertainties ever materialize or the assumptions prove incorrect, our results
may differ materially from those expressed or implied by such forward-looking statements. Except as required by law, we assume no obligation and
do not intend to update these forward-looking statements or to conform these statements to actual results or to changes in our expectations.
In addition to our results determined in accordance with generally accepted accounting principles (“GAAP”), this presentation includes certain non-
GAAP financial measures. These non-GAAP financial measures are in addition to, and not as a substitute for or superior to measures of financial
performance prepared in accordance with U.S. GAAP. There are a number of limitations related to the use of these non-GAAP financial measures
versus their nearest GAAP equivalents. See the appendix for a reconciliation of those measures to the most directly comparable GAAP measures.

                                                                                                                                                   2
Digital Life for
TRILLIONS
of everyday items                                                 § 10m range
                                                                  § No battery
                                                                  § For pennies

 } Connecting everything to the cloud
 } Expanding the Internet’s reach by a factor of 1000
 } Imagine the applications that can leverage that connectivity
Connecting Retail
Today: ~10Bn(1) apparel items annually;
       ~70Bn(2) to go
   } Increasing sales
   } Reducing inventory
   } Enhancing store efficiencies
   } Improving customer experience
Next: Cosmetics, home goods & food

                       Significant RAIN end users; may not all be Impinj customers

    (1) IDTechEx: "RFID Forecasts, Players and Opportunities 2018 – 2028,” 2018
    (2) Estimate of taggable apparel items based on Statista Market Forecast Apparel – worldwide, March 2019   4
Connecting Aviation
Today: Baggage tracking fully deployed
       at one airline; 290(1) to go
   } Reducing lost luggage
   } Driving operational efficiencies
   } Improving customer satisfaction
   } Virtualizing and improving operations
Next: life vests, safety equip & spare parts

                           Significant RAIN end users; may not all be Impinj customers

  (1) IATA Airline Members, June 2019, https://www.iata.org/about/members/Pages/airline-list.aspx   5
Connecting the Supply Chain
Today: Millions(1) of pallets connected;
       billions to go(2)
   } Enabling real-time visibility
   } Driving shipping efficiencies
   } Automating contract fulfillment
   } Virtualizing and improving operations
Next: Cases, totes and items

                       Significant RAIN end users; may not all be Impinj customers

     (1) IDTechEx: "RFID Forecasts, Players and Opportunities 2018—2028,” 2018
     (2) Freedonia, World Pallets, February 2014                                     6
Trillions of Items Annually
                                                                                                         Other Everyday Items

     RAIN enabled connectivity                                                                           Food Packaging 2Tn(2)
     for 15.4Bn(1) items in 2018
                                                                                                         Caps & Lids 1Tn(2)

                                                                                                         Auto Parts 600Bn(2)

                                                                                                         Postal 300Bn(2)
  We estimate only ~0.1%
  of connectable items                                                                                   Apparel 80Bn(2)
  are connected today                                                Trillions of                        Airline Baggage 4Bn(2)
                                                                    consumable
                                                                  items per year                         Tires 3Bn(2)

                                                                                                                                              Time
(1) RAIN RFID Alliance, “Over 15 Billion RAIN RFID tag Chips Sold in 2018,” February 27, 2019
(2) Food Packaging and Caps & Lids based on Euromonitor International, “Global Trends in Food and Drink Packaging, 2017”. Impinj estimate of Auto Parts
    based on Statista, “Global Car Sales 1990–2019” and “Automotive Industry & Reach,” Timo Unger. Postal based on Universal Postal Union, “Postal economic
    outlook 2018.” Impinj estimate of taggable apparel items based on Statista Market Forecast Apparel – worldwide, March 2019. Airline Baggage based on
    IATA and SITA, “RFID for Baggage Tracking, Business Case 2017.”
    Tires based on Freedonia, “Global tire demand”
                                                                                                                                                  7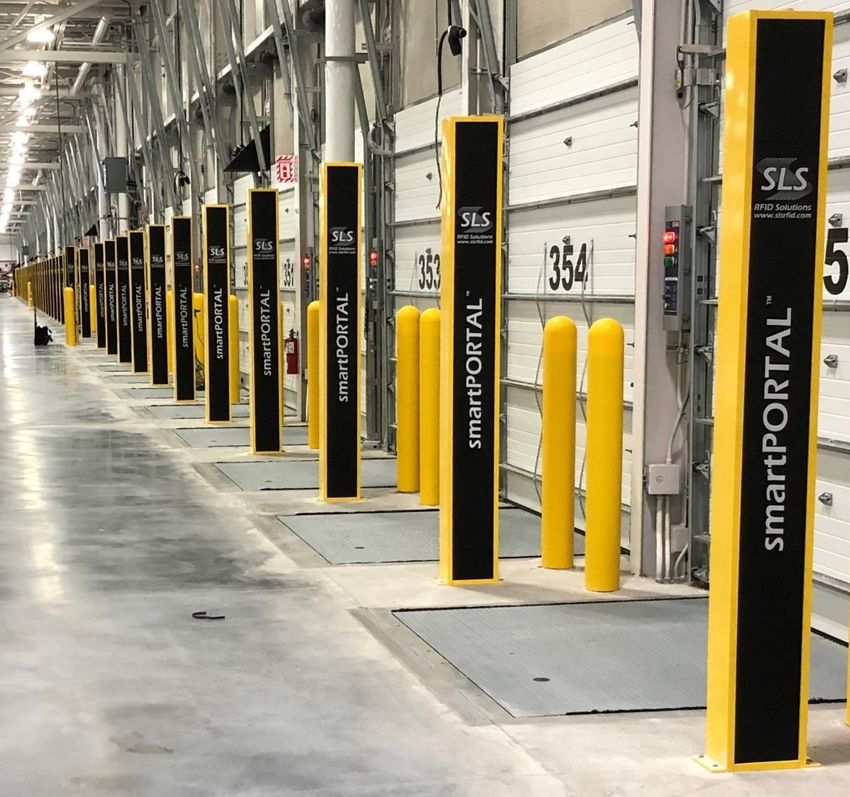
Vision
 Digital Twins
   • Ownership*                                Ownership                 Ownership                Ownership          End-of-life

   • History
   • Links                      Operations                 Logistics                 Management               Use
* Ownership can be temporary,
  such as for item custody

 Physical Items
   • Identity
   • Location
   • Authenticity                                Ship                    Deliver                     Pay             Recycle
                                Manufacturer               Distributor                  Store                 Home

                                                                                                                           8
Mission
One Platform Enabling Item-to-Application Connectivity for the IoT

 Cloud Services

 System Software

 Wireless Link

 Digital Identity

 Physical Items
                                            Linking silicon to applications

                                                                              9
Technology
RAIN = RAdio IdentificatioN
 } Unique ID     – for pennies per endpoint IC
 }   Fast         – up to 1,000 items/sec @ 30 ft
 }   Autonomous – without line-of-sight
 }   Battery-free – essentially unlimited life
 }   Worldwide – spectrum, standards & ecosystem

Complementary IoT Technologies

     Items   Beacons   Internet   Payment   People

                                                     10
Go-to-Market
We sell to, with and through partners
} Software – licensing revenue (still new)
} Gateways – thousands for $1,000s apiece
} Readers – tens of thousands for $100s apiece
} Reader ICs – millions for $10s apiece
} Endpoint ICs – billions for pennies apiece
Partners drive our solutions to market
A few of our hundreds of partners
© 2019 11Why Impinj
Industry leader with global brand
} Integrated platform
30+ BILLION
} Product quality & reliability endpoint ICs sold(1)
} Technology innovator & thought leader 2+ MILLION
} Market-share leader across all product lines connectivity devices sold(1)
250 PATENTS
issued and allowed(1)
IMPINJ NXP Zebra
Whole
platform
Software
Connectivity
Endpoint ICs (1) As of Dec 31, 2018
12Financial Highlights
Quarterly Revenue ($M) Non-GAAP Gross Margins(1)
40.8
38.2
34.4 34.6 33.1 50.2%
14.4 50.0% 50.0% 50.0%
14.5
10.7 12.8 11.2 49.0%
23.7 23.7 26.4
21.8 21.8
3Q18 4Q18 1Q19 2Q19 3Q19 3Q18 4Q18 1Q19 2Q19 3Q19
Endpoint ICs Systems
Systems is the platform’s connectivity and software layers (reader ICs, readers, gateways and software)
(1) Excludes depreciation, amortization, and stock-based compensation. See the detailed reconciliation to closest GAAP measure included in our quarterly results filed with the SEC and posted to our IR website 13Financial Highlights
Cash and Investments ($M) Non-GAAP R&D ($M) (1)
$63.1 $8.1
$7.4 $7.6
$7.1 $7.0
$59.8
$56.1 $56.6
$54.7
3Q18 4Q18 1Q19 2Q19 3Q19 3Q18 4Q18 1Q19 2Q19 3Q19
(1) Excludes depreciation, amortization, and stock-based compensation. See the detailed reconciliation to closest GAAP measure included in our quarterly results filed with the SEC and posted to our IR website 14Our Strategy
} Invest in our platform
} Drive end-user adoption
} Link silicon to applications
We succeed when our platform
is the engine of our partners’ success
15Team
Chris Diorio, Ph.D. Eric Brodersen Yukio Morikubo Jeff Dossett
CEO, Vice-Chair, Co-Founder President, COO, PFO General Counsel EVP Sales & Marketing
30 Years Experience 25 Years Experience 30 Years Experience 25 Years Experience
Hussein Mecklai Linda Breard John Quist
EVP Engineering CFO Consultant SVP Operations
20 Years Experience 25 Years Experience 30 Years Experience
16Join Us On Our Journey
Expanding
the Internet’s reach
to TRILLIONS of
everyday items
17Appendix GAAP to Non-GAAP Reconciliations
GAAP to Non-GAAP Reconciliation
                                              2018                   2019
                                      Q3             Q4      Q1      Q2         Q3
GAAP Gross Margin                     48.1%          47.1%   48.0%   48.2%      48.5%
Adjustments:

 Depreciation and amortization        1.5%           1.5%    1.6%    1.4%       1.2%
 Stock-based compensation             0.4%           0.4%    0.4%    0.4%       0.5%
Non-GAAP Gross Margin                 50.0%          49.0%   50.0%   50.0%      50.2%

GAAP Research and development ($M)     8.8            9.0     8.6     8.8       10.3
Adjustments:

 Depreciation and amortization        (0.4)          (0.4)   (0.4)   (0.5)      (0.5)
 Stock-based compensation             (1.0)          (1.0)   (1.1)   (1.2)      (1.7)
Non-GAAP Research and development      7.4            7.6     7.1     7.0 (1)    8.1

   (1)   Variations due to rounding

                                                                                        19
You can also read


