CNMC Goldmine Holdings Limited - 2H2020 & FY 2020 Results Briefing 28 February 2021
←
→
Page content transcription
If your browser does not render page correctly, please read the page content below
CNMC Goldmine Holdings Limited
            2H2020 & FY 2020 Results Briefing
                                  28 February 2021
(These presentation slides are available on the Company’s corporate website www.cnmc.com.hk)
2H2020
Financial Highlights
2H2020 Financial Highlights
Income statement                                      2H 2020       2H 2019        Change
Revenue (US$' million)                                     13.41         18.72         -28.4%
Results from operating activities (US$' million)           (3.96)         2.37           n.m.
Net (loss)/profit (US$' million)                           (3.70)         2.61           n.m.
Net (loss)/profit margin                                  -27.6%         13.9%         -41.5%
(Loss)/Earnings per share (US cents)                       (0.65)         0.55           n.m.
(Loss)/Earnings per share (SG cents)                       (0.90)         0.75           n.m.

      Net asset                                     Debt/Equity                Net cash
                                      Current
      value of                                      ratio of 0.02             position of
                                    ratio of 2.82
     US$39.44m                                                                US$10.44m
2H2020 Revenue Revenue down 28.4%: Sales volume of fine gold, from 12,514 ounces to 6,824 ounces Partly offset by: Average realised gold price, from US$1,496/ounce to US$1,964/ounce
2H2020 Net Profit/(Loss)

Net loss of US$3.70 million in 2H 2020 vs net profit of US$2.61 million in 2H 2019 mainly
due to significant drop in production and sales volume of fine gold as a result of Covid-19
pandemic and lower grade ore. An allowance for impairment of exploration and evaluation
assets of 51%-owned CNMC Pulai Mining also contributed to the loss.
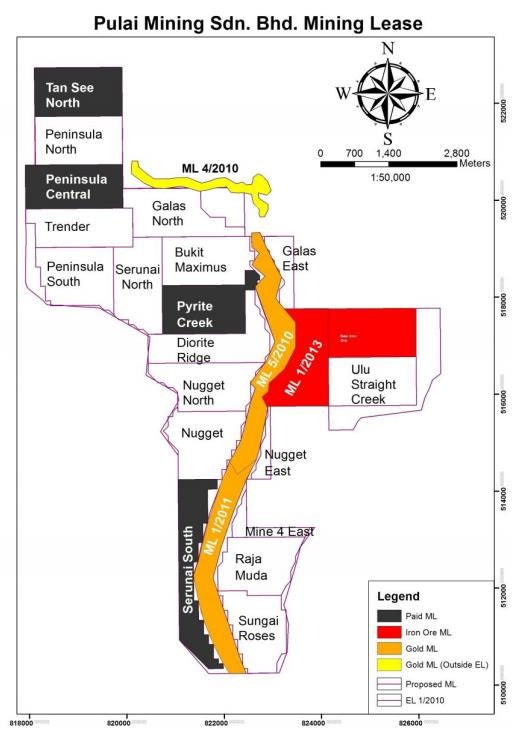
Impairment for Pulai Mining
An impairment allowance of approximately US$3.8 million was
made against certain exploration and evaluation assets of Pulai
Mining, specifically, in light of the uncertainties surrounding and
pertaining to the operations. Such uncertainties include the
following:
The outcome of renewal for an exploration licence expired in
late last year is still pending to date
The unfavourable outcome of the renewal for its iron ore
mining licences was only made known last year even though
the renewal application was made some two years ago. While
an appeal has since been filed, the outcome of which is still
pending to date
Uncertainties over the renewal of its feldspar mining license
and the commercial and economic viability of feldspar mining
following our recent reassessment of the same, especially
having regard to the prevailing rates of royalties payable to the
authorities on the sale of such minerals, the estimated amount
of labour costs and additional capital expenditure, and the
geographical demand for such minerals
Notwithstanding the above, revenue and profit contributions from
CNMC Pulai has not been significant to date.2H2020 Analysis Of All-In Costs And Margin All-in sustaining costs include adjusted operating costs and sustaining capital expenditure, corporate general and administrative expenses and exploration expenses, reflecting the full cost of gold production from current operations.
Summary Of All-In Costs And Margin

All-in costs of US$1,800/ounce in 2H 2020 up 34.9% from US$1,334/ounce in 2H
2019, mainly due to drop in production and sales volume of fine gold as a result
of Movement Control Order and lower grade ore.
Half-yearly Production Volume
FY 2020
Financial Highlights
FY 2020 Financial Highlights
Income statement                                      FY 2020       FY 2019        Change
Revenue (US$' million)                                     23.88         39.10         -38.9%
Results from operating activities (US$' million)           (5.13)         6.41           n.m.
Net (loss)/profit (US$' million)                           (4.78)         5.47           n.m.
Net (loss)/profit margin                                  -20.0%         14.0%         -34.0%
(Loss)/Earnings per share (US cents)                       (0.87)         1.09           n.m.
(Loss)/Earnings per share (SG cents)                       (1.20)         1.49           n.m.

       Net asset                                                               Net cash
                                      Current       Debt/Equity
       value of                                                               position of
                                    ratio of 2.82   ratio of 0.02
      US$39.44m                                                               US$10.44m
REVENUE: FY 2011 TO FY 2020
NET PROFIT / (LOSS): FY 2011 TO FY 2020
Analysis Of All-In Costs And Margin

All-in sustaining costs include adjusted operating costs and sustaining
capital expenditure, corporate general and administrative expenses, and
exploration expenses, reflecting the full cost of gold production from
current operations.
Recent Corporate Developments
Recent Developments
Underground Mining at Sokor

• Started in November 2020, with first batch of gold bars produced in
  December

• Gold production in December accounted for 46% of total 2H2020 output

• Carbon-in-leach (CIL) plant running at more optimal levels: both open-pit
  and underground operations feeding higher-grade gold ores to CIL facility
Recent Developments
Tax Status

• Application to be reinstated into Malaysia’s Pioneer Status Incentive
  Scheme has been unsuccessful

• Under this scheme, CNMC’s main operating subsidiary was fully
  exempted from taxes for 5 years until 30 June 2018 for profits
  generated from the sale of gold bars

• Outcome not expected to have material impact as provisions already
  made following the cessation of the tax exemption in 2018
Growth Strategies
Growth Initiatives For Sokor
• Ultimate objective is to:

    •   Further boost gold production;

    •   Better manage operating expenses; and

    •   Diversify mining portfolio to include silver, lead and zinc production
Growth Initiatives For Sokor
• Further boost gold production:
• Exploring the possibility of expanding CIL plant as part of efforts to
double production capacity.
• Better manage operating expenses:
• Renegotiate with our suppliers and service providers to better manage
operating expenses.Growth Initiatives For Sokor
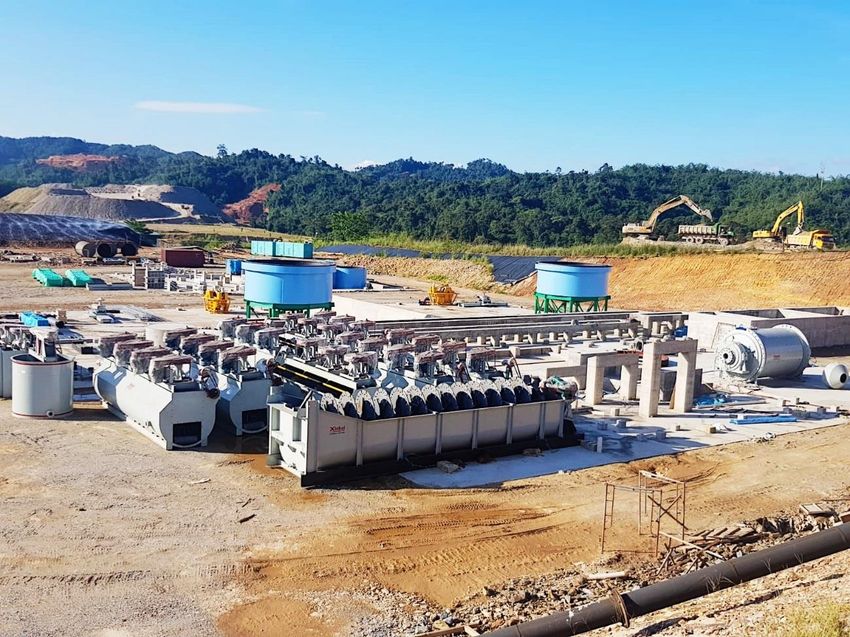
• Diversify mining portfolio:
• Currently constructing a flotation facility for processing approximately
500 tonnes of ore a day to monetise silver, lead and zinc resources.Outlook
Outlook
Slight pullback in gold prices lately due to:
• Higher US Treasury yields (US economic indicators turning
positive)
• Resilient US dollar
• Growing risk appetite (evident in run-up in stock markets)
• Increased interest in cryptocurrencies, especially Bitcoin
Outlook for gold for foreseeable future still favourable given low
interest rates and loose monetary policy globally
Growing expectations of a commodities super-cycle
New source of income from sales of lead and zinc concentrate
once flotation plant starts commercial operation in 2021 (subject to
award of operation permits from relevant authorities)Stock Data & Dividend
Stock Data & Dividend
(SGX: 5TP)
(Reuters: CNMC.SI)        22 February 2021
(Bloomberg: CNMC:SP)

Price per share                S$0.23

Market capitalisation      S$93.77 Million

Share issued               407.69 Million

P/E ratio                       N.A.

Dividend yield                  N.A.
Dividend Payout Ratio Track Record
Peer Comparison
           How CNMC Compares with Other Gold Miners Listed on SGX

  Company         Ticker    Exchange       Market cap     Operating         Profitable:       Latest gold   Trailing   P/B    Dividend     Share price
                                             (mil)         status        (latest full year)     annual        P/E             yield (%)   YTD gain/loss
                                                                              Yes/No          output (oz)                                     (%)

CNMC               5TP      Singapore        S$93.8       Production,           No                 13,046    N.A.      1.8      N.A.          -19.3
                                                          exploration

Golden             AUE      Singapore       S$355.3       Production,          Yes                 N.A.*     18.2      0.7       8.5          -5.6
Energy and                                                exploration
Resources

Shen Yao (ex-      A78      Singapore       S$130.8       Production,          Yes                 42,697    29.6      2.8      N.A.          33.3
LionGold)                                                 exploration

Wilton             5F7      Singapore        S$76.8       Production,           No                  885      N.A.      42.8     N.A.           0
Resources                                                 exploration

* Completed acquisition of Australia’s Ravenswood gold mine in 1H2020

Sources: Companies, ShareInvestor.com. All figures based on close of trading on 22 February 2021
Disclaimer
The materials used herein and this presentation (collectively, the “Presentation”) have been prepared by CNMC Goldmine Holdings
Limited (“CNMC”) solely for use at the presentation to be made to qualified investors and investment professionals. By viewing the
Presentation, or by reading the materials used at the Presentation, you agree to be bound by the following limitations:
• The Presentation is strictly confidential and may not be copied, published, distributed or transmitted or disclosed by recipients to
third parties.
• The Presentation does not constitute or form part of any offer or invitation to sell or issue, or any solicitation of any offer to
purchase or subscribe for, any securities or an inducement to enter into any investment activity, nor shall any part or all of the
Presentation form the basis of, or be relied on in connection with, any contract or investment decision in relation to any
securities.
• The Presentation contains forward-looking statements based on the currently held beliefs and assumptions of the management
of the Company, which are expressed in good faith and, in our opinion, reasonable. Forward-looking statements involve known
and unknown risks, uncertainties and other factors, which may cause the actual results, financial condition, performance, or
achievements of the Company or industry results, to differ materially from the results, financial condition, performance or
achievements expressed or implied by such forward-looking statements. Given these risks, uncertainties and other factors,
viewers of the Presentation are cautioned not to place undue reliance on these forward-looking statements.
• The Presentation is only directed at qualified investors and investment professionals and other persons should not rely on or act
upon the Presentation or any of its contents.
• The Presentation does not constitute a recommendation regarding the securities of the Company. By attending this
presentation you acknowledge that you will be solely responsible for your own assessment of the market and the market
position of the Company and that you will conduct your own analysis and be solely responsible for forming your own view of the
potential future performance of the business of the Company.
• The Presentation reflects the affairs of the Company as at the date it is presented to the investors. Any further discussions of
the Company or any of their respective affiliates with any of the recipients shall not, under any circumstances, create any
implication that there has been no change in the affairs of the Company since such date.Thank You
Media and Investor Contact
Frankie Ho
M: 9858 7990
Email: frankie@outreachcomms.comYou can also read