GAZPROM: 2017 IFRS RESULTS - APRIL 27, 2018
←
→
Page content transcription
If your browser does not render page correctly, please read the page content below
GAZPROM:
2017 IFRS RESULTS
APRIL 27, 2018

                        1
    2017 IFRS RESULTS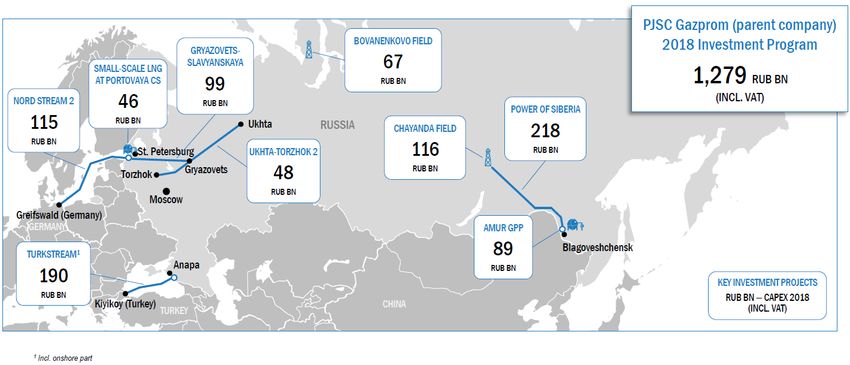
Alexander Ivannikov
                    Head of Department

                                          2
2017 IFRS RESULTS
DISCLAIMERS
This presentation has been prepared by PJSC Gazprom (the “Company”), and comprises the slides for a presentation to investors
concerning the Company. This presentation does not constitute or form part of any offer or invitation to sell or issue, or any solicitation of
any offer to purchase or subscribe for, any shares or other securities representing shares in the Company, nor shall it or any part of it nor
the fact of its presentation or distribution form the basis of, or be relied on in connection with, any contract or investment decision.
Any viewer of this presentation considering a purchase of such securities is hereby reminded that any such purchase should be made
solely on the basis of the information contained in the prospectus or other offering document prepared in relation thereto and will be
subject to the selling restrictions set out therein. The information in this presentation should not be treated as investment advice. Care
has been taken to ensure that the facts stated in this presentation are accurate, and that the opinions expressed are fair and
reasonable. However, the contents of this presentation have not been verified by the Company. Accordingly, no representation or
warranty, express or implied, is made or given by or on behalf of the Company or any of its members, directors, officers or employees or
any other person as to the accuracy, completeness or fairness of the information or opinions contained in or discussed at this
presentation. None of the Company or any of their respective members, directors, officers or employees nor any other person accepts
any liability whatsoever for any loss howsoever arising from any use of this presentation or its contents or otherwise arising in connection
therewith.
The information in this presentation includes forward-looking statements, such statements may also occur during the Q&A session.
These forward-looking statements include all matters that are not historical facts, statements regarding the Company’s intentions,
beliefs or current expectations concerning, among other things, the Company’s results of operations, financial condition, liquidity,
prospects, growth, strategies, and the industry in which the Company operates. By their nature, forward-looking statements involve risks
and uncertainties, including, without limitation, the risks and uncertainties to be set forth in the prospectus, because they relate to
events and depend on circumstances that may or may not occur in the future. The Company cautions you that forward looking
statements are not guarantees of future performance and that its actual results of operations, financial condition and liquidity and the
development of the industry in which the Company operates may differ materially from those made in or suggested by the forward-
looking statements contained in this presentation. In addition, even if the Company’s results of operations, financial condition and
liquidity and the development of the industry in which the Company operates are consistent with the forward-looking statements
contained in this presentation, those results or developments may not be indicative of results or developments in future periods.
The information and opinions contained in this presentation are provided as at the date of this presentation and are subject to change
without notice. No person is under any obligation to update or keep current the information contained herein.
By attending the presentation you agree to be bound by the foregoing limitations.

                                                                                                                                   3
        2017 IFRS RESULTS
MAJOR 2017 AND RECENT EVENTS
• Record-high exports to Europe +8% YoY at 194.4 bcm Market environment in 2017 vs 2016
• Crude oil production growth +4% YoY at 59.5 mt (incl. JV) USD/bbl USD/RUB
60 54.1 52.9 80
67,0
2017 • Supplementary Agreement with CNPC signed to supply 60.7 58,4 57.6
43.7 42.0
Major gas via Power of Siberia starting December 20, 2019 60
40
events
• Nord Stream 2: €1.6 bn received from European Energy 40
Companies 20
20
• Access to OPAL pipeline broadened 0 0
2016 2017 2016 2017
• BoD approved 50/50 JV with BOTAS for the construction BRENT URALS USD/RUB AVERAGE RATE
and operation of the onshore transit gas pipeline in Turkey USD/RUB AS OF THE END OF PERIOD
USD/mcm RUB/mcm
• Construction of the TurkStream pipeline continues, first
200.2 3,816 3,808
string is expected to approach Turkish coast in May 2018 4,000
200
176.0
3,000
• Construction of the Power of Siberia pipeline continues, 150
Jan over 75% of the first phase laid 100 2,000
2018
- • Germany and Finland granted all required approvals to 50 1,000
Apr build the Nord Stream-2 pipeline, additional €0.4 bn
2018 0 0
received from European Energy Companies 2016 2017 2016 2017
AVERAGE GAZPROM GAS PRICE IN
• Moody's and S&P upgraded Gazprom’s ratings to AVERAGE GAZPROM GAS SALES
RUSSIA
PRICE IN EUROPE & OC 1
investment grade
• Management Committee proposed RUB 8.04 per share Source: Company data. Bloomberg. Bank of Russia website
1 OC - Other countries: including LNG sales
dividend for 2017
4
2017 IFRS RESULTSSUMMARY OF 2017 IFRS FINANCIAL RESULTS
RUB bn
RUB bn
7%
3,600
6,600 2016 vs 2017
3,300
6,300
3,000
6,000
6,546 Adjustments needed
2,700
5,700 Liabilities in accordance for analytical purposes*
with the court decisions in
2,400
5,400
favor of Naftogaz were 18%
2,100 included in other expenses
1,800
-24%
1,500 3%
11%
1,200
-25% 2,068
900
1,467 1,406
600 1,187
714
300
0
-219
-300 1 2 3 4
Total net sales Adj. EBITDA Net profit Capex Operating CF FCF Net debt
1 EBITDA adjusted for changes in impairment provisions *In order to reflect the effects of the bank deposits (reported as part of Other current and
2 Profit for the period attributed to shareholders of PJSC Gazprom non-current assets) increase
3 Cash capital expenditures
4 Compared to Net debt as of December 31, 2016
5
2017 IFRS RESULTSPRODUCTION
Natural gas Gas condensate Crude oil
bcm mln ton mln ton
+12% +1% +3%
600.0 20.0 60.0
472.1 -2% 15.9 15.9 +3% 47.2 48.6 -5%
420.1
400.0 40.0
10.0
200.0 134.1 131.4 4.2 4.3 20.0 12.5 11.9
0.0 0.0 0.0
2016 2017 4q16 4q17 2016 2017 4q16 4q17 2016 2017 4q16 4q17
Electricity Heat
bn kWh mln Gcal
-1% -2%
156.7 155.5 -7% -9%
160
150 128.8 126.5
120
100
80
45.7 42.5 47.4 43.0
50
40
0 0
2016 2017 4q16 4q17 2016 2017 4q16 4q17
Gazprom Group’s volumes produced in Russia
Calculations may diverge due to rounding.
6
2017 IFRS RESULTSGAS SALES
Russia Europe & OC2 FSU
VOLUMES AVERAGE PRICE IN RUSSIA VOLUMES AVERAGE PRICE IN EUROPE & OC VOLUMES AVERAGE PRICE IN FSU
bcm RR/mcm bcm USD/mcm bcm USD/mcm
219
300 3,816 3,808 3,848 3,942 300 200 50 200
4000 176 178 154 158 152 157
200
40
200 3000 200
30
100
2000 242 100 20
100 215 230 100 228 35
33
1000 10
75 73 67 68 11 11
0 0 0 0 0 0
2016 2017 4q16 4q17 2016 2017 4q16 4q17 2016 2017 4q16 4q17
RR bn RR bn +4% RR bn
+7% 2,221
1000 876 2400 2,140 400
820 310 -5% 293
800 1800 300
600
-1% 1200 +14% 200
400 289 288 674 95 -5% 91
593
600 100
200
0 0 0
2016 2017 4q16 4q17 2016 2017 4q16 4q17 2016 2017 4q16 4q17
1 3,4 3, 4
NET SALES TO RUSSIA NET SALES TO EUROPE & OC NET SALES TO FSU
Calculations may diverge due to rounding.
1 Net of value added tax (VAT)
2 OC - Other countries: include LNG sales
3 VAT is not charged on sales
4 Net of custom duties and excise tax
7
2017 IFRS RESULTSOIL AND ENERGY BUSINESS
Net Sales1
2016 2017
61% 58%
CRUDE OIL AND GAS CONDENSATE; REFINED
PRODUCTS
GAS BUSINESS AND OTHER REVENUES
ELECTRICITY AND HEAT
34%
31% 8% 8%
Crude oil and gas condensate; refined products Electricity and heat
+13% -3%
RUB bn RUB bn
800 200
612 159 160 154
542 533 561
600 522 150
103
400 100 86
200 50
0 0
4Q2016 1Q2017 2Q2017 3Q2017 4Q2017 4Q2016 1Q2017 2Q2017 3Q2017 4Q2017
Calculations may differ due to rounding.
1 Net of value added tax (VAT), excise tax and custom duties.
8
2017 IFRS RESULTSBANK DEPOSITS
According to Gazprom 2017 IFRS report1:
Key features of bank deposits2: In 2017 Gazprom substantially increased
• Early withdrawal clause bank deposits volumes
• Deposit term of over 3 months 400 RUB bn 330
• Are NOT included in Сash and cash equivalents 2
300
Impact of substantial increase in bank deposits: 186
200 132 LT DEPOSITS
• Decrease in Cash and cash equivalents 42 328
5 ST DEPOSITS
• Increase in Net Debt and Net Debt/EBITDA
100
• Reduction in Cash flows from operating activities3 127 144
(changes in working capital) 0
• Decrease in Free cash flow3 2015 2016 2017
Increase in LT and ST bank deposits is aimed at improving the efficiency of liquidity management
1 Source: Gazprom 2017 IFRS report, page 33 3 Affected by ST deposits
2 Reported as a part of Other current assets and Other non-current assets
9
2017 IFRS RESULTS2017 ADJUSTED FREE CASH FLOW BREAKDOWN*
0
900
FCF adjusted for changes in bank
RUB bn
Changes in bank deposits remained positive at
deposits
RUB 24 bn in 2017
750
1,450
1,458
243
600
1,300
0 28
450
1,150
1,187 1,406
300
150
150
24
00
0 243
-150
-219
-300
-300
Working
OCF before Adjustment for
capital OCF FCF FCF
working capital Capex increase in
and operating items reported reported adjusted
changes ST deposits
changes, tax
* Free Cash Flow adjusted for changes in the ST bank deposits
10
2017 IFRS RESULTSKEY DEBT METRICS
Net Debt adjusted on bank deposits1 Total Debt breakdown Cash, cash equivalents,
6000 RUB bn 1.5 1.4
by currency bank deposits
1.5 breakdown by currency
4000 0.9 USD
1.0 EUR 24%
37%
1,491 1,199 USD
1,083 37% RUB
2000 0.5 EUR
59%
14%
1,952 1,747 2,068
RUB
0 0.0 19% Other Other
2015 2016 2017 7% 3%
CASH&CASH EQUIVALENTS (INCL. DEPOSITS)
NET DEBT ADJ.
NET DEBT ADJ./ADJ.EBITDA*
2017 adjusted Net Debt structure1 Credit ratings of Gazprom
3,500 RUB bn 1.7 1.8 Rating Outlook
1.4
3,000
869 BBB–
Fitch * positive
2,500
2 1.2 (investment grade)
328
2,000
Baa3
3,267 Moody's positive
1,500 (investment grade)
2,398 0.6
1,000 2,068
BBB–
S&P * stable
500 (investment grade)
0 0
Total Debt Cash & Net Debt ST deposits LT deposits Net Debt
Dagong AAA stable
equivalents reported adjusted
NET DEBT ADJ./ADJ.EBITDA *
ACRA AAA (RU) stable
1 Net Debt adjusted for the bank deposits reported as a part of Other current and non-current assets (see Slide 9 for details) * In USD terms
11
2017 IFRS RESULTSCAPITAL EXPENDITURES
Cash Capex The Group’s 2017 Capex breakdown1
6%
RUB bn 4%
1800
1,641 (17%) 15% 33%
+3%
1,406
1,369
1200
20%
22%
TRANSPORT
600
+39% PRODUCTION OF CRUDE OIL AND GAS CONDENSATE
418
PRODUCTION, DISTRIBUTION AND STORAGE OF NATURAL GAS
300
REFINING
ELECTRICITY AND HEAT
0
2015 2016 2017 4Q2016 4Q2017 OTHER CAPEX
1 CapEx breakdown as provided in Management Report
12
2017 IFRS RESULTSKEY GAS BUSINESS INVESTMENT PROJECTS
13
2017 IFRS RESULTSDIVIDEND PAYOUT
Dividend
per share
10 RUB/ Share 190% 200%
8.97
1
7.89 8.0397 8.04
8 160%
7.2 7.2
5.99
6 107% 120%
3.85 90%
4 80%
2.39
46% 46%
2 27%
40%
0.36 26%
25% 24%
9% 27%
5% 16% 24% 20%
1% 12% 15%
0 7% 9% 0%
2008 2009 2010 2011 2012 2013 2014 2015 2016 2017
DIVIDENDS AS % OF IFRS NET INCOME RAS BASED DIVIDEND PAYOUT RATIO
1 As proposed by the Management Committee
14
2017 IFRS RESULTSINVESTMENT CASE
BUSINESS GROWTH, ENHANCING SUPPLY SECURITY
Conservative STRONGER FINANCIAL
Improving Balanced
financial policy, OUTLOOK
FCF profile dividend policy
cost control
Business growth Improving gas markets
Strategic transformative projects BUSINESS
in gas and oil outlook.
(capex peaking GROWTH
segments; further Spare production and export
in 2018 - 2019)
growth potential capacity
High competiveness
Outstanding resource base and UNIQUE
Low cost base of Gazprom’s gas.
infrastructure
Record exports
FUNDAMENTALS
15
2017 IFRS RESULTSADDITIONAL INFORMATION
16
2017 IFRS RESULTSRUSSIAN NATURAL GAS BALANCE
Bcm 2016 2017 4Q2016 4Q2017
Natural gas resources 718.20 770.29 219.75 214.09
Domestic gas production 640.40 691.19 190.99 188.29
Other sources including Central Asian and Azerbaijani gas 22.97 25.33 6.66 6.13
Gas withdrawn from underground storage in Russia, Latvia and Europe 50.98 50.45 21.23 19.05
Decrease in the amount of gas within the gas transportation system 3.85 3.31 0.87 0.61
Natural gas distribution 718.20 770.29 219.75 214.09
Domestic consumption 456.68 468.01 147.19 140.81
including needs of the gas transportation system
32.29 37.81 11.22 11.11
and underground storages
Gas pumped into underground storages 28.54 53.02 2.06 4.13
Gas for LNG production 14.70 15.46 4.24 4.16
Foreign supplies 181.68 197.40 53.64 53.50
FSU supplies 32.11 32.88 10.81 10.58
Increase in the amount of gas within the gas transportation system 4.49 3.52 1.82 1.02
Source: Company Operating Data
17
2017 IFRS RESULTSTHANK YOU!
18
2017 IFRS RESULTSYou can also read