HALF-YEAR 2019 INTERIM RESULTS - PRESENTATION - GLOBENEWSWIRE
←
→
Page content transcription
If your browser does not render page correctly, please read the page content below
Presentation
Half-Year 2019 Interim Results

Corporate overview and
         operational highlights

Page 2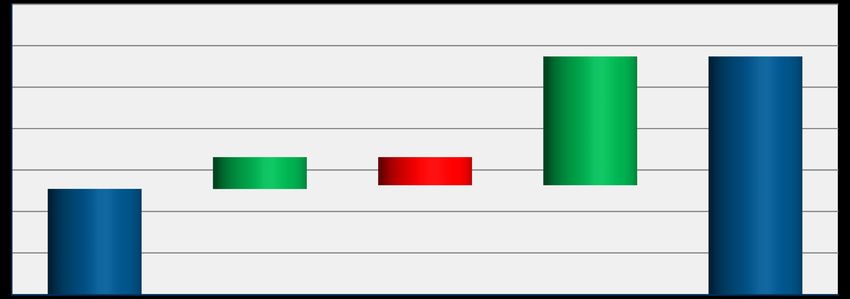
Corporate overview
         • Solid first-half 2019 with rising revenues, strong profitability, record activity levels and with a
           material contribution from the North Sea

         • H1 2019 net profit of USD 119 million, double H1 2018 level

         • H1 2019 Company Working Interest (CWI) production of 107,100 barrels of oil equivalent per day
           (boepd), up 39 percent from the same period a year earlier

         • H1 2019 operational spend of USD 274 million (including capex, expex and lifting costs), of which
           60 percent in Kurdistan and 40 percent in North Sea (net after tax)

         • Full year 2019 projected operational spend of USD 680 million split evenly between Kurdistan
           and North Sea (net after tax)

         • Continue to pursue M&A activity with focus on development and producing assets
Page 3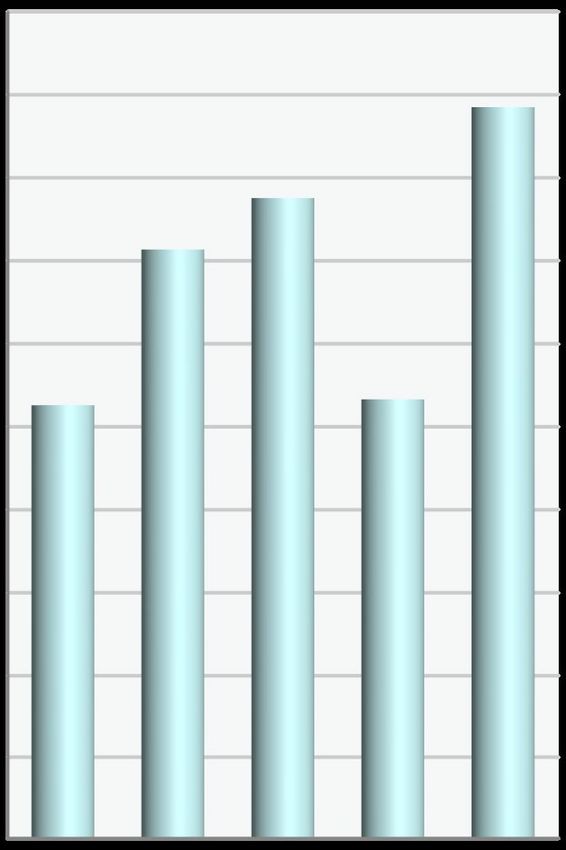
H1 2019 operational highlights
         • DNO ramps up operational activity with 14 wells spud in H1 2019

         • On track to deliver largest annual drilling program in the Company’s 48-year history with 36 wells
           across portfolio, of which 23 development/infill and 13 exploration/appraisal wells

         • H1 2019 CWI production averaged 89,300 barrels of oil per day (bopd) from Kurdistan and
           17,800 boepd from North Sea

         • Operated production in Kurdistan climbed 20 percent to 126,700 bopd from 106,000 bopd in H1
           2018

         • Operated production in North Sea in H1 2019 averaged 4,100 bopd (following acquisition of
           Faroe Petroleum plc)

Page 4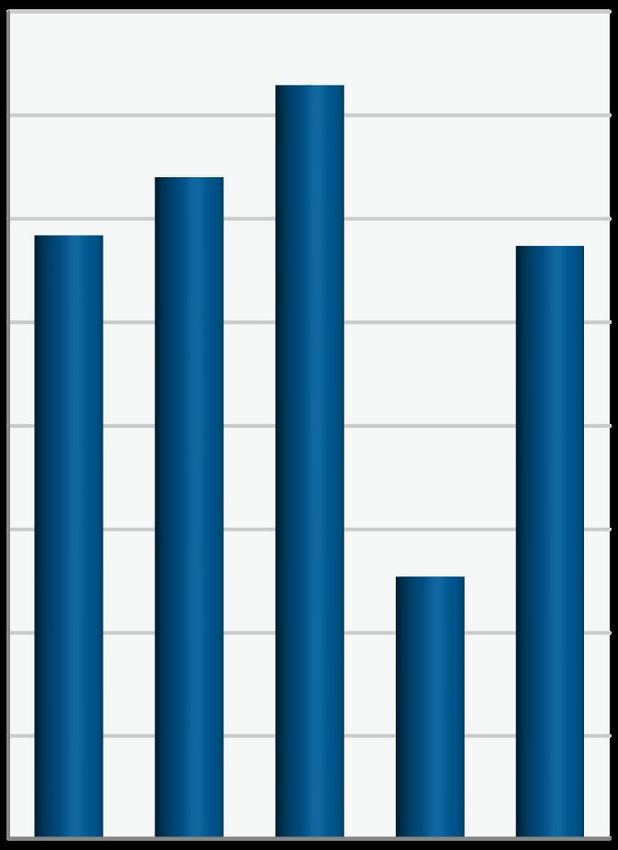
H1 2019 financial highlights
         • H1 2019 revenues of USD 470 million, up 63 percent from the same period a year earlier, of
           which USD 362 million from Kurdistan and USD 108 million from North Sea

         • Completed USD 780 million acquisition of Faroe Petroleum plc in March 2019

         • USD 400 million bond issue closed in May 2019 and bought back USD 78 million of previous
           bonds

         • Exited H1 2019 with cash balance of USD 574 million plus USD 94 million in treasury shares and
           marketable securities

         • Shareholders approved second year dividend distribution on back of strong financials

Page 5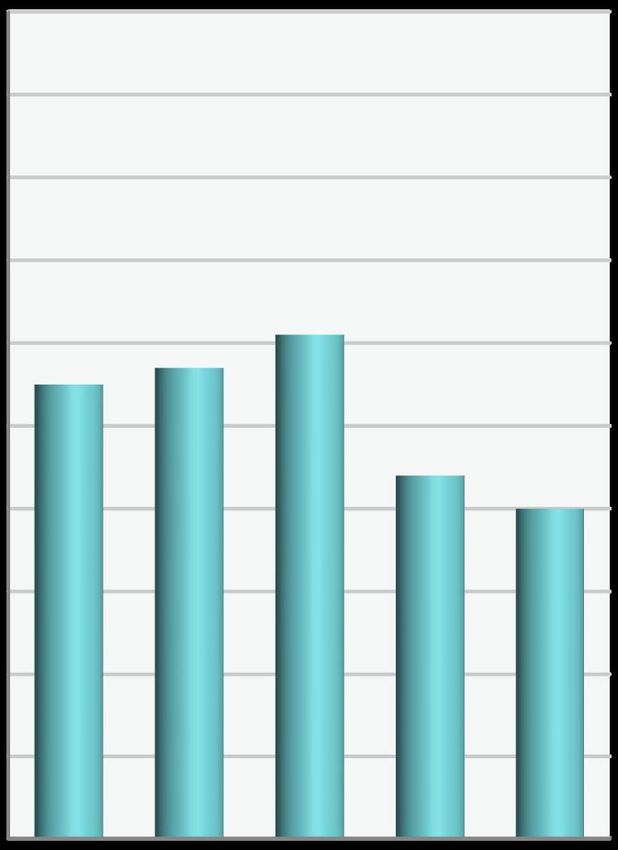
Foot on accelerator in Kurdistan: Tawke
         • Flagship Tawke field remains largest IOC-operated oil field in Kurdistan

         • Production averaged 71,700 bopd in H1 2019 with three new producing wells brought onstream

         • Adding fourth rig, Viking-11, to support 13 well program in H2 2019, including a deep well to test
           the Jurassic potential at Tawke

         • Progressing Peshkabir-to-Tawke gas project, first ever enhanced oil recovery project in Kurdistan

         • Tawke cumulative production reached 268 million barrels (MMbbls) at end H1 2019

Page 6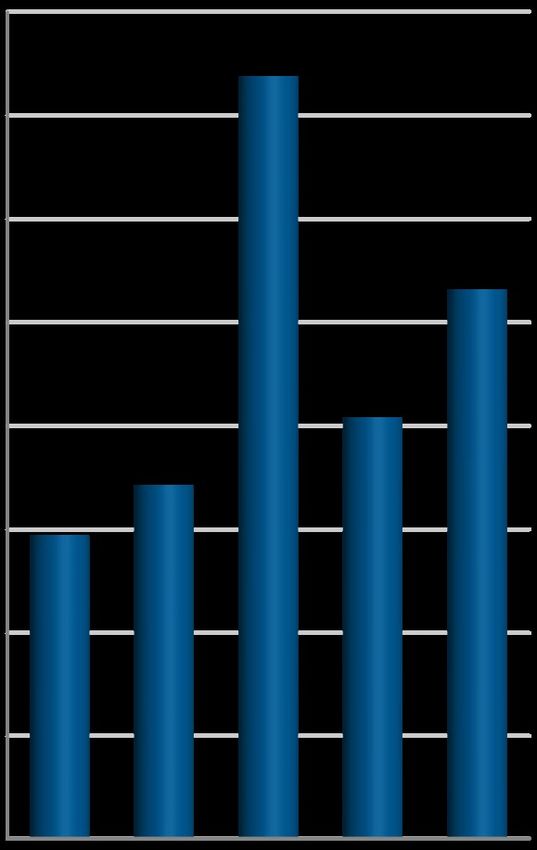
Foot on accelerator in Kurdistan: Peshkabir
         • Peshkabir field now the second largest IOC-operated field in Kurdistan

         • Production averaged 55,000 bopd in H1 2019 with two new production wells brought on stream

         • Four additional wells currently drilling or scheduled to spud in H2 2019

         • At completion of Peshkabir-to-Tawke gas project, DNO will effectively eliminate gas flaring
           throughout its operations

         • Peshkabir cumulative production reached 21 MMbls at H1 2019

Page 7
Foot on accelerator in Kurdistan: Baeshiqa
• First Baeshiqa well targeting shallow Cretaceous reservoirs drilled to 1,511 meters and
suspended pending completion of testing of adjacent Baeshiqa-2 well
• Baeshiqa-2, targeting deeper Jurassic and Triassic reservoirs on the same structure drilled to
3,202 meters and completed
• With rigless testing to commence in second part of August
• Third well, targeting deeper Jurassic and Triassic reservoirs on separate structure to spud early
next year
Page 8Kurdistan drilling schedule Development/Infill Appraisal/Exploration
2019 2020
Country License DNO Interest Operator Field/Well Q1 Q2 Q3 Q4 Q1
Tawke 75% DNO Peshkabir-10
Tawke 75% DNO Peshkabir-11
Tawke 75% DNO Peshkabir-3A
Tawke 75% DNO Peshkabir-12
Tawke 75% DNO Peshkabir-13
Tawke 75% DNO Tawke-54
Tawke 75% DNO Tawke-55
Tawke 75% DNO Tawke-56
Tawke 75% DNO Tawke-58
KURDISTAN
REGION Tawke 75% DNO Tawke-18E
OF IRAQ
Tawke 75% DNO Tawke-23SE
Tawke 75% DNO Tawke-28 S
Tawke 75% DNO Tawke-57
Tawke 75% DNO Tawke-36NE
Tawke 75% DNO Tawke-CWD
Tawke 75% DNO Tawke-14 W
Tawke 75% DNO Jeribe
Baeshiqa 40% DNO Baeshiqa-2
Baeshiqa 40% DNO Zartik
Page 9North Sea update
• DNO in 89 licenses in Norway, 12 in the United Kingdom (UK), one in Ireland and two in the
Netherlands
• Awarded two new operated exploration licenses in the UK in Q2 2019
• Production diversified across 13 fields; nine in Norway and four in the UK
• H1 2019 CWI production averaged 17,800 boepd; 16,900 boepd in Norway and 900 boepd in the
UK
• Ten exploration/appraisal wells and five development/infill wells planned for 2019
Page 10North Sea drilling schedule Development/Infill Appraisal/Exploration
2019 2020
Country License DNO Interest Operator Field/ Prospect Q1 Q2 Q3 Q4 Q1
PL931 40 % Wellesley Songesand
PL767 10 % Lundin Pointer
PL870 20 % Equinor Pabow
PL159 B 32 % Equinor Snadd Outer Outer
PL644 20 % OMV Iris
PL859 20 % Equinor Korpfjell
PL986 20 % Aker BP Nipa
NORWAY PL836 S 30 % Wintershall Dea Bergknapp
PL921 15 % Equinor Gladsheim
PL888 40 % DNO Canela
PL827 S 30 % Equinor Gabriel
PL055 14.26 % Wintershall Dea Brage
PL122 17% Vår Energi Marulk
PL019 20 % Aker BP Ula
PL586 7.5% Neptune Fenja
Page 11Financial review Page 12
DNO financial results – key figures
                         Revenue                                  Netback                                 Operating profit
                        USD million                              USD million                                USD million
           400                                      200                                      250
                               369                                                                               230
                                                                                      177
                                                    180
           350
                                                    160                 155
                                                                                             200
           300                                                    143
                                             266    140
           250                                      120                                      150
                                                          105                  107
                                      204
           200                                      100
                         171
                                                                                                                               99
                 147                                80                                       100
           150
                                                    60                                                     71
           100                                                                                     51
                                                    40                                       50                         38
            50
                                                    20

             0                                       0                                        0
                  Q2     Q3     Q4     Q1     Q2           Q2     Q3     Q4     Q1     Q2           Q2     Q3     Q4     Q1     Q2
                 2018   2018   2018   2019   2019         2018   2018   2018   2019   2019         2018   2018   2018   2019   2019

          • Q2 2019 revenue up 30 percent from Q1 2019
          • Near three-fold increase in Q2 operating profit on back of higher revenues and stable costs

Page 13
Financial summary
USD million Q2 2019 Q1 2019 Q2 2018 H1 2019 H1 2018
Revenue 265.7 204.1 147.0 469.7 289.3
Cost of goods sold -133.8 -117.0 -74.1 -250.7 -149.5
Gross profit 131.9 87.1 72.9 219.0 139.8
Expensed exploration -18.3 -32.8 -11.0 -51.2 -37.8
Administrative expenses 2.3 -15.4 -5.7 -13.1 -15.6
Other operating income/expenses -16.4 -1.0 -4.6 -17.5 -8.3
Impairment of oil and gas assets 0.0 0.0 -0.4 0.0 -1.9
Profit/loss from operating activities 99.4 37.9 51.2 137.3 76.2
Net finance -35.7 -22.2 -15.4 -57.9 -25.9
Profit/loss before income tax 63.7 15.7 35.7 79.4 50.4
Income tax expense 4.3 35.4 6.8 39.7 10.6
Net profit/loss 68.0 51.1 42.5 119.1 60.9
Page 14Operational spend
Annual operational spend
USD million
Capex Expex Lifting
900
800
680
700
600
500
400
293
300 259
200 125
100
0
2016 2017 2018 2019 (projected)
• YTD operational spend of USD 274 million and on track for full year guidance of USD 680 million
• Projected 2019 capex of USD 375 million, up from USD 140 million in 2018
Page 152019 investment program
• Planned capital expenditure in 2019 of USD 375 million, of 2019 forecast capex and expex
which USD 225 million in Kurdistan and USD 150 million in USD million
the North Sea
25
• Kurdistan capital expenditure of USD 225 million of which
half for development wells
150
• Exploration expenditure of USD 25 million related to
Baeshiqa license
440
• Tawke license terms provide for rapid cost recovery 225
40
• Around 50 percent of North Sea capital expenditure focused
on Ula and Fenja
North Sea capex North Sea expex (post-tax)
• North Sea 2019 exploration expenditure of USD 175 million
(USD 40 million post-tax) Kurdistan capex Kurdistan expex
Page 16Q2 2019 cash flow
USD million
700
600
500
310
400
300 77 -68 574
200
254
100
0
Cash at end Q1-2019 Cash from operations Investment activities Tax & finance Cash at end Q2-2019
• Q2 2019 cash flow from operations of USD 77 million, curbed by short-term working capital movements
• Cash increase of USD 319 million in the second quarter from operational cash flow and new bond facility
Page 17Capital structure
Cash deposits Financial assets Equity ratio
USD million USD million Percent
800 800 100
729
700 700 90
640
584 80
600 574 600
70
500 500 61
60 55 57
400 400 50
335 44
40
288 281 40
300 254 300
30
200 200
109 94
20
100 100
10
0 0 0
Q2 Q3 Q4 Q1 Q2 Q2 Q3 Q4 Q1 Q2 Q2 Q3 Q4 Q1 Q2
2018 2018 2018 2019 2019 2018 2018 2018 2019 2019 2018 2018 2018 2019 2019
• Cash balances of USD 574 million at end Q2 2019
• Net interest-bearing debt of USD 434 million
Page 18Stellar track record in bond market
• New USD 400 million bond placement
completed in May 2019 and maturing in Debt maturity profile
May 2024 USD million
600
500
• Rolled over USD 60 million in nominal 400
value of DNO01 bonds, with USD 140 300
million outstanding and maturing in 200
June 2020 100
0
2019 2020 2021 2022 2023 2024 2025
• Rolled over/acquired USD 17.6 million DNO01 DNO02 FAPE01 DNO03 RBL
of FAPE01 bonds
• Active in bond market since 2001 with
16 bond issues over 18 year period
Page 19 Half-year 2019– Interim PresentationImportant notice
This presentation (the “Presentation”) has been prepared and delivered by DNO ASA (“DNO” or the “Company”). Copyright of all published material including photographs, drawings and images in this
document remains vested in DNO and third party contributors as appropriate. Accordingly, neither the whole nor any part of this document shall be reproduced in any form nor used in any manner without
express prior permission and applicable acknowledgements. No trademark, copyright or other notice shall be altered or removed from any reproduction.
The Presentation contains certain forward-looking statements relating to the business, financial performance and results of the Company and/or industry and markets in which it operates. Forward-looking
statements concern future circumstances and results and other statements that are not historical facts, sometimes identified by the words “believes”, “expects”, “predicts”, “intends”, “projects”, “plans”,
“estimates”, “aims”, “foresees”, “anticipates”, “targets”, and similar expressions. Any forward-looking statements and other information contained in this Presentation, including assumptions, opinions and views
of the Company or cited from third party sources are solely opinions and forecasts based on the current expectations, estimates and projections of the Company or assumptions based on information currently
available to the Company, which are subject to risks, uncertainties and other factors that may cause actual events to differ materially from any anticipated development.
Although the Company believes that its expectations and the Presentation are based upon reasonable assumptions, neither the Company, nor any of its subsidiary undertakings or any such person’s officers
or employees provides any assurance that the assumptions underlying such forward-looking information and statements are free from errors nor does any of them accept any responsibility for the future
accuracy of the opinions expressed in this Presentation or the actual occurrence of the forecasted developments. The Company assumes no obligation, except as required by law, to update any forward-
looking statements or to conform these forward-looking statements to our actual results.
Any investment involves risks, and several factors could cause the actual results, performance or achievements of the Company as described herein to be materially different from any future results,
performance or achievements that may be expressed or implied by statements and information in this Presentation, including, among others, risks or uncertainties associated with the Company’s business,
segments, development, growth management, financing, market acceptance and relations with customers. More generally an investment will involve risks related to general economic and business conditions,
changes in domestic and foreign laws and regulations, taxes, changes in competition and pricing environments, fluctuations in currency exchange rates and interest rates and other factors. Should one or
more of such risks or uncertainties materialize, or should underlying assumptions prove incorrect, actual results may vary materially from those described in this Presentation.
DNO is making no representation or warranty, expressed or implied, as to the accuracy, reliability or completeness of the Presentation, and neither DNO nor any of its directors, officers or employees will have
any liability to you or any other persons resulting from your use.
The Presentation speaks and reflects prevailing conditions and views as of 31 July 2019. It may be subject to corrections and change at any time without notice except as required by law. The delivery of this
Presentation - or any further discussions of the Company with any recipient - shall not, under any circumstances, create any implication that the Company assumes any obligation to update or correct the
information herein, nor any implication that there has been no change in the affairs of the Company since such date.
Page 20You can also read