Predictive Modelling Methodologies for Bi-material Strip Warpage - iNEMI
←
→
Page content transcription
If your browser does not render page correctly, please read the page content below
download presentation
Predictive Modelling Methodologies for Bi-material Strip Warpage
a
Jenn An Wang, b Ong. Kang Eu, a Wen Hsin Weng, a Chih Chung Hsu, b Wei Keat Loh, c Ron W. Kulterman, d Haley Fu
a
CoreTech System (Moldex3D), Taiwan
b
Intel Technology Sdn. Bhd, Malaysia
c
Flex Ltd, Austin Tx., USA
d
iNEMI, Shanghai
jennanwang@moldex3d.com
ABSTRACT for validation. For simulation, Moldex3D and FEA-A tools
were used to consider material shrinkage and visco-elastic
Predicting strip warpage after molding process is a challenge for effect. Material shrinkage was composed of curing shrinkage
IC packaging industry because simulation tools need to consider as well as thermal shrinkage, and both shrinkage can be
multiple processes and complex material properties. This paper described by a PVTC model called two domain modified Tait
conducted a strip warpage experiment and simulation. To simplify model, which provide shrinkage based on pressure,
this problem, the models are two bi-material strips (epoxy and temperature, and cure degree. The effects of cure shrinkage
copper). Two strip processes included transfer and curing. One of properties and post mold cure (PMC) process were analyzed.
the strips contained an additional post mold cure (PMC) process. At last the simulation results were compared with the real
The strips were then exposed to a reflow process, and the warpage experiment.
was measured in this process. Pressure-volume-temperature-cure
(PVTC) effect and visco-elastic (VE) with two steps shift factor IMPLEMENTATION DETAILS
model of Arrhenius and WLF (Williams–Landel–Ferry) functions
were considered in the epoxy material model. Fluid mechanics, Simulation Approach
curing kinetics, heat transfer, and structure analysis were combined The in mold stage computation began with filling and
in the analysis sequence. The simulation results were compared with curing analysis for in mold stage process. The fluid dynamics
the experiment metrics. were computed and the mold achieved complete filling by
epoxy. Subsequently, the curing analysis was executed to
Keywords—strip warpage; simulation; assembly process; simulate the in mold cure process and provided initial degree
modeling; mold flow; post mold curing; reflow; visco-elasticity; of cure for out of mold stage computation.
PVTC; bi-material
Moldex3D 2020 and a general FEA tool called FEA-A
INTRODUCTION were commercially available simulation software for out of
mold stage computation. The simulation started at the moment
Strip level is wildly used in electronic packaging in order
of strip ejection from the mold chase. Then the thermal and
to deal with several units in the same time. However, the
curing degree change induced warpage on the strip. Therefore,
challenge in strip level packaging is that it faced warpage issue.
the simulation software should consider temperature
Simulation tools are used in the industries to predict strip
dependent visco-elastic properties and material curing
warpage before the real process to decrease warpage problem.
shrinkage to obtained dependable warpage results.
Unfortunately, simulation tools usually meet inconsistency
issues comparing to real results and engineers cannot tell the Strip Model
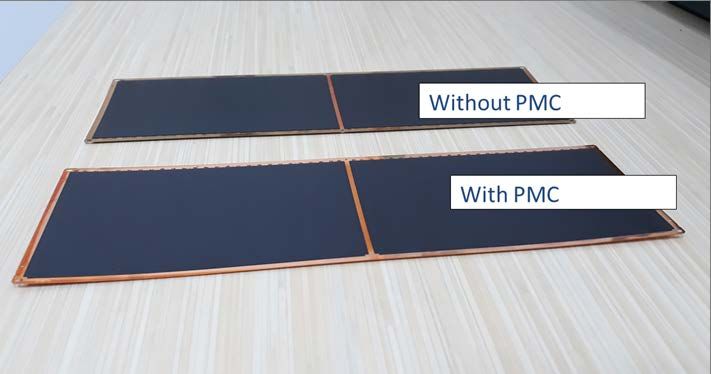
root cause. Therefore it is more important to investigate every The Bi-material model contained epoxy and copper strip,
physical models in the simulation tools and validate as shown in Fig. 1. The copper strip was 240 x 74 mm and two
simulation tools with real simple strip. 115.5 x 66 mm epoxy were transferred onto the copper strip.
One challenge of the strip warpage simulation is that the The thickness of the epoxy and copper were 0.35 mm and
visco-elastic properties dominates the epoxy properties and 0.255 mm. The model had no constraint but the anchor plane
hence affect the warpage [1][2]. Therefore, time and was set to ensure the convergence.
temperature dependent visco-elastic models were used to
ensure the accuracy of the warpage results. Moreover, typical
epoxy compounds were thermoset materials. The thermoset
material specific volume decreases when the material
undergoes chemical cross linking reaction, which is also
called curing for IC packaging. The studies point out that
electronic package warpage should not only consider the
thermal expansion effect but also curing effect to precisely
predict the warpage [3][4][5]. However, conventional
simulation software can only compute thermal expansion, so Fig. 1 Bi-material strips which consist of epoxy and copper
researchers develop effective CTE to depict epoxy curing The Moldex3D and FEA-A simulation models were
behavior [6]. This study apply a pressure-volume- constructed according to the real geometry. The mesh size is
temperature-cure (PVTC) model to fully describe overall 0.5 mm in both x and y direction. The mesh was divided by 2
strain[7]. elements along the thickness for both epoxy and copper . The
This paper conducted an experiment of bi-material strips mesh sensitivity test was done to ensure the mesh
with simple geometry and the strips warpage was measured convergence.
Viscos-elastic Model transition temperature point and shift the specific volume. The
The epoxy was a typical visco-elastic material. The two Tait modified model is applied in Moldex3D. While FEA-
modulus depends on relaxation time and temperature change, A does not equipped with this function, two stage CTE was
so the Generalized Maxwell model with time-temperature rather used to simulate the fully cured state of the mold.
shift factor (TTS) was used to describe shear and bulk
modulus. In general, there are two models to describe TTS 100
according to the relation between reference temperature and 90
T= 200oC
80
temperature, which were Arrhenius type equation and WLF
70
equation. The Arrhenius type equation is suitable for
Conversion(%)
T= 175oC
60
temperature below reference temperature, while WLF 50 T= 150oC
equation is suitable for temperature above reference 40
temperature. Therefore, this study using two steps shift factor 30
model to describe overall shift factor, as shown in Fig. 2. 20
10
The overall viscoelastic behavior for epoxy in this study is 0
shown in Fig. 3. The shear modulus keeps decreasing as 0 100 200 300 400
higher relaxation time. Moreover, the time-temperature shift Time (sec)
factor affects the shear modulus. Higher temperature lead
shear modulus dropping to plateau with smaller relaxation Fig. 4 Curing kinetics at different temperatures for the epoxy
time. 0.54
Uncured state, 0.1 MPa
1.00E+12 0.535
Specific Volume (cc/g)
Cured state, 0.1 MPa
1.00E+09 0.53
Uncured state, 5 MPa
1.00E+06 Cured state, 5 MPa
Shift Factor aT
1.00E+03 0.525
1.00E+00 0.52
Arrhenius equation
1.00E-03
Two steps shift factor 0.515
1.00E-06
model
1.00E-09 WLF equation 0.51
1.00E-12 25 75 125 175 225
Temperature (℃)
25 65 105 145 185 225
Temperature (℃) Fig. 5 PVTC curves for the epoxy
Fig. 2 Shift factor for the epoxy Experiment Details
1.2E+11 The copper strips were initially put in the mold chase and
T = 25 ℃
1.0E+11 did the epoxy transfer. Afterwards, the strips underwent 175
T = 150 ℃
℃ in mold cure for 90 sec and were released from the mold.
Shear Modulsu (dyne/cm2)
8.1E+10 T = 260 ℃ The experiment was conducted with two kind of time
6.1E+10
temperature profile. Two of them cooling down from 175 ℃
to 25 ℃ in 600 sec as the strip out of mold. First time
4.1E+10 temperature profile was without PMC and underwent an 1000
2.1E+10
sec reflow. The temperature surge from 25 ℃ to 260 ℃ in 500
sec and then cooling down to 25 ℃ in another 500 sec, shown
6.0E+08 in Fig. 6. Second time temperature profile was with 14280 sec
1.0E-30 1.0E-20 1.0E-10 1.0E+00 1.0E+10 1.0E+20 175 ℃ PMC and two 1000 sec reflow afterwards, shown in
Time (sec)
Fig. 7. The reflow profiles were the same in first and second
Fig. 3 Shear modulus versus time curves for the epoxy time temperature history. Shadow Moire method was used in
the reflow stage to measure the displacement versus
PVTC Model temperature.
PVTC describes the relation between specific volume,
300
pressure, temperature and curing degree. Curing degree in
PVTC is calculated by a curing kinetics model called 250
combined model. The curing kinetics of the epoxy in this
Temperature (℃)
200
study is shown in Fig. 4. Rapid conversion as the material
temperature higher than 175℃. 150
The two domain modified Tait model is used to describe 100
PVTC. The uncured epoxy shrinks as changing to the cured 50
epoxy, induced by the material cross-linking, shown in Fig. 5.
0
Other than curing effect, temperature change brings out 0 400 800 1200 1600 2000 2400
thermal stain as a result of specific volume change. The cure Time (sec)
and uncured epoxy has different transition point. The
transition point for uncured and cured material is about 40℃ Fig. 6 Out of mold ambient temperature vs. time (Without
and 140℃, individually. Pressure will slightly affect the PMC process)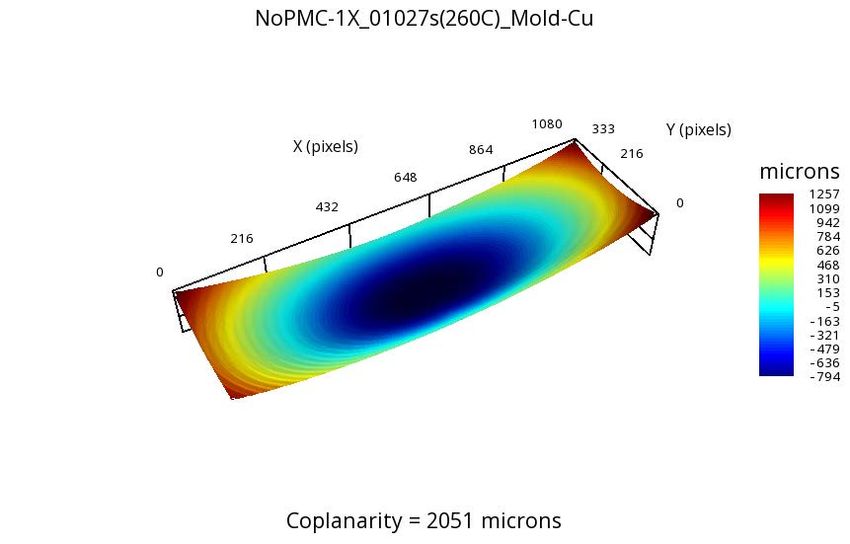
300                                                                                12
                                                                                                                                   Moldex3D fully cured
                                                                                                                                   FEA-A fully cured
                    250                                                                                8                           Moldex3D 90 sec cured

                                                                       Z displacement (mm)
                                                                                                                                   Moldex3D 50 sec cured
  Temperature (℃)

                    200                                                                                4                           Moldex3D 0 sec cured

                    150
                                                                                                       0
                    100
                                                                                                       -4
                     50
                                                                                                       -8
                      0
                          0   5000   10000     15000   20000                                    -12
                                       Time (sec)                                                           0   500    1000         1500       2000           2500
                                                                                                                              Time (s)
  Fig. 7 Out of mold ambient temperature vs. time (With
PMC process)                                                          Fig. 8 Strip simulation Z displacement results (Without
                                                                    PMC process)
                                     RESULTS
Simulation Results                                                                            100
    To identify the warpage magnitude, the z-coordinate
                                                                                                       80

                                                                     Curing degree (%)
displacement results on the top center of the bi-material strip
                                                                                                                                Moldex3D fully cured
were recorded. If z displacement is positive, the shape is                                                                      Moldex3D 90 sec cured
                                                                                                       60
convex, instead, the shape is concave. The first step of the                                                                    Moldex3D 50 sec cured
simulation is to check the consistency between two software.                                           40
                                                                                                                                Moldex3D 0 sec cured
The without PMC process case was simulated by both
software with fully cured initial condition. Both software                                             20
obtained similar results, as shown in Fig. 8. The strip was
convex at room or reflow peak temperature and was concaved                                              0
between 175℃ and 69℃, and the concave peak value was -                                                      0   500    1000      1500          2000           2500
                                                                                                                          Time (sec)
3.96 mm. The convex trend peak values were 4.86 mm and
3.14 mm, when strip temperature were 25℃ and 260℃,                    Fig. 9 Strip simulation curing degree results (Without
individually.                                                       PMC)
    Different without PMC process cases were simulated with                                             8
different in mold cure time. 0 sec, 50 sec, and 90 sec in mold
                                                                                                                       Moldex3D fully cured
cure time lead to 0 %, 44.9 %, and 71.9 % initial curing ratio                                                         Moldex3D 90 sec cured
at out of mold process. The average curing degree versus time
                                                                                 Z displacement (mm)

                                                                                                        4              FEA-A fully cured
profile is as Fig. 9. The curing degree surged at beginning of
the 100 sec, because the strip temperature remained high
enough to induce curing reaction. As the temperature cooling                                            0
down, the curing reaction stopped and curing degree
remained the same at 400 ~ 900 sec. The curing reaction                                                -4
reactive when temperature surged at reflow, and fully cured
achieved for all cases at about 1200 sec.
                                                                                                       -8
    Fig. 8 showed the warpage with different in mold cure                                                   0   5000     10000         15000          20000
time. Z displacement amplitude shift downward as initial                                                                    Time (sec)
curing degree decrease. The 0 sec cured case had 18% of
epoxy uncured from 250 ~ 1000 sec, which was a significant             Fig. 10 Strip simulation displacement results (With PMC
portion and lead to different thermal expansion coefficient.        process)
Therefore, 0 sec cured case warpage profile is different
comparing to other curves. At last, curing effect contributed       Experiment results
6.21 mm z displacement difference between 0 sec cured and               The z displacement was measured in the reflow process
fully cured cases at 2600 sec. The curing effect provided extra     for every 25℃ temperature change on surface of the strip. The
shrinkage to the epoxy and lead to the z displacement shift.        measurement results in Fig. 11 showed that similar z
                                                                    displacement reflow results were obtained regardless of
    With PMC process cases were simulated by Moldex3D for           different time-temperature history before reflow. This
fully cured as well as 90 sec cured and FEA-A for fully cured.      phenomenon was agreed with the simulation. The strips were
The Moldex3D and FEA-A fully cured warpage profiles were            convex above 175℃ and reached 1.96 mm at 260℃. On the
consistent as shown in Fig. 10. The z displacement peak value       other hand, the strips were concave about -1.5 mm below
was about 6 mm existed when ambient temperature was 25℃             125℃.
before and after PMC. The 90 sec cured results showed
negative z displacement shift in contrast to fully cured results.      Comparing the experiment results with the simulation in
The warpage at reflow stage for the two time temperature            Fig. 11, the simulation z displacement results changed
profile was almost the same. Which implied that the PMC             dramatically from convex to concave from 25 ℃ to 125 ℃.
process had little effect on warpage.                               Fully cured results z displacement dropped from 4.58 mm to -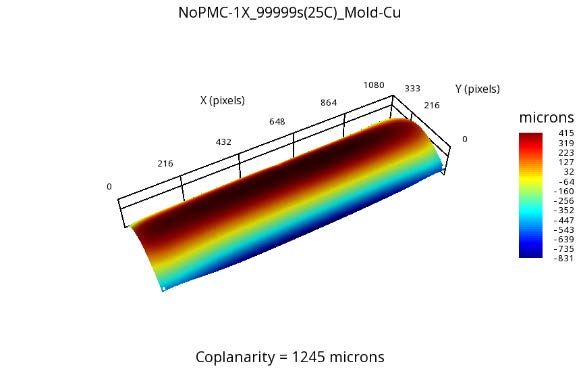
2.50 mm and 90 sec cured results z displacement dropped                                                                                                       (a)
from 1.06 mm to -1.20 mm. Both trends inconsistent with the
experiment warpage. The experiment in mold cure time was
about 90 sec. The experiment z displacement was 1.96 mm at
260℃, falling in between the z displacement of fully cured
3.03 mm and 90 sec cured 1.08 mm simulation results.
    Fig. 12 showed warpages shape of Shadow Moire
measurement. The simulation shape was isotropic and
consistent with experiment at 260℃. However, the
experiment result at 25℃ showed asymmetric shape warpage,
different from the simulation of isotropic shape warpage. The                                                                                                  (b)
effect, which results in asymmetric shape at low temperature,
was not clear in this study. The authors thought that it may
cause by the constraint from mold chase in the process or
unobservable detachment between epoxy and copper.
                         CONCLUSIONS
    This study did the bi-material strip warpage simulation and
experiment. PVTC and visco-elastic effect with TTS were
taken account in the simulation. The simulation results
showed that curing had significant impact on warpage                                             Fig. 12 Without PMC process Z displacement Shadow
amplitude and the PMC process didn’t affect warpage trend.                                   Moire measurement at reflow stage (a) 260℃ (b) 25℃ (epoxy
Besides, the simulation can capture the warpage at high                                      facing down)
temperature. While simulation and experiment warpage
results at low temperature were inconsistent, the problem                                                             ACKNOWLEDGMENT
should be further investigated.                                                                  The authors would like to acknowledge the iNEMI
                                                                                             sponsors for creating a conducive environment for cross
                                             Experiment with PMC 1st reflow
                                                                                             sharing of knowledge to enhance the industry best known
                                             Experiment with PMC 2nd reflow                  method in enhancing predictive modeling that mimic the real
                        8
                                             Experiment without PMC reflow                   assembly process and material changes.
  Z displacement (mm)

                                             Moldex3D without PMC 90 sec cured reflow
                        4                    Moldex3D without PMC fully cured reflow                                       REFERENCES
                                                                                             [1] Lin, Wei, and Min Woo Lee. "PoP/CSP warpage evaluation and
                        0                                                                         viscoelastic modeling." Electronic Components and Technology
                                                                                                  Conference, 2008. ECTC 2008. 58th. IEEE, 2008.
                                                                                             [2] H. Sejin, et al. Integrated flow analysis during filling and post-filling
                        -4                                                                        stage of semiconductor encapsulation. TRANSACTIONS-
                                                                                                  AMERICAN SOCIETY OF MECHANICAL ENGINEERS
                                                                                                  JOURNAL OF ELECTRONIC PACKAGING, 2000, 122.1: 20-27.
                        -8
                             25   75   125   175   220   260   220   175   125   75     25   [3] Kelly, et al. "Importance of Molding Compound Chemical Shrinkage in
                                                    Time (s)                                      the Stress and Warpage Analysis of PQFP’s" TRANSACTIONS ON
                                                                                                  COMPONENTS, PACKAGING, AND MANUFACTURING
    Fig. 11 Comparison of measured and simulation Z                                               TECHNOLOGY-PART B, VOL. 19, NO. 2, IEEE, 1996.
displacement results                                                                         [4] Hu Guojun, Luan Jing-En and Chew Spencer. "Characterization of
                                                                                                  chemical cure shrinkage of epoxy molding compound with application
                                                                                                  to warpage analysis" JOURNAL OF ELECTRONIC PACKAGING,
                                                                                                  2009, 131.
                                                                                             [5] C.C. Wang , et al. "Investigation on the P-V-T-C property
                                                                                                  characterization and its importance on IC encapsulation material
                                                                                                  application", AIP Conference Proceedings, 2019.
                                                                                             [6] M.S. Chae, et al. "Strip warpage analysis of a flip chip package
                                                                                                  considering the mold compound processing parameters" Electronic
                                                                                                  Components & Technology Conference, 2013.
                                                                                             [7] K.E. Ong, et al. “Molded Electronic Package Warpage Predictive
                                                                                                  Modelling Methodologies” Molded Electronic Package Warpage
                                                                                                  Predictive Modelling Methodologies, 2019.
You can also read