GLOBAL SEASONAL CLIMATE UPDATE - TARGET SEASON: June-July-August 2021 - WMO LRF MME
←
→
Page content transcription
If your browser does not render page correctly, please read the page content below
WEATHER   CLIMATE   WATER

             GLOBAL SEASONAL
              CLIMATE UPDATE
                    TARGET SEASON: June-July-August 2021

                             Issued: 26 May 2021

                                                           1
Summary
Observed sea surface temperatures (SSTs) in the central tropical Pacific were in a weak La Niña condition during
February-April 2021. The Indian Ocean Dipole (IOD) remained in a near-neutral condition and is predicted to continue
being neutral. The below-normal sea-surface temperature anomalies in the Niño 3.4 and Niño 3 regions are predicted
to return towards normal in the June-August 2021 season. Farther west in the Niño 4 region, the sea surface
temperature anomaly is also predicted to weaken to near-zero. The June-August 2021 prediction, therefore, indicates
a return to near-normal conditions in the central tropical Pacific.
Apart from a large area of the tropical eastern Pacific Ocean, sea-surface temperatures over most of the Pacific and
Indian oceans are expected to be near or above-average for June-August 2021. Sea surface temperatures between
about 30o and 60oN in the Pacific and Atlantic Oceans are also expected to be normal to above-normal, except over
the North Sea. The continuing impacts of the 2020/21 La Niña are expected to diminish as La Niña returns to neutral,
and the widespread warmer global sea-surface temperature anomalies more generally are predicted to dominate the
forecast of air temperatures for June – August 2021. Air temperature anomalies over land are expected to be strongest
in the Northern Hemisphere. Positive temperature anomalies are expected over almost the whole hemisphere, with
the only notable exceptions in north-western Europe, south Asia, and the northern part of South America, extending
into the southern Caribbean. The largest land air temperature anomalies are expected over the central western part
of North America, and the far northern part of Asia, but there is also high consistency in the predictions of an
anomalously warm June – August over the northern Caribbean, the Arabian Peninsula, part of central Asia, and far
eastern Asia. In near-equatorial latitudes, positive temperature anomalies are predicted with high consistency in the
Maritime subcontinent, along the south coast of West Africa, extending into central and eastern Africa and over
eastern parts of South America. In the Southern Hemisphere, most of the land areas are predicted to have weak
positive air temperature anomalies, but with the most notable exceptions of some of the Indian Ocean and South
Pacific islands, model consistency is only moderate. Below-normal temperatures are predicted only for areas over
the sea, including in the vicinity of the lingering La Niña, over the North Sea, and to the south of Madagascar.
The general weakness of predicted rainfall anomalies for June-August 2021 are typical of the absence of any strong
sea-surface temperature anomalies in the tropical oceans. Nevertheless, there are some increased chances of
unusually dry conditions in parts of the South Pacific and anomalously wet conditions to the west and south-west that
are canonical impacts of the last phases of the latest La Niña. Along the equator across most of the Pacific Ocean,
probabilities are highest for near-normal rainfall. Over the Caribbean there is a moderate to strong indication of
below-normal rainfall, and a band of above-normal rainfall immediately to the south and just to the north of the
equator. Increased chances of below-normal precipitation are also indicated over many parts of South America south
of the equator, over much of the northern Mediterranean and surrounding areas, over parts of central and western
North America, over parts of Central Africa, and over much of the east coast of Africa. Other areas of weakly increased
probabilities for above-normal rainfall include some scattered locations in high latitudes of the northern hemisphere
and in some parts of eastern and southern Asia.

                  Surface Air Temperature, JJA 2021                       Precipitation, JJA 2021

                                                                                                                     2
Figure 1. Probabilistic forecasts of surface air temperature and precipitation for the season June-August 2021. The tercile category with the
highest forecast probability is indicated by shaded areas. The most likely category for below-normal, above-normal and near-normal is depicted
  in blue, red and grey shadings respectively for temperature, and orange, green and grey shadings respectively for precipitation. White areas
                            indicate equal chances for all categories in both cases. The baseline period is 1993–2009.

1.          Observations: February-April 2021

In the following sections, observed temperature and precipitation patterns for the period February-April 2021 are
briefly described. For more detailed information about regional and local climate anomalies, the reader is referred
to the concerned WMO Regional Climate Centres (RCCs) or RCC Networks, listed in Section 5.
1.1         Large-scale sea surface temperature (SST) indices
During February-March 2021, the four Niño sea surface temperature (SST) indices in the central and eastern Pacific
were in negative territory, however, their amplitude declined from their stronger negative values during winter (for
example, from December 2020-January 2021). The observed SST conditions characterized a decaying La Niña in the
equatorial tropical Pacific. The Indian Ocean Dipole (IOD) over the observed period was near-zero. The North Tropical
Atlantic (NTA) SST index was near-zero, and the South Tropical Atlantic (STA) SST index was weak negative.

 Month                              Niño 1+2        Niño 3          Niño 4          Niño 3.4        IOD             NTA             STA
 February 2021                      -0.7            -0.6            -1.0            -0.9            0.18            0.2             -0.4
 March 2020                         -0.3            -0.4            -0.6            -0.5            0.1             0.0             -0.4
 April 2021                         -0.8            -0.7            -0.2            -0.5            0.28            -0.2            -0.1
 February-April 2021                -0.6            -0.6            -0.6            -0.6            0.2             0.0             -0.3

      Table 1. Large-scale oceanic indices (°C). Anomalies are with respect to the 1981–2010 average. (Source: U.S. Climate Prediction Center)

1.2         Observed temperature
Over land, temperature anomalies across the globe continued their tendency of warmer-than-normal conditions for
the season of February-April 2021 (Figure 2, top), and in general, above-normal temperatures dominated the global
land areas. The most strongly positive land temperature anomalies occurred over the Arabian Peninsula, central and
eastern Asia, and the northeast region of North America (including Greenland). Positive temperature anomalies also
occurred over much of South America, the Indian subcontinent, and Africa. February-April 2021 also had notable
regions with below-normal temperature anomalies including eastern Europe and north Asia, Australia, and north-
western and central regions of North America.
Over the oceans, the eastern equatorial Pacific and southwest Indian Ocean (off the southeast coast of southern
Africa) had cooler-than-normal temperatures. In the extratropical southern oceans near-to-below average
temperatures generally prevailed. SSTs in the equatorial central Pacific indicated a weak La Niña condition, with
positive anomalies in the western equatorial Pacific and negative anomalies in the central and eastern Pacific - a
pattern that indicates enhanced zonal SST gradients across the equatorial Pacific. SST anomalies throughout the
extratropical North Pacific and central Atlantic along 30oN were generally positive. A notable region having the largest
observed warm ocean temperature anomaly was in the northeast Pacific.
Consistent with the seasonal mean anomalies, warm extremes dominated (Figure 2, bottom panel). Warm extremes
(exceeding all seasonal mean temperatures observed during 1981–2010) occurred over southernmost South America
and central Africa between equator and 15oS. No significant extreme cold temperature was found over land areas.
Some oceanic regions also had warm extremes, notably sub-tropical northwest Pacific, extratropical northeast Pacific
and north-western Atlantic off the coast of North America.
                                                                                                                                                 3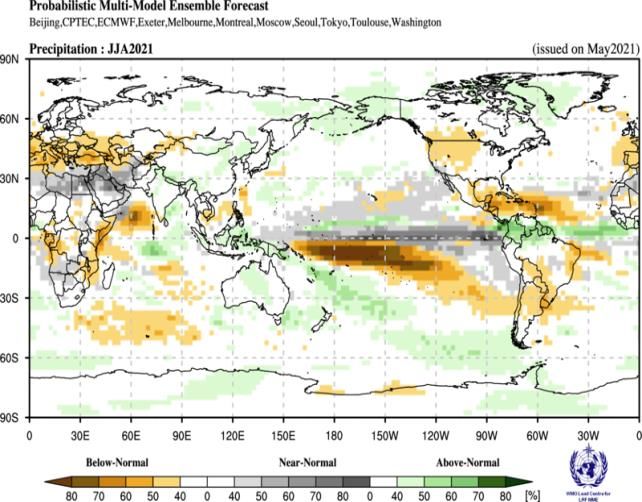
Figure 2. Observed February-April 2021 near-surface temperature anomalies relative to 1981–2010 (top). The Cooler than Normal, Near Normal,
  and Warmer than Normal shadings on the percentile map (bottom) indicate that seasonal mean anomalies were in the bottom, middle, and
upper tercile of the 1981–2010 distribution, respectively. Regions with anomalies in the lowest and highest decile (or 10%) of the distribution are
marked as Much Cooler than Normal and Much Warmer than Normal, respectively. The Cold Extreme and Warm Extreme shadings indicate that
   the anomalies exceeded the coldest and warmest temperature values of the 1981–2010 period for the season. Grey shading indicates areas
                            where observational analysis was not available. (Source: U.S. Climate Prediction Center).

                                                                                                                                                 4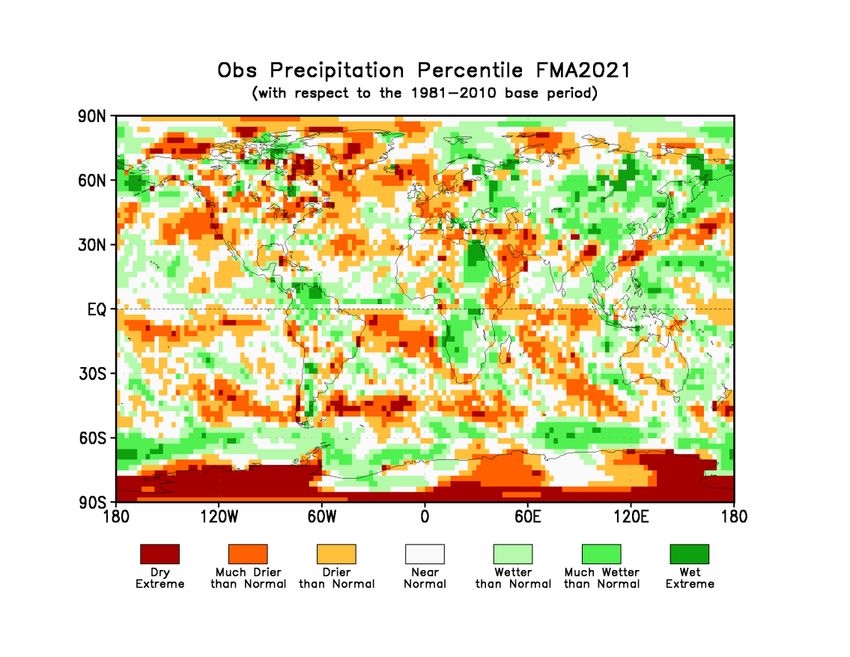
Figure 3. Observed precipitation anomalies for February-April 2021, relative to 1981–2010 base period (top). The Drier than Normal, Near
 Normal and Wetter than Normal shadings on the percentile map (bottom) indicate that seasonal mean anomalies were in the bottom, middle,
and upper tercile of the 1981–2010 distribution, respectively. Regions with anomalies in the lowest and highest decile (or 10%) of the distribution
 are marked as Much Drier than Normal and Much Wetter than Normal, respectively. The Dry Extreme and Wet Extreme shadings indicate that
                          the anomalies exceeded the driest and wettest values of the 1981–2010 period for the season.
                                                    (Source: U.S. Climate Prediction Center).

                                                                                                                                                 5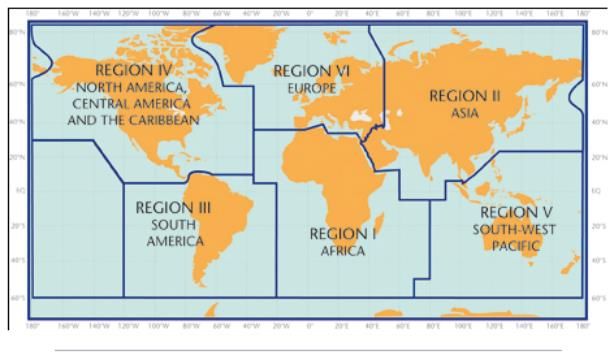
1.3 Observed precipitation
For February-April 2021, the largest negative precipitation anomalies were in the equatorial Pacific near the date-
line extending into the western Pacific with a narrower equatorial band extending into the eastern Pacific, a band
extending into the southern Pacific towards South America, equatorial and southern Indian Ocean, and eastern region
of equatorial Atlantic. Below-normal precipitation anomalies also occurred in the northwest Atlantic. West of the
negative anomalies in the equatorial western Pacific, positive precipitation anomalies extended into the Indonesian
Archipelago and sub-tropical western Pacific.
Below-normal precipitation anomalies generally dominated western coastal regions of North America, southern
Greenland, and Arabian Peninsula. Precipitation was above-normal in central Africa, and northwest South America.
No large-scale systematic regions with dry or wet extremes (precipitation below or above all seasonal totals observed
during 1981-2010) over land occurred.
2. Potential evolution of the state of the climate over the next three months
(June-August 2021)
2.1 Large-scale SST-based indices, June-August 2021
Month Nino 1+2 Nino 3 Nino 4 Nino3.4 IOD NTA STA
June 2021 0.0±0.3 0.0±0.2 0.0±0.1 -0.1±0.1 -0.1±0.3 0.2±0.2 0.1±0.1
July 2021 0.2±0.3 0.1±0.3 -0.1±0.2 -0.1±0.2 -0.1±0.3 0.3±0.2 0.1±0.1
August 2021 0.2±0.3 0.6±0.3 -0.1±0.2 -0.1±0.3 -0.2±0.3 0.3±0.2 0.2±0.1
June-August 0.1±0.3 0.1±0.3 -0.1±0.2 -0.1±0.2 -0.1±0.3 0.2±0.2 0.2±0.1
2021
Table 2: Multi-model forecasts for oceanic indices (℃), with standard deviation. Values are the equal-member-weighting average of those
derived, using each GPC models own hindcast climate mean, from the GPCs supplying SST forecasts (GPC CPTEC, ECMWF, Exeter, Melbourne,
Montreal, Moscow, Offenbach, Seoul, Tokyo, Toulouse, Washington). The standard deviation is calculated on all ensemble members. The
latitude/longitude bounds of the regions are given in the supplementary information section.
Observed sea surface temperatures in the central tropical Pacific were in the last stages of La Niña conditions during
February – April 2021. The below-normal sea-surface temperature anomalies in the Niño 3.4 and Niño 3 regions are
predicted to be close to zero reaching values of approximately -0.1oC (Niño 3.4) and 0.1 (Niño 3) during the June-
August 2021 season. Farther west in the Niño 4 region, the sea surface temperature anomaly is also predicted to be
close to zero, with a value of about -0.1C. The JJA 2021 prediction, therefore, indicates a return to near-normal
conditions in the central tropical Pacific. The IOD is predicted to be close to zero over the three months JJA 2021. In
the equatorial Atlantic, SSTs are predicted to be slightly above average in both the northern (NTA) and the southern
(STA) areas during the season.
2.2 Predicted temperature, June-August 2021
For information on the construction of the multi-model forecast maps refer to the supplementary information section.
(Note: Maps indicating forecast consistency among GPC models are available in the supplementary information 1).
1
File with supplementary information can be downloaded from
https://ftp.cpc.ncep.noaa.gov/mingyue/GSCUWMO/Forecasts/GSCU_JJA2021_supplementary_info_LC-LRFMME.docx
6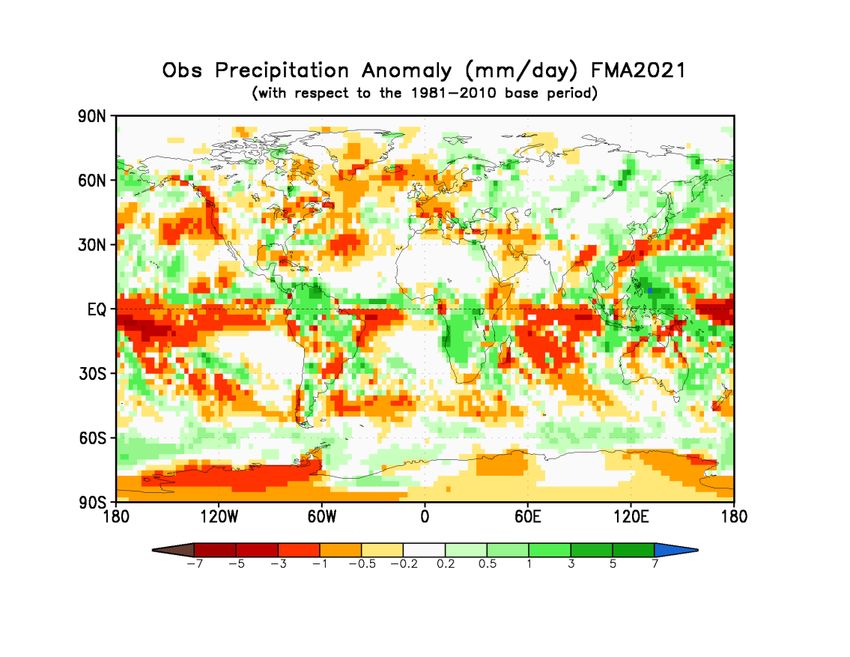
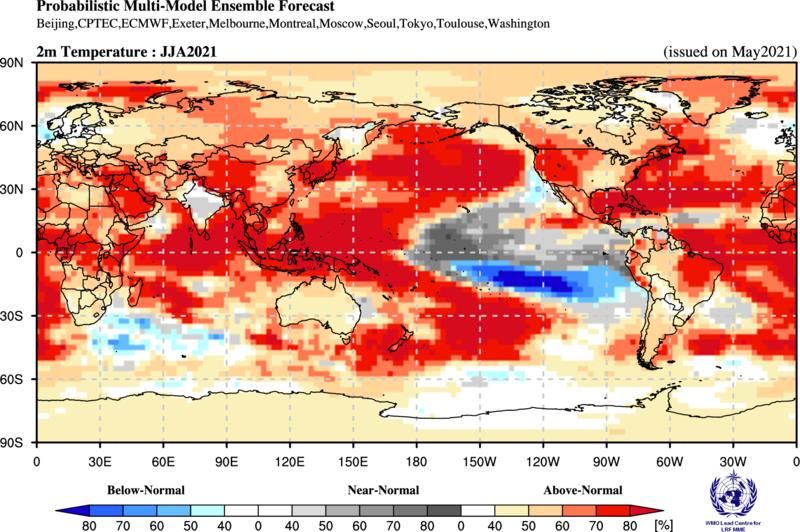
Figure 4. Probabilistic forecasts of surface air temperature for June-August 2021. The tercile category with the highest forecast probability is
indicated by shaded areas. The most likely category for below-normal, above-normal and near-normal is depicted in blue, red and grey shadings
 respectively. White areas indicate equal chances for all categories in both cases. The baseline period is 1993–2009. Figure is generated by The
                                         WMO Lead Centre for Long-Range Forecast Multi-Model Ensemble.

The continuing impacts of the 2020/21 La Niña are expected to diminish as La Niña returns to neutral, and the
widespread warmer global sea-surface temperature anomalies more generally are predicted to dominate the forecast
of air temperatures for June – August 2021. Air temperature anomalies over land are expected to be strongest in the
Northern Hemisphere. Positive temperature anomalies are expected over almost the whole hemisphere, with the
only notable exceptions in north-western Europe, south Asia, and the northern part of South America, extending into
the southern Caribbean. The largest land air temperature anomalies are expected over the central western part of
North America, and the far northern part of Asia. The models are most consistent in their predictions of an
anomalously warm June – August 2021 over the said part of North America. Consistency is also high over the northern
Caribbean, the Arabian Peninsula, part of central Asia, and far eastern Asia, although the predicted positive anomalies
are not as high in these areas. In near-equatorial latitudes, positive temperature anomalies are predicted with high
consistency in the Maritime subcontinent, along the south coast of West Africa, extending into central and eastern
Africa and over eastern parts of South America. In the Southern Hemisphere, most of the land areas are predicted to
have weak positive air temperature anomalies, but with the most notable exceptions of some of the Indian Ocean
and South Pacific islands, model consistency is only moderate. Below-normal temperatures are predicted only for
areas in the vicinity of the lingering La Niña, and in small areas over the sea, including to the south of Madagascar,
the North Sea, near the west coast of North America, and in a few areas along about 60 oS.

RA I (Africa): Enhanced probabilities of above-normal temperature are indicated over of the whole of mainland Africa
plus Madagascar. Probabilities are strongest in western North Africa, and in near equatorial regions extending from
the south coast of West Africa through to the Greater Horn. Southern Africa experiences its winter season during
June-August, and probabilities of above-normal temperature here are weaker than for most of the rest of the
continent, but still increased. Model-to-model consistency is moderate to high over the entire continent.

                                                                                                                                                7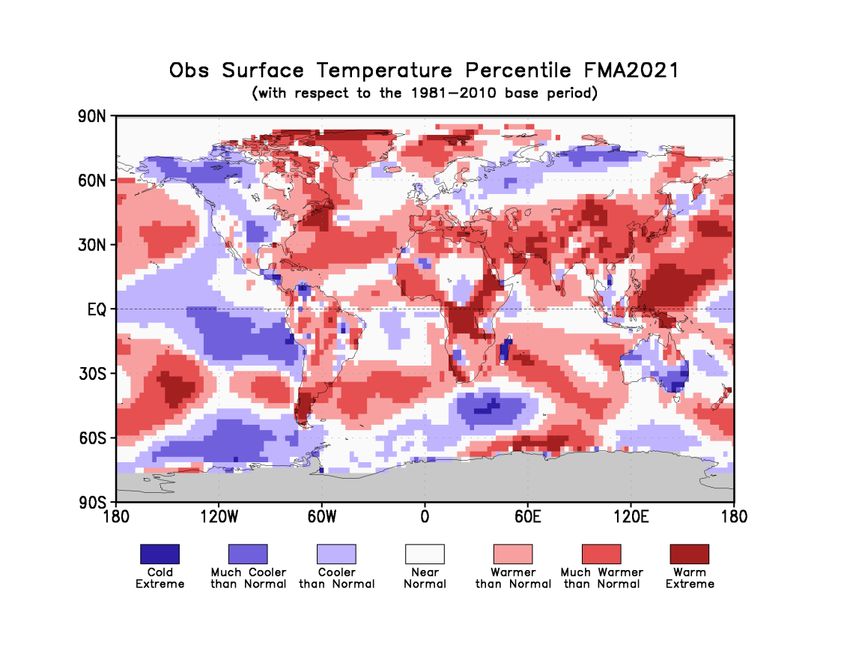
RA II (Asia): Enhanced probabilities for above-normal temperature are indicated over the whole of Asia, except for
the south Asian peninsula, where near-normal temperatures are the most likely outcome. The probabilities for above-
normal temperature are highest over the Arabian Peninsula, the maritime continent and south-east Asia, the far parts
of east Asia, and along about 90 oE north of the Himalayas. Model-to-model consistency for these same regions is
moderate to high, although there is little agreement about the signal over the south Asian peninsula.
RA III (South America): Enhanced probabilities for above-normal temperature are indicated over most of South
America. The increases in probability are largest over the north-eastern part of the subcontinent, and along a narrow
band over the Andes north of about 15 oN. The level of model consistency is moderate to strong over most areas and
is particularly strong south of about 30 oS. This same area experienced an unusually warm February-April. Immediately
to the north of 30oS there is a small area west of the Andes where model consistency is weak, and the there is no
clear signal in the air temperature. Over the far northern part of South America, there are increased probabilities of
near-normal and above-normal temperature.
RA IV (North America, Central America and the Caribbean): There are enhanced probabilities for above-normal
temperature over all of North America as well as over Central America and the Caribbean north of about 15oN. South
of 15oN there are increased probabilities of near-normal to above-normal temperatures. The probabilities for above-
normal are highest over much of the western half of North America and over the northern part of the Caribbean and
neighbouring areas of Central America, but in the far north-eastern part of South America the increase in probabilities
for above-normal temperature is weak. Model-to-model consistency is high over most of the region except for the
southernmost areas, and also in some parts of the Arctic; in both these areas consistency is moderate.
RA V (Southwest Pacific): Strongly enhanced probabilities for above-normal temperature are predicted in a band from
north of Australia, extending to the central South Pacific, and along about 40 ºS from New Zealand towards the
eastern Pacific to about 120 ºW. The Indonesian Archipelago and many of the southwest Pacific islands, lie within
this band of above-normal temperatures, and model-to-model consistency is strong over most of the area. There is a
sharp transition to an area of predicted below-normal temperature to the northeast, which closely represents the
distribution of predicted negative sea-surface temperature anomalies associated with the decaying La Niña conditions.
Model-to-model consistency in this cold area is strong. Over most of Australia, there are weakly enhanced
probabilities of above-normal temperature with weak consistency in the temperature predictions. Over the east coast
of Australia there is an area of increased probability of near-normal temperature with weak model consistency.
RA VI (Europe): The probabilities for above-normal temperature are increased over most of Europe, but not as
strongly for much of the rest of the northern hemisphere. Probabilities are highest and model-to-model consistency
strongest in southern Europe, and also over Greenland. Over other parts of north-western Europe and extending
along about 60ºN into eastern Europe, there is a weak indication of increased probabilities of below-normal
temperature, but model-to-model consistency is mostly weak to moderate.

2.3     Predicted precipitation, June-August 2021

                                                                                                                     8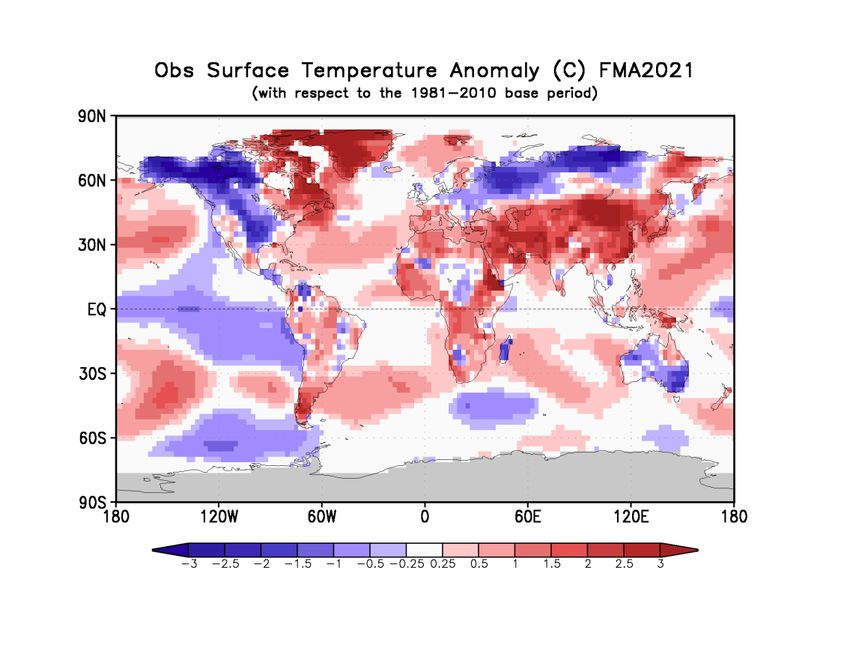
Figure 5. Probabilistic forecasts of precipitation for the season for June-August 2021. The tercile category with the highest forecast probability
    is indicated by shaded areas. The most likely category for below-normal, above-normal and near-normal is depicted in orange, green and grey
                                shadings respectively. White areas indicate equal chances for all categories in both cases.
            The baseline period is 1993–2009. Figure is generated by The WMO Lead Centre for Long-Range Forecast Multi-Model Ensemble.

The general weakness of predicted rainfall anomalies for June-August 2021 are typical of the absence of any strong
sea-surface temperature anomalies in the tropical oceans. Nevertheless, there are some increased chances of
unusually dry conditions in parts of the South Pacific and anomalously wet conditions to the west and south-west that
are canonical impacts of the last phases of the latest La Niña. Along the equator across most of the Pacific Ocean,
probabilities are highest for near-normal rainfall. Over the Caribbean there is a moderate to strong indication of
below-normal rainfall, and a band of above-normal rainfall immediately to the south and just to the north of the
equator. Increased chances of below-normal precipitation are also indicated over many parts of South America south
of the equator, over much of the northern Mediterranean and surrounding areas, over parts of central and western
North America, over parts of Central Africa, and over much of the east coast of Africa. Other areas of weakly increased
probabilities for above-normal rainfall include some scattered locations in high latitudes of the northern hemisphere
and in some parts of eastern and southern Asia.
,
RA I (Africa): Enhanced probabilities for below-normal precipitation are predicted over much of the far eastern part
of Africa, most notably near the equator, over parts of Central Africa below the equator, and over the far north-
western part of North Africa. Model-to-model consistency is moderate to strong over most of these areas. Over much
of the rest of Africa north of about 20ºN and in central and western parts of southern Africa, the forecast indicates
increased probabilities for near-normal rainfall, but most of these areas are desert and/or experiencing their dry
season. The southern coast of West Africa is indicated to have weakly increased chances of above-normal rainfall,
but the model-to-model consistency for this signal is low.

                                                                                                                                                     9
RA II (Asia): There are few indications of large-scale shifts in probability of rainfall anywhere over Asia. In the far
south-western part of the continent, there are some indications of increased probabilities for near-normal or below-
normal rainfall, but these are areas are dry at this time of year anyway. Over much of the eastern half and southern
parts there are patchy areas of enhanced probability for above-normal precipitation, but model-to-model consistency
is generally weak. There are weak indications of increased probabilities for below-normal rainfall in an area extending
from the far south-east mainland, eastward to the Philippines, and then northward to the southern part of Japan,
but again, consistency is mostly weak.
RA III (South America): Most of South America along and north of the equator, except for the northernmost coast, is
predicted to have above-normal rainfall (model-to-model consistency is mostly moderate strong). In the very far
southern part of South America there is a small increase in probability of above-normal, but model consistency is
strong. Over much of the rest of South America there is a weak tilt towards below-normal rainfall and model-to-
model consistency is low. The forecast in the northern area represents a continuation of above-normal conditions as
observed there in February – April 2021.
RA IV (North America, Central America and the Caribbean): An enhanced probability for below-normal precipitation
is predicted for much of the Caribbean and for Central America bordering the Gulf of Mexico and Caribbean Sea, with
moderate to high model consistency. There are also indications for below-normal precipitation over western and
central parts of North America, which in many cases represent a continuation of an anomalously dry February – April
2021. Model-to-model consistency is moderate to strong in this area. In the far northeast and northwestern parts of
North America, there are slightly increased chances of above-normal rainfall and model consistency is moderate.
RA V (Southwest Pacific): Probabilities for above-normal rainfall are weakly enhanced over an area extending from
equatorial parts of the maritime continent into the Southwest Pacific to an area northeast of New Zealand, with a
second branch extending from New Zealand towards the south-easternmost tip of Australia. The model consistency
strengthens towards the southeast of this band. There is a second band of weakly enhanced probabilities for above-
normal rainfall extending inland from the north-western coast of Australia. Over the central Pacific there is an area
of strongly increased probabilities for below-normal rainfall that is immediately south of the equator. This area
extends from about 170ºE and extends towards the southeast reaching as far as South America, but the probabilities
weaken east of about 120ºW. Model-to-model consistency is strong throughout most of this region. Along the equator
across most of the Pacific Ocean, probabilities are highest for near-normal rainfall.
RA VI (Europe): Over much of Europe south of about 50 ºN there is an increased chance of below-normal precipitation.
Model-to-model consistency is high. Elsewhere there is no consistent signal in the predicted precipitation.
103. Latest updates for monitoring and prediction information
Each month, the latest updates for the real-time monitoring and seasonal mean predictions included in GSCU can be
found at:
Monitoring:
https://ftp.cpc.ncep.noaa.gov/mingyue/GSCUWMO/
Predictions:
www.wmolc.org/board/downloadExt?fn=WMOLC_T2M.png
http://www.wmolc.org/board/downloadExt?fn=WMOLC_PREC.png
4. How to use the Global Seasonal Climate Update
The GSCU is intended as guidance for RCCs, Regional Climate Outlook Forums (RCOFs) and National Meteorological
and Hydrological Services (NMHSs). It does not constitute an official forecast for any region or nation. Seasonal
outlooks for any region or nation should be obtained from the relevant RCCs (see below for contact details) or NMHS.
Seasonal forecasts are probabilistic in nature. Although the text and figures used in the GSCU highlight the tercile
categories that is predicted with the highest probability, it is important to recognize that the other tercile categories
may also have substantial (though lower) probability.
The geographical areas occupied by the forecast signals should not be considered precise. Similarly, signals with small
spatial extent may be unreliable.
The skill of seasonal forecasts is substantially lower than that of weather timescales and skill may vary considerably
with region and season. It is important to view the forecast maps together with the skill maps provided in the
supplementary appendices.
For reference, the six WMO Regional Associations domains are depicted in the figure below.
115. Designated and developing WMO Regional Climate Centres and Regional Climate
Centre Networks
● https://public.wmo.int/en/our-mandate/climate/regional-climate-centres
6. Resources
Sources for the graphics used in the GSCU:
● The WMO Lead Centre for Long-Range Forecast Multi-Model Ensemble (LC-LRFMME):
http://www.wmolc.org
● WMO portal to the Global Producing Centres for Long-range Forecasts (GPCs-LRF):
http://www.wmo.int/pages/prog/wcp/wcasp/clips/producers_forecasts.html
● WMO portal for Regional Climate Outlook Forums
https://public.wmo.int/en/our-mandate/climate/regional-climate-outlook-products
● International Research Institute for Climate and Society (IRI):
http://portal.iri.columbia.edu/portal/server.pt
● NOAA Climate Prediction Centre (CPC):
http://www.cpc.ncep.noaa.gov
7. Acknowledgements
This Global Seasonal Climate Update was jointly developed by the WMO Commission for Climatology and Commission
for Basic Systems with contributions from:
● WMO Lead Centre for Long-Range Forecast Multi-Model Ensemble (LC-LRFMME), Korea Meteorological
Administration, NOAA National Centers for Environmental Prediction
● WMO Global Producing Centres for Long-Range Forecast (GPCs-LRF): GPC-Beijing (China Meteorological
Administration), GPC-CPTEC (Center for Weather and Climate Studies, Brazil), GPC-ECMWF (European Center
for Medium-Range Forecast), GPC-Exeter (UK Met Office),GPC- Melbourne (Bureau of Meteorology), GPC-
Montreal (Meteorological Services of Canada), GPC-Moscow (Hydro meteorological Center of Russia), GPC-
Offenbach Deutscher Wetterdienst), GPC-Pretoria (South African Weather Services), GPC-Seoul (Korea
Meteorological Administration), GPC-Tokyo (Japan Meteorological Agency), GPC-Toulouse (Météo-France),
GPC-Washington (National Centers for Environmental Prediction)
● International Research Institute for Climate and Society (IRI)
12You can also read