Spring Runoff Forecast - March 1, 2021 - Water Security Agency
←
→
Page content transcription
If your browser does not render page correctly, please read the page content below
Spring Runoff Forecast
                          March 1, 2021

Prepared by: Flow Forecasting & Operations Planning - Water Security Agency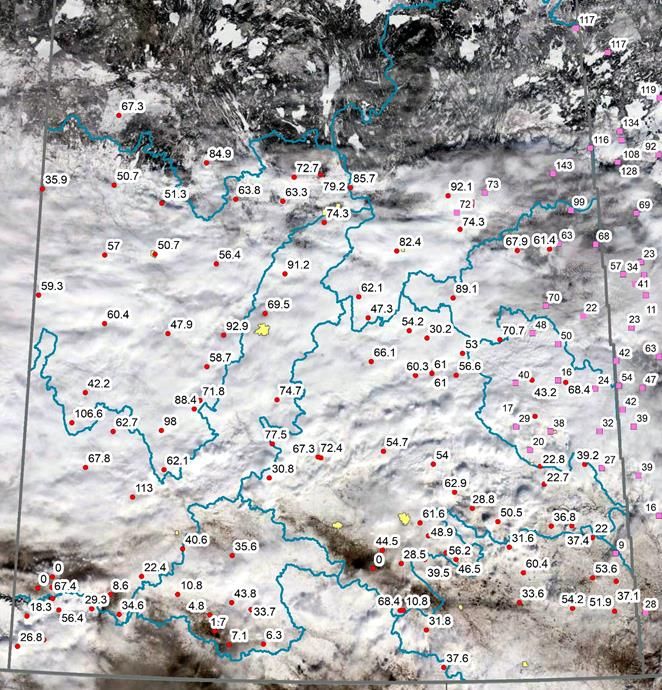
runoff is expected this spring. While flows are forecasted to be above normal in
General Overview the far north, flooding is not expected at this time.
The Water Security Agency (WSA) is preparing for 2021 spring runoff by issuing Water supplies from the province’s major reservoirs are expected to be adequate
this runoff forecast. The spring runoff potential for the province, as of March 1, in 2021. Some agricultural water supply issues could develop or worsen within
2021, is shown in Figure 1. Forecasted peak levels for select lakes and reservoirs drier areas during 2021 if lack of moisture persists through spring.
are included in Table 1, and peak flow estimates for select watercourses are
included in Table 2. Desirable summer operating levels are expected at most recreational lakes within
the province in 2021. The exception is likely to be Last Mountain Lake which is
Fall moisture conditions, snowpack water content, and rate of melt are the lower than desirable due to drier than normal conditions in 2020 and an
primary factors that influence snowmelt runoff. While we have a good expectation for below normal snowmelt runoff. WSA will maximize diversions
understanding of the fall conditions and the snow accumulation season is nearing from the Qu’Appelle River into Last Mountain Lake during the spring melt.
its end, it is too early to be able to predict the conditions at melt over most areas.
For this reason, this forecast assumes normal/average conditions going forward The snowpack over the alpine and foothill headwaters of the Saskatchewan River
through to the conclusion of the spring snowmelt event. Above average snowfall is generally near to above normal at this time. Near normal inflows are expected
over the remaining weeks of winter and/or a rapid melt could increase runoff into Lake Diefenbaker from the 2021 snowmelt. Rains over the mountain and
yields significantly. The converse is true for below normal snowfall going forward foothill headwater areas in May and June have a significant effect on the overall
and/or a slow melt. inflow to the reservoir. Lake Diefenbaker is currently at a slightly above normal
level for this time of year and is expected to be close to full by the end of August if
As detailed in the WSA’s Conditions at Freeze-up Report, which was released in summer rainfall over the headwaters is near normal.
November of 2020, above normal precipitation in the fall of 2020 resulted in
northern areas of the province going into winter with moisture conditions that WSA will continue to monitor the 2021 spring runoff conditions across
were wetter than normal. Across most of central and southern Saskatchewan, Saskatchewan. If warranted, further updates will be issued as the spring runoff
conditions were much drier than normal in the fall prior to freeze up, with the progresses.
exception of the Cypress Hills area which was near normal.
Snow accumulations to date have generally been below average across most of
the province. Some areas in the Souris and Moose Jaw River basins have only trace
amounts of snow present at this time. The only areas of the province where near
normal snowpack exists is south of the Cypress Hills and through central areas of
the province. In many areas where the snowpack is near or even slightly above
normal, below normal runoff is expected as a result of the dry conditions at freeze-
up.
As shown in Figure 1, snowmelt runoff is projected to be below to well below
average across most of southern Saskatchewan except for the Cypress Hills area in
the southwest and a band from Leader up past Saskatoon where near normal
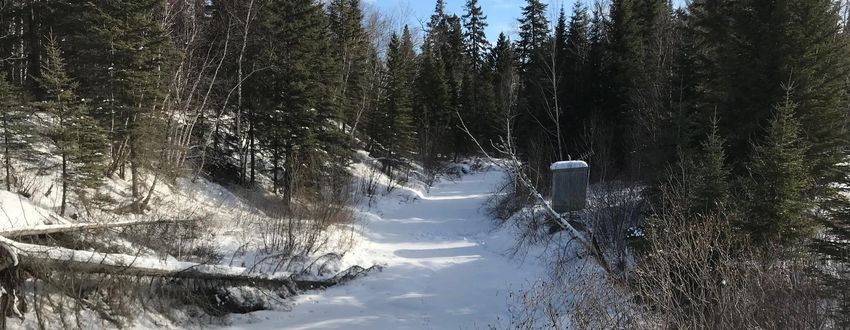
runoff is expected. Across most of central Saskatchewan and most of northern Cover Photo: Pasquia River Streamflow Gauge, February 18, 2021
portions of the province, near to below normal runoff is anticipated. In the far Credit: Jenna Coates, WSA
north, over the Lake Athabasca Basin and in the Reindeer Lake area, above normal
March 2020 Runoff Outlook 1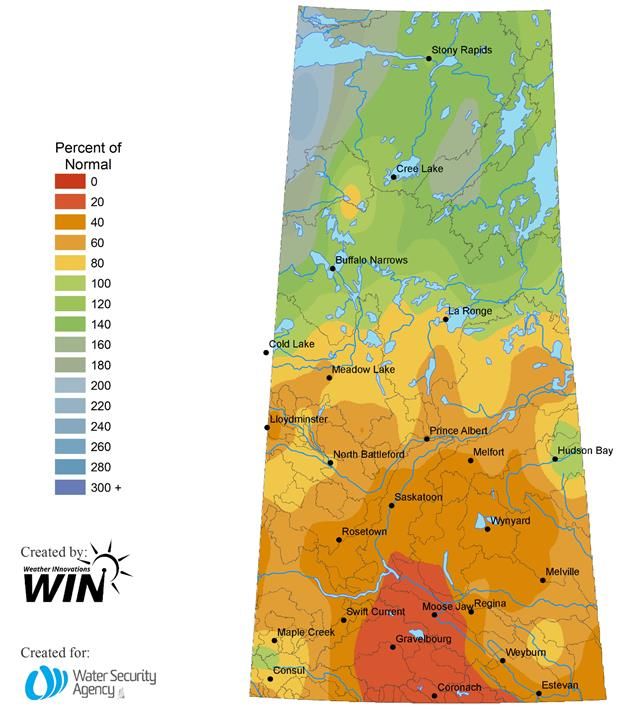
The following descriptions provide some context to the categories of snowmelt
runoff potential used to describe the potential for runoff from the spring
snowmelt in Figure 1.

                                                               Approximate Frequency
Category                        Description
                                                                  of Expected Flow
Well Below
                        Little to no runoff is expected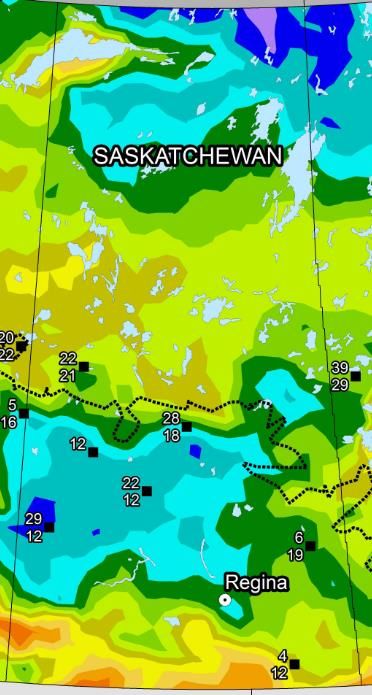
Fall Conditions
Fall moisture conditions over the province in 2020 ranged considerably. Northern
areas of the province were wet, while in the south conditions were dry. Figure 2
shows the percent of normal precipitation that was received from August 3 until
October 31st.

The northern part of Saskatchewan received well above normal rainfall in the
summer of 2020. This precipitation resulted in well above normal, and in some
instances record, flows and lake levels within the Churchill River and Lake
Athabasca basins. With the near to above normal precipitation received in the fall,
and the well above normal precipitation accumulations in summer, this area went
into the winter with above normal moisture conditions.

In contrast, southern and central areas of the province generally received below
normal rainfall throughout much of 2020. During the fall of 2020, most of southern
and central Saskatchewan received precipitation amounts that were well below
normal (20-60%). This limited precipitation resulted in most of southern and
central Saskatchewan going into freeze-up with drier than normal soil moisture
conditions, with the driest area being around Gravelbourg and Coronach.

The well above normal precipitation over the northern portion of the province led
to wetter soil moisture conditions which will increase the runoff potential.
Likewise, the well below normal precipitation across southern portions of the
province resulted in drier soil conditions at freeze-up which will reduce spring
runoff potential. Due to the drier conditions in 2020, depressional storage
availability is greater across southern Saskatchewan.

                                                                                      Figure 2: Percent Normal Precipitation
                                                                                              Aug. 3 to Oct. 31, 2021

March 2020 Runoff Outlook                                                                                                      3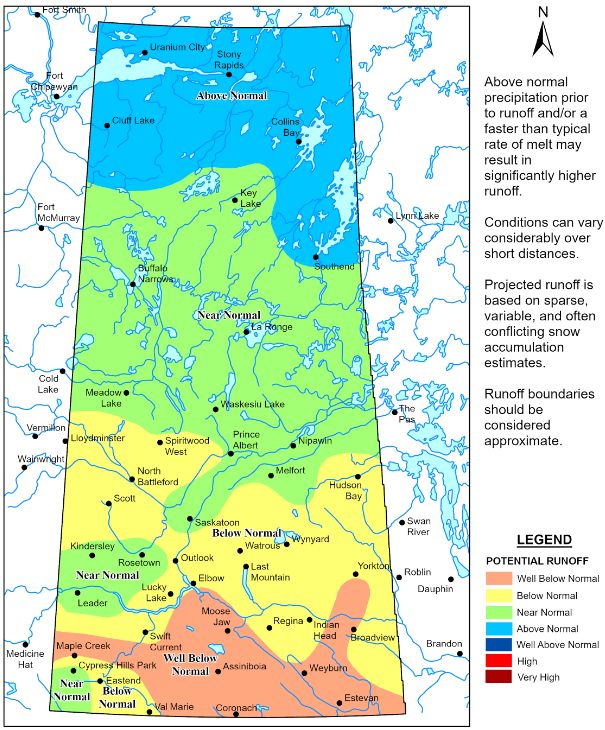
Early Winter 2019/2020 Precipitation
Point snowfall data, mapped as a percent of average, is provided in Figure 3. This
figure shows that the winter snowfall has been below average across most of the
province. It is important to note that this map is based on a relatively small
number of sites across Saskatchewan and, due to the challenges of measuring
point snowfall data in a windy environment and losses during the winter period, it
may not represent the water equivalent available for runoff.

Environment and Climate Change Canada produces a snow water equivalent (SWE)
map generated using satellite passive microwave signals. Their March 1, 2021,
map is provided as Figure 4. While this map appears to be representing the
snowpack well spatially, based on snow surveys completed by WSA it appears to
be overestimating the SWE.

WSA completed point snow course surveys between February 22 and 26. This
data, which is provided in Figure 5, is believed to be the best available information
on current snow water equivalents. Based on this data, much of the province
appears to have a below normal to near normal snowpack. The exception would
be southern areas that have received well below normal snowfall and/or have had
much or all of the snowpack ablated during mid-winter melt events.

                                                                                          Figure 3: Percent Normal Winter Precipitation
                                                                                              November 20, 2020 to March 1, 2021
                                                                                        (Map Courtesy of Agriculture and Agri-Food Canada)

March 2020 Runoff Outlook                                                                                                                    4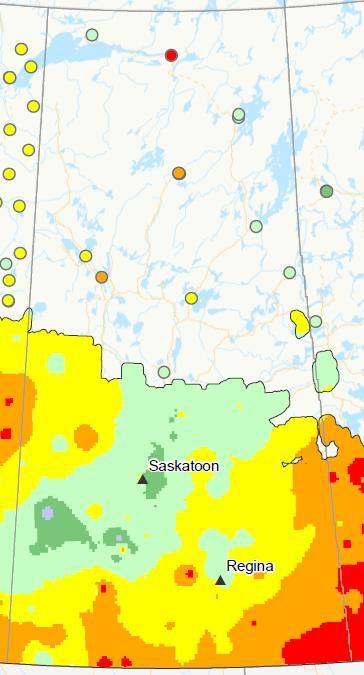
Figure 5: WSA February 22-26, 2021, Snow Survey Data.
                                                                   Additional data points (pink squares) are SWE surveyed on
                                                                     February 16-17, provided by the Province of Manitoba
                                                                                          (mm of SWE)
           Figure 4: March 1, 2021 Passive Microwave Snow Water
                               Equivalent Map
         (Map Courtesy of Environment and Climate Change Canada)

March 2020 Runoff Outlook                                                                                                      5
Long Range Forecasts
Most long lead precipitation forecasts are predicting accumulations that are
slightly above normal across the northern part of the province for March, April,
and May. Southern Saskatchewan is expected to receive near normal precipitation
over this period. Most models are predicting slightly above normal temperature in
the north-eastern and south-eastern part of the province during this period and
near normal temperatures over the remainder of the province. With that said, it is
important to note that seasonal weather forecasts are largely unreliable. Their skill
is particularly poor for precipitation. Three-month spatial anomalies map for
precipitation (Figure 6) and temperature (Figure 7) covering the March 1 to May
31 forecast period are provided here.

                                                                                                     Figure 7: Multi Model Ensemble Temperature Anomaly
                                                                                                               Forecast (March 1 to May 31, 2021)
                                                                                                        Map Courtesy of the US National Weather Service

                                                                                        Water Supply Outlook
                                                                                        Most reservoirs and dugouts in the south went into winter at below normal levels
                                                                                        as a result of dry conditions in the summer and fall of 2020. Conditions improved
                                                                                        moving north with most reservoirs across central Saskatchewan going into winter
                                                                                        with near normal elevations. With the forecasted snowmelt inflows, most
             Figure 6: Multi Model Ensemble Precipitation Anomaly                       reservoirs are expected to be within their desirable operating ranges in 2021. The
                       Forecast (March 1 to May 31, 2021)                               exception is the Souris River Basin reservoirs (Rafferty, Boundary, and Grant
                                                                                        Devine) which, based on the current forecast, are unlikely to fill from snowmelt
                Map Courtesy of the US National Weather Service                         runoff. However, we do not expect to experience any surface water supply
                                                                                        shortages in the Souris Basin or any other basin in 2021.

March 2020 Runoff Outlook                                                                                                                                                    6
The snowpack in the Rockies does not typically peaks until late May or early June
Summary of Major River Systems at the upper altitudes; therefore, conditions can change between now and the
melt. Additionally, high flows on the system are largely driven by significant
Souris Basin summer rainfall events in June and July. At this time, assuming near normal
Both Rafferty Reservoir and Grant Devine Lake are below their February 1st precipitation over southern Alberta through the summer months, Lake
drawdown target elevations. The dry conditions at freeze-up in 2020 and current Diefenbaker levels are expected to be near normal this summer.
well below normal snowpack within the basin has resulted in non-flood operations
being in effect. No additional drawdown of these reservoirs is expected to occur Flows on the North Saskatchewan River are above normal for this time of year.
prior to spring runoff in 2021. The snowmelt runoff response is expected to be This, combined with above normal outflows from Lake Diefenbaker, has resulted in
below normal across the basin this spring. above normal flows on the Saskatchewan River.
Based on current conditions, none of the main reservoirs are expected to fill. It is Qu’Appelle System
anticipated that reservoir releases during the spring runoff period will be limited to
Most of the lakes in the Qu’Appelle River basin are maintaining a near normal
what may be required to meet international apportionment obligations. Any
water level during the winter months. The exception is Last Mountain Lake which
releases to satisfy these international obligations will be made from Grant Devine
currently is maintaining a water level that is about 15 cm below the median value
Dam.
due to below normal inflows in 2020 and above normal evaporative losses. Efforts
will be made to divert water from the Upper Qu’Appelle into Last Mountain Lake
Detailed forecasts for the Souris River Basin are developed on or near the 1 st and
during the spring period to improve Last Mountain Lake levels.
15th of each month, beginning in February, up until the snowmelt runoff event.
These forecasts can be found on www.wsask.ca.
Pasqua-Echo lakes are maintaining a relatively higher water level for this time of
year. With the dry conditions in the fall of 2020, WSA elected to retain most of the
Saskatchewan River Basin stoplogs in the structure over the winter to minimize the risk of lower than
Lake Diefenbaker was near its upper quartile level going into winter and winter desirable levels in 2021. Buffalo Pound and Mission-Katepwa lakes are all
inflows to Lake Diefenbaker have been a little above normal. As a result, outflows maintaining near median water levels. Crooked Lake is currently a little below
have been above normal throughout the winter months to bring the reservoir back normal for this time of year due to low flows within the system.
to near median levels ahead of the spring melt. The operating plan is to maintain
the current outflow of 290-320 m3/s to draw the reservoir down to near its median The current expectation for the Qu’Appelle River System is for a below to well
level prior to the spring runoff. Near to above normal releases are likely for both below normal snowmelt runoff responses. As such, operations may be required in
March and April. advance of the melt to maximize diversions into storage to help ensure that
desirable summer operating levels can be achieved.
Snow pillows operated by Alberta Environment and Parks located at higher
elevations within the alpine headwaters of the basin are showing above or near Churchill System
average snowpack for the South Saskatchewan River headwaters and above
Record to near record flows were observed throughout the Churchill River Basin
average for the North Saskatchewan River. Snow courses completed at lower
during the summer of 2020. Flows and water levels are still at record levels for this
elevations in mid-January (and early February) also suggest slightly above to well
time of year in areas near Sandy Bay and Lac La Ronge. Based on current
above normal snowpack in the South Saskatchewan River Basin, and slightly above
normal in the North Saskatchewan River Basins. conditions, a near normal snowmelt runoff response is expected.
March 2020 Runoff Outlook 7Quill Lakes expected. At this time, the only reservoir in the basin that has a good likelihood of
filling fill in spring 2021 is McDougald.
Both Big Quill and Little Quill lake water levels are 519.95 m. This is their lowest
pre-spring runoff level since 2014 and 0.25 m lower than the pre-spring level in
2020. Topsoil moisture conditions were below normal at freeze-up in 2020 within
Swift Current & Rush Lake Creeks
the Quill Lakes Basin. With a near normal snowpack within the basin and
considering the dry conditions in the fall, below normal snowmelt inflows are The Swift Current Creek basin was drier than normal at freeze-up in 2020 and has
currently forecasted for the Quill Lakes in 2021. Based on current conditions, the received a below normal snowfall this winter. As such, a below normal runoff is
expected. We do expect that there will be enough runoff to fill Reid Lake.
Quill Lakes are forecasted to increase by about 0.09 m in response to snowmelt
inflows in 2021 resulting in a peak of about 520.04 m. With average climatic
Highfield Reservoir is approximately 50% full and may not fill during the snowmelt
conditions in 2021, the Quill Lakes water levels would continue to decline. period. The backflood delivery for the Rush Lake project is scheduled to begin
March 4. Highfield Reservoir will also be operated lower in 2021 to reduce the risk
Old Wives Lake of the dam overtopping during the replacement of one of the outlet facilities.
Runoff potential is expected to be well below normal for most parts of the Old
Wives Lake basin in spring 2021. This is a result of dry soil moisture conditions at
freeze-up and near to below normal snow accumulations throughout most of the
basin. Next Forecast
Based on the snow survey completed in late February, the northwest portion of The WSA will issue a Spring Snowmelt Forecast in early April unless runoff is
the Wood River Basin showed slightly more snowpack than the southern part of underway.
the watershed. Despite the below normal snowpack above Thomson Lake, we do
expect that the reservoir will fill in spring 2021; however, due to lower spring
runoff potential a pre-runoff release at Lafleche Dam is not expected.
Frenchman River
Snowmelt runoff yields within the Frenchman River Basin are generally expected
to be below to well below normal in 2021; however, the expectation is that
Eastend, Huff, and Newton reservoirs will fill in spring 2021.
Battle, Middle, Lodge Creeks
With the current conditions in southeastern Alberta and the southwestern corner
of Saskatchewan, the expectation is that there will be near normal snowmelt
inflow into both Middle Creek Reservoir and Altawan Reservoir in 2021.
Maple Creek
With the below normal snowpack in the basin, below normal inflows into all
reservoirs in the Maple Creek Basin (Junction, McDougald, Harris, and Downie) is
March 2020 Runoff Outlook 8Table 1: Provincial Forecast for Saskatchewan – March 2021
Normal Recorded Historical
2021 March 1st Forecast* 2021 Peak Shoreline 1 2020 Peak
Lake Summer Level Extreme
Level (metres) Spring Levels (metres) Level/FSL (metres) (metres)
(metres) Level (metres) Year
Anglin 515.35 515.45 515.4 515.3 515.6 516.05** 2013
Big Quill 519.96 520.05 521.47 (spill) 515 520.4 520.92 2017
Boundary Reservoir 559.19 560.25 560.83 560.5 560.5 561.15 1979
Buffalo Pound 509.33 509.45 509.9 509.4 509.6 511.45 1974
Candle Lake 494.30 494.4 494.5 494.4 494.4 495.25 1973
Cookson Reservoir 752.10 752.3 753 752.5 753.1 753.35 1979
Crooked 450.79 451.6 452.3 451.7 451.6 454.40** 2014
Echo and Pasqua 478.89 479.10 479.3 479.1 479.1 480.98 2011
Fishing 529.68 529.85 529.7 528.5 530.0 530.92 2011
Good Spirit 484.08 484.5 484.6 484.6 484.5 485.68** 2010
Grant Devine 560.77 560.85 562.0 561.5 561.5 566.58** 2011
Jackfish 529.56 529.65 529.4 529.4 529.8 530.0 1985
Katepwa and Mission 478.25 478.35 478.7 478.3 478.3 479.58 2011
La Ronge 364.31 364.2 364.1 364.4 365.0 364.98** 2020
Last Mountain 489.68 489.85 490.7 490.2 490.1 492.09 1955
Moose Mountain 619.91 620.3 620.3 620.4 544.2 621.9 2011
Nickel Lake 562.07 563.0 563.0 562.75 563.0 564.0 2011
Rafferty 548.51 548.52 550.5 550 549.2 554.05** 2011
Round 441.66 441.9 443.28 442.4 441.8 445.70** 2014
Wascana 570.47 570.75 570.6 570.5 570.7 572.23 1974
* These forecasted peaks are based on a typical spring precipitation and rate of melt. Above normal precipitation and/or rapid melt may result in significantly higher levels.
** Occurred after spring runoff during summer event(s).
1 The “Shoreline Level” and “Full Supply Level” refer to the highest elevation before spill occurs
March 2020 Runoff Outlook 9Table 2: Spring Runoff Forecast
March 2021 Forecast* 2020 Spring Historical
Basin and Location Peak Flow Peak Flow Peak Flow Normal Year Recorded Maximum Spring
(m3/s) Frequency (m3/s) Flow (m3/s) Flow (m3/s) Year
ASSINIBOINE RIVER BASIN
Assiniboine River at Sturgis 15 < 1:2 29.7 30 111 1995
Whitesand River near Canora 18 < 1:2 19.1 36 247 1995
Assiniboine River at Kamsack 40 < 1:2 50.8 78 488 1995
QU’APPELLE RIVER BASIN
Qu’Appelle River near Lumsden 15 < 1:2 15.9 30 436 1974
Qu’Appelle River below Craven 2 < 1:2 5.9 19 141 1974
Qu’Appelle River below Loon Creek 12 < 1:2 14.6 24 163 2011
Qu’Appelle River near Hyde 18 < 1:2 17.6 32 254 2011
Qu’Appelle River near Welby 20 < 1:2 27.7 40 345 2011
Moose Jaw River above Thunder Creek 4March 2021 Forecast* 2020 Spring Historical
Basin and Location Peak Flow Peak Flow Peak Flow Normal Year Recorded Maximum Spring
(m3/s) Frequency (m3/s) Flow (m3/s) Flow (m3/s) Year
NORTH SASKATCHEWAN RIVER BASIN
North Saskatchewan River near Deer Creek 900 1:2 1820 900 1660 1974
Eagle Creek near Environ 11 1:2 17.8 12 136 1970
North Saskatchewan River at Prince Albert 1060 1:2 2820 1100 3880 1974
SASKATCHEWAN RIVER BASIN
White Fox River near Garrick 25 1:2 72.3 26 160 1974
Torch River near Love 40 1:2 99.9 43 170 1955
Carrot River near Armley 68 1:2 143 71 377 1974
Carrot River near Smoky Burn 200 1:2 479 200 816 1972
SWIFT CURRENT CREEK BASIN
Swift Current Creek below Rock Creek 9 < 1:2 35.5 18 85 1955
Rushlake Creek above Highfield Reservoir 5 < 1:2 12.3 7.4 38 1969
SOURIS RIVER BASIN
Long Creek near Noonan 6March 2021 Forecast* 2020 Spring Historical
Basin and Location Peak Flow Peak Flow Peak Flow Normal Year Recorded Maximum Spring
(m3/s) Frequency (m3/s) Flow (m3/s) Flow (m3/s) Year
MISSOURI RIVER BASIN
Battle Creek at Alberta Boundary 4 1:2 12.5 4.6 20 1985
Battle Creek near Consul 5 1:2 14 5 65 1967
Lodge Creek at Alberta Boundary 14 1:2 20 14 110 1952
Frenchman River near Ravenscrag 20 < 1:2 76 30 200 1955
Denniel Creek near Val Marie 4.5 < 1:2 30 9 43 2011
East Poplar River above Cookson Reservoir 1.5You can also read