Supplement of Impact of forcing on sublimation simulations for a high mountain catchment in the semiarid Andes - The Cryosphere
←
→
Page content transcription
If your browser does not render page correctly, please read the page content below
Supplement of The Cryosphere, 14, 147–163, 2020
https://doi.org/10.5194/tc-14-147-2020-supplement
© Author(s) 2020. This work is distributed under
the Creative Commons Attribution 4.0 License.

Supplement of
Impact of forcing on sublimation simulations for a high
mountain catchment in the semiarid Andes
Marion Réveillet et al.

Correspondence to: Marion Réveillet (marion.reveillet@meteo.fr)

The copyright of individual parts of the supplement might differ from the CC BY 4.0 License.
Sect. S1. Climatology at La Laguna

                                                                                                                                   a

                                                                                                                                   b

            Figure S1: (a) Monthly precipitation and (b) air temperature recorded at La Laguna AWS. The monthly mean
            (black) is computed over the 1976-2016 period.

            Sect. S2. Comparison AWS vs. WRF grid point

            Table S1: Statistics (R2, RMSE and AME (Absolute Mean Error)) between micromet outputs forced by the AWS
            measurements and the WRF outputs.
                        Vertical offset
                                                 T (°C)                  RH                      SWi                 LWi                    WS (m s-1)                 P (mm d-1)
                             with
                        the WRF grid             RMS                     RMS                                         RMS                                                RMS
                            point         R2      E       AME     R2      E     AME        R2   RMSE AME      R2      E     AME        R2    RMSE AME           R2       E      AME

Colorado Bajo               278m          0.94   5.02     5.32   0.04    15.7   15.7       1    1.29   0.65   0.96   5.53   4.10   0.01       1.61       1.29   0.35     2.96       3.42

La Laguna                   144m          0.91   5.01     4.60   0.04    19.4   14.8       1    1.65   0.72   0.94   6.66   5.00   0.15       1.71       1.15   0.51     5.72       3.52

Llanos de las Liebres       305m          0.91   6.39     6.06   0.04    20.6   15.8       1    1.34   0.51   0.98   5.57   4.48   0.37       2.08       1.46   0.51     7.17       4.31

La Gloria                    56m          0.89   5.33     4.81   0.08    19.7   15.2   0.99     2.95   1.09   0.93   6.61   5.12   0.17       1.34       1.01   0.58     5.05       3.05

Colorado Alto               196m          0.89   6.61     6.27   0.04    21.6   16.6       1    1.54   0.53   0.99   4.46   3.69   0.52       2.31       1.70   0.51     8.35       4.16

Vega Tapado                 -145m         0.88   7.01     6.73   0.03    22.8   17.6   0.99     3.43   1.40   0.99   4.24   3.67   0.53       4.28       3.48   0.53     8.95       4.73

Tapado                      462m          0.88   6.83     6.54   0..01   22.9   17.8   0.99     2.98   1.33   0.99   1.48   1.11   0.52       3.45       2.78   0.51     9.48       4.92

Paso Aguas Negras           -121m         0.83   7.29     6.99   0.00    24.6   19.0       1    1.96   0.75   0.98   2.96   2.39   0.54       5.19       4.27   0.56     7.89       4.25

                                                                                       1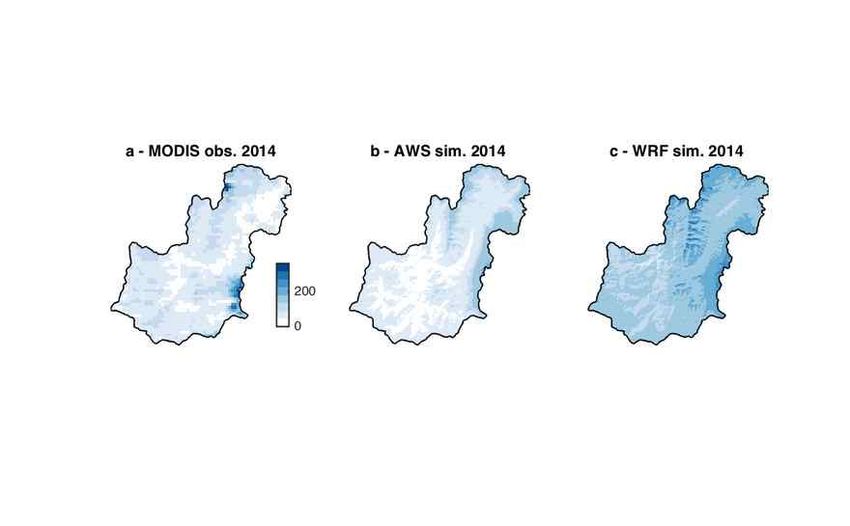
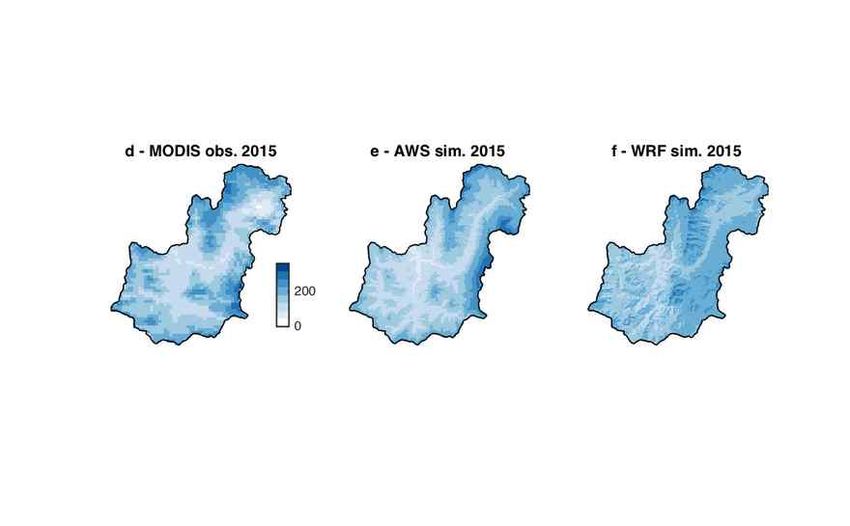
Sect. S3. Spatial variability of the annual SCD

Figure S2: Snow cover duration from MODIS images for (a) 2014 and (d) 2015. Simulated snow cover duration
using AWS-forcing for (b) 2014 and (e) 2015. Simulated snow cover duration using WRF-forcing (c) 2014 and (f)
2015.

Sect. S4. Surface temperature

                                           280

                                           270

                                           260
                           Surface T (K)

                                           250

                                           240

                                           230
                                                  Measurements
                                                  AWS-sim
                                                  WRF-sim
                                           220
                                                 Aug15           Sep15     Oct15
                                                                    Date

Figure S3: Observed and modeled surface temperature at Tapado AWS. Measurements correspond to the surface
temperature computed from the outgoing long wave measured by the station. Cyan line correspond to the
simulated surface temperature using the AWS-forcing and the purple one the WRF-forcing.

                                                                   2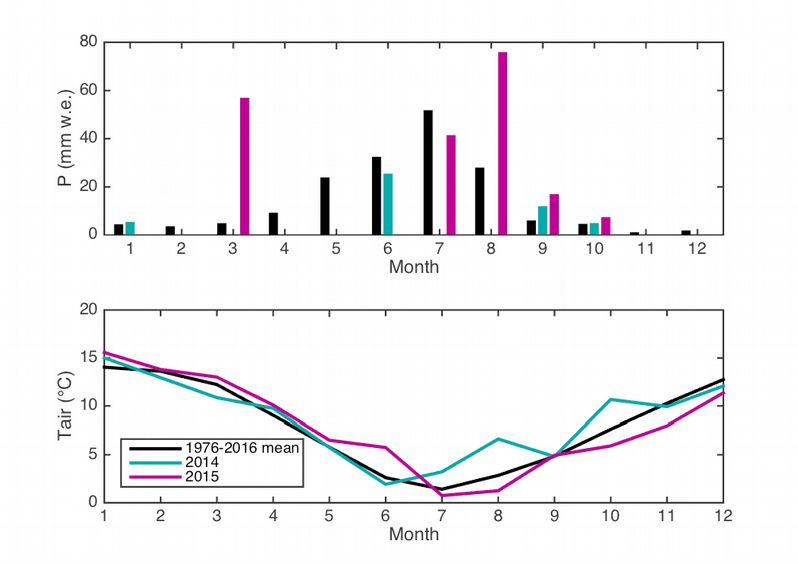
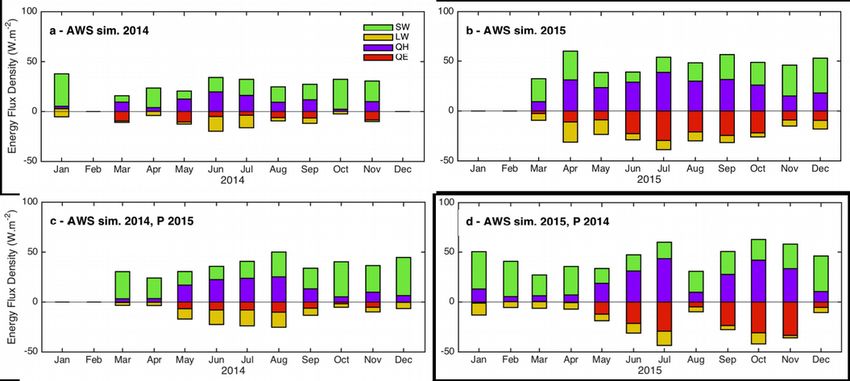
Sect. S5. Influence of the precipitation amount on the energy fluxes contribution

Figure S4: Monthlyaverage (for the entire catchment, over snow surfaces only) of the main modeled heat fluxes
for (a) 2014 and (b) 2015 AWS-forcings, (c) a simulation using the 2015 precipitation and the 2014 AWS-
forcings, and (d) a simulation using the 2014 precipitation and 2015 AWS-forcings. SW is net shortwave
radiation, LW is net longwave radiation, QE is the latent heat flux and QH is the sensible heat flux.
Figure S2: Monthly simulated melt (purple) and sublimation (blue) using AWS-forcing (a,b) and AWS-forcing
with (c) 2014 precipitation and (d) 2015 precipitation. Forcing. Back numbers indicate the monthly sublimation
ratio in %.

Sect. S6. Model uncertainties
The main forcing uncertainties were estimated to be the precipitation (related to P measurements and the P
spatialization as there are only 2 recording stations); and the wind speed spatialization (Gascoin et al., 2013).
Regarding the other variables T, RH, SW, and LW, a similar study performed in a nearby catchment indicated a
very good performance of MicroMet to spatialize these variables, with high correlations and low biases (for more
details please refer to Gascoin et al., 2013).
The principal calibration uncertainties are the topographic length scale used for the wind distribution and z0 due
to the absence of measurements to properly calibrate the model. Note that the albedo measurements have been
used to calibrate the model, that is why this calibration is not considered as a main calibration uncertainty in this
study. Indeed, if we compare the model output albedo with the measurements, the mean R is 0.74 with mean
RMSE of 0.22 and errors are considered related to the simple approach of the albedo computation of the model.

Table S2: Mean annual melt and sublimation ratio of each simulation. Bold values indicate when results are
different than the reference study (i.e. results present in section 4 with the AWS-forcings) indicated in the first
line.
                                            2014                                           2015
                          Melt (m.w.e.)    Sub. (m w.e.) (Sub. Ratio)   Melt (m.w.e.)     Sub. (m w.e.) (Sub. Ratio)
Reference sim.               0.047               0.030 (42%)                0.21                 0.19 (48%)
Precipitation +10%           0.048               0.029 (41%)                0.23                 0.19 (47%)
Curvature 100m               0.047               0.030 (42%)                0.21                 0.19 (48%)
Curvature 1000m              0.047               0.030 (42%)                0.21                 0.19 (48%)
Slope 0.25 - Curv. 0.75      0.047               0.030 (42%)                0.21                 0.19 (48%)
Slope 0.75 - Curv. 0.25      0.047               0.030 (42%)                0.21                 0.19 (48%)
Z0 = 10 mm                   0.033               0.049 (66%)                0.12                 0.29 (72%)

                                                          3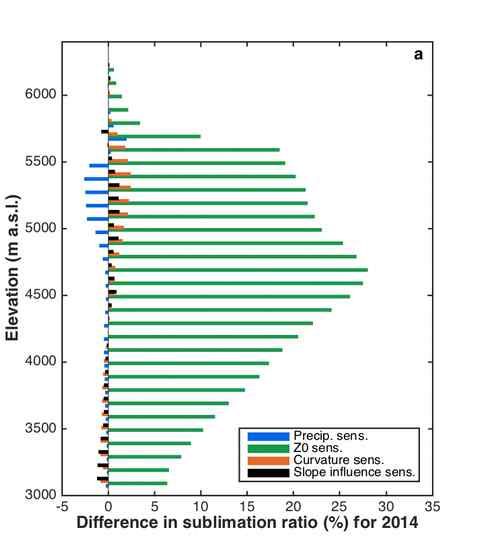
Sect. S6.1. Precipitation uncertainties
a) Precipitation measurements
As mentioned in section 5.1.2 snowfall measurements in windy conditions can suffer from an undercatch bias,
and corrections are generally performed using empirical relationship (e.g. MacDonald and Pomeroy, 2007; Wolff
et al., 2015). The strong wind gusts in this region, and especially at high elevations (Figure 3) increase
measurement uncertainties. Nevertheless, in this study it was chosen not to apply any correction. First, given the
lack of continuous SWE measurements, it is not straightforward to establish an empirical correction. Also,
precipitation data from two rain gauges (one shielded and the second one unshielded) located in Tapado have
been averaged, to reduce the random error. Note that the data from the two rain gauges is surprisingly similar (see
section 2.2.1), while we would expect a larger amount of precipitation catched by the shielded Geonor sensor, in
this area of strong wind speed. This suggest that either the under catch is not si important or that the shield is not
that efficient.
b) Spatialization
The main uncertainty for the precipitation data is due to the data spatialization at catchment scale. As only two
stations have been used to force the model, the uncertainty is expect to be significant due to the orographic
complexity of the catchment, but cannot be evaluated based on the current available measurements.
The interpolation of precipitation in MicroMet subroutine has been done without the use of an altitudinal gradient
(called precipitation adjustment factor, Liston and Elder, 2006a) as no consistent altitudinal gradients were found
in the observations (results not shown). Each event is very specific (e.g. Sinclair and MacDonell, 2016) and as a
result, the altitudinal lapse rate can be either positive or negative. In addition, due to low precipitation rate and the
few number of events, mainly in 2014, most of the time precipitations are recorded at one station but not at the
other, or there is a delay between the events recorded at both stations, which are 14 km from one another.
Different altitudinal gradients (monthly vs event scale) were tried but the best comparisons between simulated
and observed snow depths were found without considering any gradient. Considering an altitudinal lapse rate
systematically leads to an over-estimation, especially at high elevations, where the snow persists until the next
season.
In addition, the model simulates the wind transport only after deposition and does not consider the preferential
deposition. Again, the available measurements make it difficult to estimate this uncertainty.
c) Sensitivity test
A sensitivity test was performed by increasing the precipitation by 10%. Results indicate that the mean annual
sublimation ratio over the catchment is very similar to that of the initial simulation (Figure 2). Indeed, it
decreases by 1% for 2014 and for 2015. Regarding the spatial variability (Figure 11) the difference varies
between +1 and -3 %, and larger differences are observed for 2014 between 5000 and 5500 m a.s.l. and around
4600 m a.s.l. for 2015. This maximum difference can be related to changes in spatial distribution of snow when
some events occur only at high elevations.
d) Impact on model performances
The precipitation uncertainties explain also the better performances of the model for 2015 than 2014. Indeed, the
model is sensitive to patchy snow, mainly observed at low elevation. As mentioned in section 4.2.1, modeling the
spatial variability of the SD is complex and results show an overall similarity of the simulated SD between some
stations. When dealing with low amount of snow, patches over the catchment are more present an increase the
error.

Sect. S6.2. Wind uncertainties
a) Wind data spatialization uncertainty
As mentioned by Gascoin et al., (2013), the wind speed simulated by MicroMet model tend to be under-estimated
especially at low elevation. With the exception of Paso del Agua Negra, similar results are found in this study,
with largest bias found at low elevations. Indeed, the results of the cross validation test indicate an RMSE of at
4.1 m.s-1 at La Laguna and a larger bias (RMSE = 7.8 m.s -1 at Paso del Agua Negra. Differences are related to the
MicroMet interpolation and can be explained by different reasons. First, The main shortcoming of the wind
interpolation module is the lack of thermal winds (e.g. katabatic winds). In addition MicroMet does not take any
                                                           4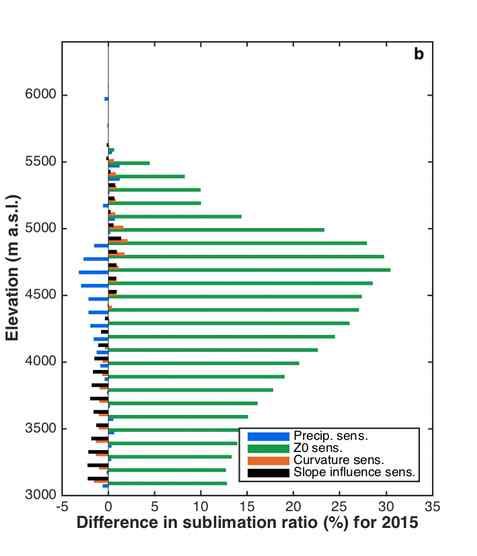
topography into account that determines the dynamic wind direction, implying bias in the wind interpolation.
Nevertheless, the absence of general trends of the under-estimation (both low and high values are under-
estimated and the bias strongly depend on the location and the wind speed) makes difficult to establish a
relationship to correct the bias and also to evaluate the uncertainty at catchment scale.
Therefore, the number of stations used is important as increasing the number will decrease the uncertainty. The
wind uncertainty has an impact on the sublimation ratio. Indeed, for instance, increasing the wind speed by 10%
can induces sublimation ratio changes of 40% at high elevation (i.e. where there is no melt). The wind speed is, in
fact, known to directly affect the turbulent fluxes (e.g. Litt et al., 2017)
In addition, the wind speed also impacts the snow density, which directly affects the thermal conductivity of the
upper snow layers (Yen, 1981). As a consequence it impacts the surface temperatures thus the turbulent fluxes.
b) Topographic influence on wind transport
In the model, the curvature length and the influence of the slope vs. curvature can be calibrated to consider the
topographic influence of the wind transport. While the curvature length can be approximately constrained from
the DEM, the relative influence of slope and curvature is more difficult to quantify a priori. As such, sensitivity
tests have been performed to evaluate the impact of these parameters on the simulation.
First, the curvature length value has been varied from 100m to 1000m, and does not impact the annual mean
sublimation ratio at the catchment scale (Figure 2). Nevertheless the spatial variability of the differences depends
on the elevation (Figure 11). Considering a larger curvature length leads to larger sublimation ratio at low
elevation (in the valley) and lower one at high elevation. When choosing a larger curvature value, the simulated
snow depth is larger in the valley as the snow transport is from a larger area, and increasing the snow depth
decreases the sublimation ratio. Indeed, in that case the snow persists longer in spring, and warmer temperature
allow increasing the melt rate.
The annual mean of the sublimation ratio at the catchment scale is not sensitive to the influence of the slope vs.
curvature either (Figure 2) when values are ranging between 0.25 and 0.75. Nevertheless, varying this influence
changes the spatial distribution of snow depth. Larger snow depths (between 18 and 26%) are observed on the
ridges when the influence of the slope is larger than the curvature (results not shown). As a consequence, the
sublimation ratio decreases by about 10 to 20% in areas with thicker snow, and can also be explained by a the
persistence of the snow cover during the spring, increasing the melt rate. On the contrary the sublimation ratio is
larger on steep slopes, when the influence of the slope is set to be larger than the curvature, as this calibration
allows for more snow redistribution, decreasing the mean snow depth.
The change in snow distribution is more important when changing the influence of slope vs. curvature from 0.25
to 0.75 than when changing the curvature length from 100 to 1000 m. The calibration of these parameters remains
important when the sublimation is evaluated in the valley for instance but according to our results, it does not
affect the sublimation ratio when evaluated at the catchment scale

Sect. S6.3. Roughness value
Increasing the roughness value by a factor 10 increases the annual mean of the sublimation ratio by 24% for 2014
and by 20% for 2015 (Table S1). Larger changes are observed around 4600 m a.s.l. for 2014 and 2015 where the
difference can reach 30% (Figure 11) .
This sensitivity test highlights the strong sensitivity and the importance of choosing an accurate value to properly
quantify sublimation over the catchment. Further studies are therefore recommended to calibrate this value using
turbulent flux measurements such as with an Eddy Covariance System (e.g. Litt et al., 2017). Nevertheless even
with measurements, significant uncertainty remains due to the strong spatio-temporal variability of the snow
surface roughness. While the roughness value is used as a calibrated parameter and is not an absolute physical
value, it depends on the surface roughness. The roughness is expected to increase with elevation, as penitentes are
commonly observed on the lower Tapado glacier (e.g. Lhermitte et al., 2014; Nicholson et al., 2016) and
surrounding areas. There is therefore a strong spatial variability of the roughness value, as penitentes are not
observed over the entire catchment, but mainly in the upper part. In addition, penitentes grow in size over the
season (Lliboutry, 1954) leading to a strong temporal variability of the roughness.

                                                         5
Due to the strong sensitivity to z0 and the potential for significant spatio-temporal variability of the snow surface
roughness, to reduce uncertainties, a spatio-temporal evolution of z0 could be envisaged. At this stage, without
more measurement it is a complicated task. Further studies based on two EC measurements over the season could
help to evaluate the variability.
Figure S5: Differences in sublimation ratio per elevation range for (a) 2014 and (b) 2015, between: reference
simulation and the simulation performed with a precipitation increase at the two AWS by 10% (blue); reference
simulation (z0=1mm) and with an increase of z 0 to 10mm (green); 100 and 1000m curvature length simulations
(orange) and slope vs. curvature weight of 0.25 – 0.75 and 0.75 – 0.25 (black).
References
Gascoin, S., Lhermitte, S., Kinnard, C., Bortels, K., Liston, G.E.: Wind effects on snow cover in Pascua-Lama,
Dry Andes of Chile. Adv. Water Resour. 55, 25–39. https://doi.org/10.1016/j.advwatres.2012.11.013,
2013.
Lhermitte, S., Abermann, J., Kinnard, C.: Albedo over rough snow and ice surfaces. The Cryosphere 8, 1069–
1086. https://doi.org/10.5194/tc-8-1069-2014, 2014.
Liston, G.E., Elder, K.: A Meteorological Distribution System for High-Resolution Terrestrial Modeling
(MicroMet). J. Hydrometeorol. 7, 217–234. https://doi.org/10.1175/JHM486.1, 2006a.
Litt, M., Sicart, J.-E., Six, D., Wagnon, P., Helgason, W.D.: Surface-layer turbulence, energy balance and links to
atmospheric circulations over a mountain glacier in the French Alps. The Cryosphere 11, 971–987.
https://doi.org/10.5194/tc-11-971-2017, 2017.
Lliboutry, L.: Le massif du Nevado Juncal (Andes de Santiago). Ses pénitents et ses glaciers. Rev. Géographie
Alp. 42, 465–495, 1954.
Nicholson, L.I., Pętlicki, M., Partan, B., MacDonell, S.: 3D surface properties of glacier penitentes over an
ablation season, measured using a Microsoft Xbox Kinect. Cryosphere Discuss. 1–31.
https://doi.org/10.5194/tc-2015-207, 2016.
Sinclair, K.E., MacDonell, S.: Seasonal evolution of penitente glaciochemistry at Tapado Glacier, Northern Chile:
Seasonal Evolution of Penitente Glaciochemistry, Northern Chile. Hydrol. Process. 30, 176–186.
https://doi.org/10.1002/hyp.10531, 2016.
Yen, Y.C.: Review of thermal properties of snow, ice and sea ice. DTIC Document, 1981.
6You can also read