Technical Advisory Group - Policy modelling update 25th June 2021 - GOV.WALES
←
→
Page content transcription
If your browser does not render page correctly, please read the page content below
Technical Advisory Group
Policy modelling update

25th June 2021

© Crown copyright 2020
Policy modelling update 25th June 2021
Welsh Government COVID-19 TAG Policy Modelling Subgroup
1. Summary
This paper explores the results of policy modelling carried out by Swansea
University to understand possible futures around the coronavirus pandemic in
Wales.
As of mid-June 2021, Wales is seeing an increase in cases and positivity, and
England has seen several weeks of rapid growth in cases, so Wales may be
following a few weeks behind. This increase has been highest in young
people who have not yet been vaccinated, and typically have more social
contacts.
The Swansea University epidemiological models have produced estimates of
infections and direct COVID-related harms until the end of March 2022.
Overall, the modelled scenarios suggest that it is likely cases, hospitalisations
and deaths will increase during July, as restrictions are eased further, and as
the more transmissible Delta variant supplants the Alpha variant. Cases are
likely to peak in late July 2021. Hospitalisations and deaths are likely to peak
in August 2021.
The level of uncertainty now is arguably higher than it has been at other times
in the pandemic because we cannot be certain when we might start to see
population immunity effects, small network effects, and we cannot be certain
how much vaccines have broken the link between infections and other harms.
It may be another 2-3 weeks before we have a good idea of what to expect in
terms of which trajectory we are following; England is a few weeks ahead of
Wales in terms of case rates so data for England may be informative in terms
of future rates of hospitalisations and deaths.
So far in 2021, it is likely that restrictions, public responses and the rollout of
the COVID-19 vaccines have had an impact in reducing transmission of the
virus and reducing hospital admissions and deaths.
Evidence suggests the Delta variant is 40-80% more transmissible than the
previously dominant Alpha variant. This has led to estimated increases in the
modelled number of future COVID-19 cases, hospital admissions and deaths.
Evidence is emerging suggesting that vaccines are reducing onward
transmission and are very effective in preventing severe disease, even with
the Delta variant. However, there is still uncertainty about duration of
effectiveness of available vaccines and plans for booster vaccinations.
It is likely that future outbreaks will occur in children and young people who
have more contacts and have not been vaccinated, so we need to continue to
2
consider what level of virus transmission is acceptable if vaccinations are
keeping hospitalisations and deaths low.
Key uncertainties are: the level of adherence to social distancing and other
restrictions; the impact of vaccines on transmission and whether they remain
effective against the Delta variant; the impact of Delta and other potential new
variants; and, the possibility of waning immunity.
The current modelled scenarios do not include the impact of further antigenic
drift or waning immunity; so are likely to be robust for the next few months, but
further modelling is required in advance of Winter 2021/22.
Continued surveillance of infections in schools, supply, uptake and
effectiveness of vaccines, and impact and spread of variants is crucial in
helping to understand what trajectory Wales is following in terms of the
pandemic, and in fine-tuning future policy formulations to deal with the
pandemic while reducing other health, educational and socioeconomic harms
and inequalities.
This paper also includes a new reasonable worst case (RWC) and most likely
scenario (MLS) which will be used for planning in Wales.
3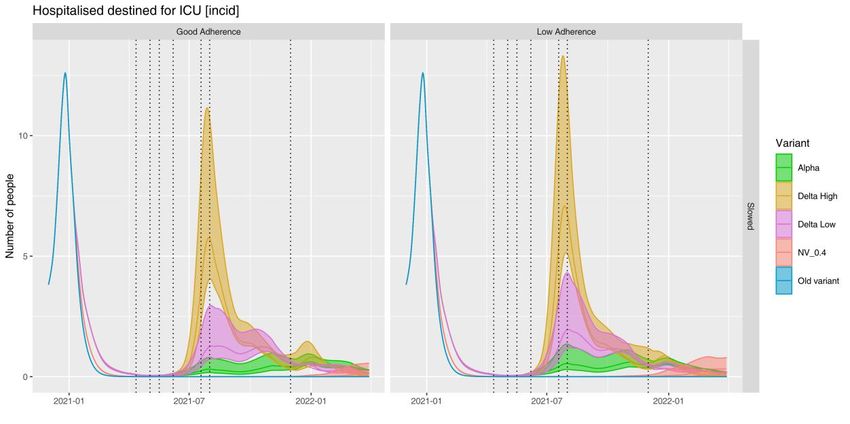
2. Objective
The objective of this paper is to examine scenarios for COVID-19 in Wales from
June 2021 to March 2022, which include different assumptions around the impact of
new variants, impacts of vaccine efficacies and individuals’ ability to continue to
follow restrictions and to continue to adopt protective behaviours (labelled in this
paper as “adherence”).

This paper focuses only on direct COVID-19 related harms; there are clearly a range
of harms related to the pandemic and pandemic response which other groups within
Welsh Government are considering. As hospital admissions and deaths become
decoupled from covid cases, considering this balance of harms becomes more
important because 100 covid cases now do not produce the same harms as 100
covid cases did in November 2020.

      3. Background
Wales went into Level 4 restrictions on 20th December 2020 following the
identification of the new Variant of Concern 202012/01 (B.1.1.7, now known as
Alpha), increasing rates of confirmed COVID-19 case rates, and pressure on the
NHS.1 Over 70% of the population of Wales have now received at least one dose of
a vaccine. This includes over 95% of over 80 year olds and more than 88% of 50-54
year olds, the final group in the top nine priority groups Welsh Government targeted,
and achieved, to offer a first dose of the vaccine to by 15th April 2021. Vaccination is
now open for all those aged 18 year olds and over, and more than 69% of 18-29
year olds have received a first dose as at 20 June 2021. Wales has led the way in
terms of vaccination coverage in countries with populations above three million
people. This vaccination uptake will produce a reduction in hospitalisations and
deaths in vaccinated individuals compared to non-vaccinated individuals.

The case rate as of 19th June 2021 for Wales is 35 confirmed cases per 100k (7 day
rolling sum), positivity is around 2.8%, and case rate and positivity are currently
increasing after being low throughout April and May 2021. In addition, prevalence is
0.12% (as measured by the ONS COVID Infection Survey in the week to 19th June
2021) and antibody prevalence was 88.7% in the week to 10th June 2021 (as

1   Written Statement: Alert level four restrictions

                                                       4
measured by the COVID Infection Survey), indicating that a high proportion of people
have antibodies present either following natural infection or vaccination.

     4. Evidence Summary
The latest information about the COVID-19 situation in Wales can be found on the
Welsh Government website.2

     5. Updated modelling scenarios from Swansea University
Swansea University produced a range of modelled scenarios (60 in total) for the time
period up to end of March 2022. The methods have been described previously.3

Wales recently received model results from Warwick University and Imperial College
London as part of roadmap modelling carried out for SPI-M-O. This modelling was
really useful in triangulating the modelling that is produced by Swansea University
but has not been included here because it was produced before the Delta variant
started to become dominant so has been superseded. The box below describes the
current model run.

    Model Run      21/06/21 ‘Slowed’

                   Slowed scenario (remain in level 1 for 4 more weeks), increased
                   uptake, increased efficacy assumptions following Scotland EAVEII
                   test positive estimates (14/06/21) and PHE hospitalisation update
                   (Technical briefing 16: 18/06/21).

Level of restrictions in place across Wales

The Welsh Government has set out four alert levels for public response to threat
levels that require measures designed to control the spread of the virus and protect
people’s health.4 The first phase of the move to alert level 1 took place in Wales on 7
June 2021.5

2 Technical advisory Cell: summary of advice 2 April 2021
3 https://gov.wales/sites/default/files/publications/2021-03/technical-advisory-cell-modelling-update-
12-february-2021.pdf
4 Coronavirus Control Plan: Alert levels in Wales (14 December 2020).
5First Minister confirms phased move to alert level one | GOV.WALES

                                                   5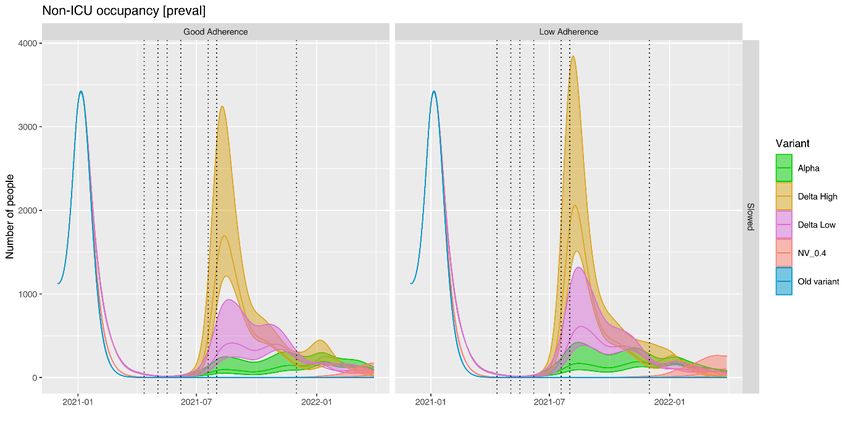
In the Swansea University model, the levels of restrictions are currently planned to
be eased according to the following schedule in 2021:

 Opening Schedule

 12 April             School Return plus level 3.5

 03 May               Alert level 3

 17 May               Alert level 2

 7 June               Alert level 1.5

 19 July              Alert level 1

 01 Aug               Alert level 0.5

 01 Dec               Alert level 0

The Swansea University roadmap modelling scenario has therefore changed since
the previous ‘accelerated’ scenario (included in previous modelling update, 5th May
2021) to move to alert level 2 (17th May instead of 24th May) and with a delay of
moving fully to alert level 1. The most recent published contact survey (COMIX) data
for Wales still shows lower mixing than pre-covid, but mobility data suggests that
mobility has increased since the end of May, although the biggest increase has been
for parks, which indicates people meeting up outside which has a lower transmission
risk.

Effectiveness of vaccines

A range of vaccine efficacy levels was chosen to reflect general ‘low’, ‘medium’ and
‘high’ efficacy scenarios based on current knowledge. This is a development from

                                          6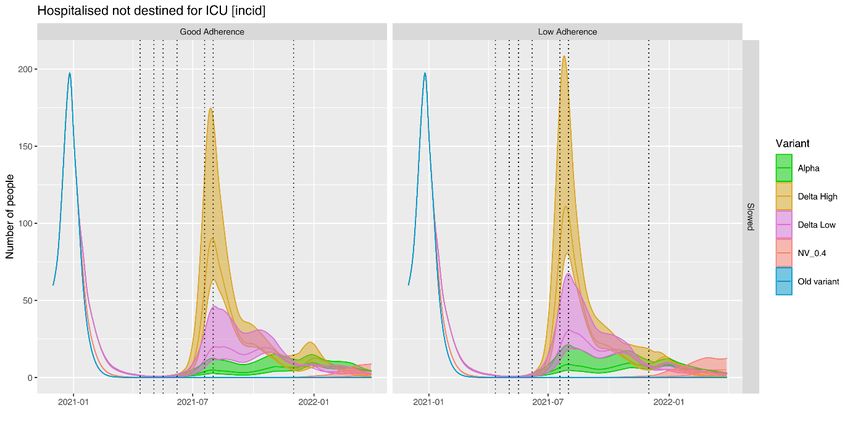
previous model runs in that the model separates out effectiveness in preventing
cases from effectiveness in preventing severe disease.
Vaccine Efficacy (3 scenarios representing uncertainty in each variant ribbon
plot)
Scenario Test positive Hospital / ICU / Death
Low 60% 85% (VEclin = 0.625)
Mid 70% 94% (VEclin = 0.80)
High 80% 98% (VEclin = 0.90)
Uptake of vaccines was as follows:
Vaccine Uptake (maximum at end of roll out)
40+ years 95%
30-39 years 90%
18-29 years 85%
Levels of ‘adherence’
Each of the scenarios modelled in this paper is presented with differing ‘adherence’
levels. These scenarios are modelled on the assumption of both:
‘Good adherence’ (where ‘adherence’ is at a level equivalent to what was
seen during the autumn firebreak in Wales)
‘Low adherence’ (where ‘adherence’ is at a level equivalent to what was seen
during December 2020 in Wales).
In this analysis, low or good adherence is in reference to individual’s numbers of
contacts, which may change as a result of motivation to comply, but also depending
on ability to comply, for instance if workplaces require them to return to working on-
site. So it is not only about adherence with the rules, but also how many contacts
people are having which may still be within the rules. We know that so far in the
pandemic, adherence has been high and there has been a huge collective effort to
7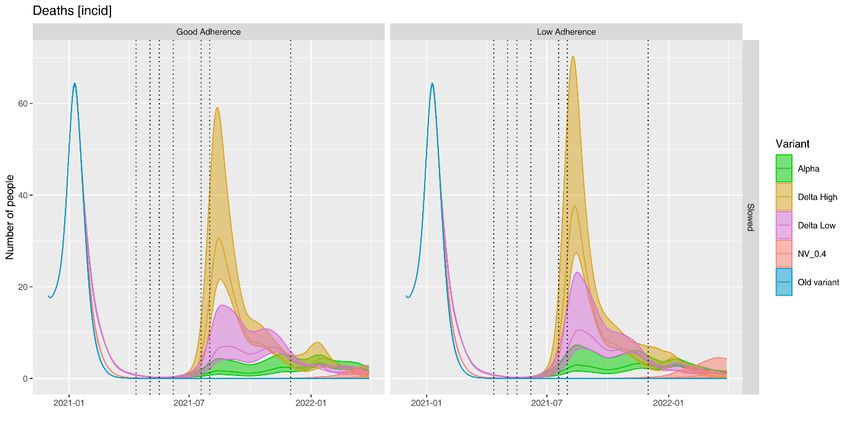
reduce contacts, take precautions (such as meeting outside, wearing face covering,
handwashing, etc) and control the virus. In these scenarios, good adherence is
similar to the reduction in contacts seen in the October 2020 firebreak, while low
adherence is more like the number of contacts seen in December 2020.

Impact of Variants
Current analysis from England suggests that the Delta variant is 40-80% more
transmissible than the previously dominant Alpha variant. On the charts below, ‘low
delta’ and ‘high delta’ are the lower and higher estimates respectfully of the new
dominant Delta variant. These represent scenarios where Delta is 30% and 80%
more transmissible than Alpha respectfully. In this case 30% was chosen rather than
40% as a lower bound because this would represent a mixture of Delta and Alpha.

In addition some other variants were modelled as shown below, but are not shown in
all charts as we have cut down to the most relevant scenarios.

 Variant Assumptions

 Blue            Original (m = 1)

 Red             Original + 20% (early Alpha assumption) (m = 1.2)

 Green           Alpha = Original + 40% (Alpha) (m = 1.4)

 Purple          Delta = Alpha + 30% (low estimate) (m = 1.9)

 Orange          Delta = Alpha + 80% (high estimate) (m = 2.7)

   6. Results Summary
All model scenarios predict an increase in cases in July 2021, with a peak in cases in
late July and a peak in hospitalisations and deaths in August 2021. If the Delta
variant effect is initially 30% more transmissible than Alpha variant (named low delta
scenarios), then there are estimated to be peaks of between around 700 and 2,800
COVID-19 cases per day. If it’s 80% more transmissible (named high delta
scenarios), there are estimated to be peaks of between around 3,400 and 7,700
COVID-19 cases per day. In reality, we may see the peak number of COVID-19
(symptomatic) cases falling somewhere between the low Delta and high Delta
scenarios.

                                          8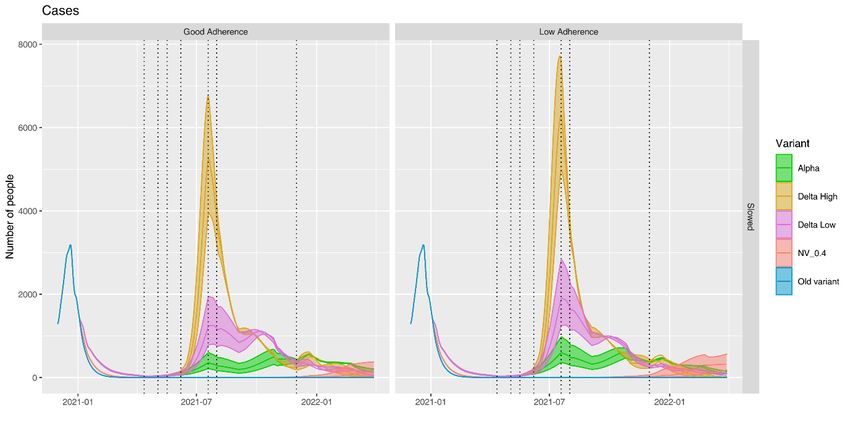
For each scenario, there are different levels of vaccine effectiveness which have a
       big impact on the overall trend in cases, hospital admissions and deaths. These
       scenarios suggest that the transmissibility of the Delta Variant of Concern (VOC) has
       the greatest impact on the number of cases, hospitalisations and deaths, with a
       smaller but important contribution from vaccine effectiveness.

       Figures 1, 2 and 3 compare actuals with model-estimated cases, hospital admissions
       and deaths under different scenarios of transmission (low Delta: 30% increased
       transmission relative to Alpha, high Delta: 80% increased transmission), adherence
       (low, good) and vaccine effectiveness (low, mid and high).

       These figures illustrate the uncertainty around the size and timing of the third
       COVID-19 wave, with the peak in daily cases ranging from well below the second
       wave peak in December 2020 to more than twice the height of the second wave’s
       peak under different scenarios. The uncertainty in model estimates are driven by the
       uncertainty in effectiveness of vaccines on the Delta variant, increased
       transmissibility of the Delta variant and adherence levels.

Figure 1. Modelled COVID-19 cases from 1st December 2020 to 1st December 2021; under
different scenarios of Delta increased transmission, different levels of adherence and different
levels of vaccine effectiveness. Source: SU model. Actuals from PHW.

                                                  9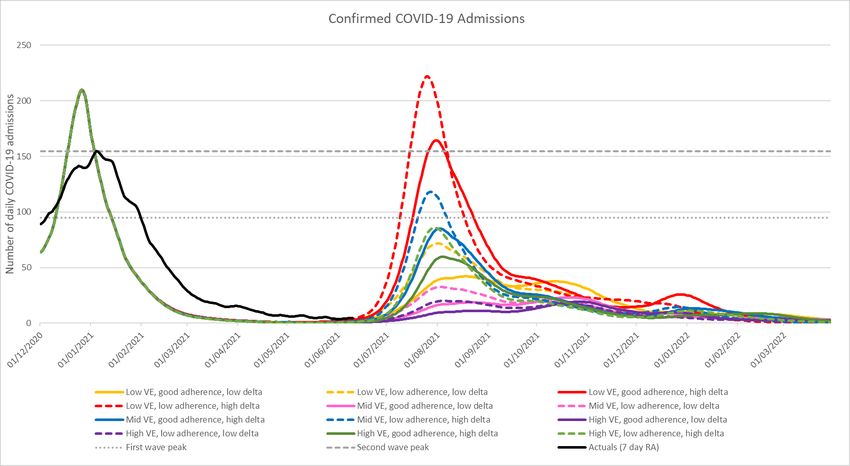
Figure 2 COVID-19 hospital admissions from 1st December 2020 to 1st December 2021; under
different scenarios of Delta increased transmission, different levels of adherence and different
levels of vaccine effectiveness. Source: SU model. Actuals from PHW.

 Figure 3 COVID-19 deaths from 1st December 2020 to 1st December 2021; under different
 scenarios of Delta increased transmission, different levels of adherence and different levels of
 vaccine effectiveness. Source: SU model. Actuals from PHW.

                                              10
Table 1A shows the total symptomatic cases (in future labelled as “cases”), deaths,
admissions and ICU admissions between 1 June 2021 and 31 August 2021
predicted for each scenario. For all scenarios, the number of cases and deaths
reduce as vaccine efficacy increases or adherence to restrictions improves.
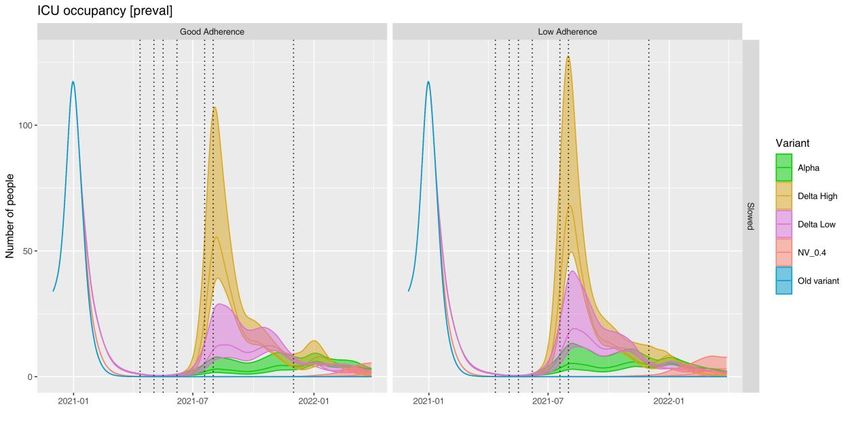
Table 1B shows the daily peaks of COVID-19 cases, deaths, admissions and ICU
admissions between 1 June 2021 and 31 August 2021 predicted for each scenario.
For all scenarios, the maximum number of cases and deaths reduce as vaccine
efficacy increases or adherence to restrictions improves.
Table 1A: Totals (between 1 June 2021 and 31 August 2021)
Scenario Cases Deaths Admissions ICU
Admissions
Low VE Good Adh Low Delta 90,700 480 2,100 130
Low VE Low Adh Low Delta 138,900 870 3,400 210
Mid VE Good Adh Low Delta 59,400 200 900 50
Mid VE Low Adh Low Delta 98,200 380 1,600 90
High VE Good Adh Low Delta 38,100 120 500 30
High VE Low Adh Low Delta 67,500 230 1,000 60
Low VE Good Adh High Delta 243,200 1,770 6,700 410
Low VE Low Adh High Delta 285,600 2,400 8,300 500
Mid VE Good Adh High Delta 196,100 880 3,500 210
Mid VE Low Adh High Delta 235,700 1,260 4,500 270
High VE Good Adh High Delta 155,000 600 2,500 150
High VE Low Adh High Delta 192,800 890 3,400 200
Cases and admissions are rounded to the nearest 100. Deaths and ICU admissions
are rounded to the nearest 10. “VE” is used to indicate vaccine efficacy. “Low Adh”
and “Good Adh” mean low adherence and good adherence respectively.
11Table 1B: Daily peaks (between 1 June 2021 and 31 August 2021)
Scenario Cases Deaths Admissions Bed ICU Bed
Occupancy Occupancy
Low VE Good Adh Low Delta 1,600 10 40 800 30
Low VE Low Adh Low Delta 2,800 20 70 1,400 40
Mid VE Good Adh Low Delta 1,000 10 20 400 10
Mid VE Low Adh Low Delta 1,900 10 30 600 20
High VE Good Adh Low Delta 700 - 10 200 10
High VE Low Adh Low Delta 1,300 10 20 400 10
Low VE Good Adh High Delta 5,900 50 160 3,000 100
Low VE Low Adh High Delta 7,700 70 220 4,000 130
Mid VE Good Adh High Delta 4,500 30 90 1,600 50
Mid VE Low Adh High Delta 6,300 40 120 2,100 70
High VE Good Adh High Delta 3,400 20 60 1,100 30
High VE Low Adh High Delta 5,000 30 90 1,600 50
Cases and bed occupancy are rounded to the nearest 100. Admissions, deaths and
ICU bed occupancy are rounded to the nearest 10. “VE” is used to indicate vaccine
efficacy. “Low Adh” and “Good Adh” mean low adherence and good adherence
respectively.
12Interpretation – new Reasonable Worst Case (RWC) and Most Likely Scenario
(MLS)
Within Wales, the reasonable worst case scenario (RWC) and most likely scenario
(MLS) are used for planning for the NHS and others. For these scenarios, it may be
necessary to update the RWC and MLS.
To more accurately reflect the situation with the Delta variant, we therefore consider
the new RWC scenario to be: central vaccine efficacy (70% effective against COVID-
19 cases and 94% effective against hospital admissions and deaths due to COVID-
19), “low” adherence, and high variant transmissibility which represents a scenario
where Delta is 80% more transmissible than Alpha (“high Delta” scenario).
At the same time, we can update the Most Likely Scenario (MLS) with more recent
data. We consider that the new MLS is likely to be the following: “good” adherence of
existing restrictions, central vaccine efficacy (70% effective against COVID-19 cases
and 94% effective against hospitalisations and deaths), and low Delta variant
transmissibility which represents a scenario where Delta is 30% more transmissible
than Alpha (“high Delta” scenario). However there is such uncertainty at the moment,
it may make sense to delay producing a new MLS.
Tables 2A and 2B show the totals and daily peaks between 1 June 2021 and 30
March 2022 for the new proposed RWC and MLS scenarios.
Figures 4, 5 and 6 show the new proposed RWC scenarios. The chart also includes
the current April 2021 RWC for comparison as well as the observed data (actuals).
Tables 3A and 3B show the totals and daily peaks by quarter for the new proposed
RWC scenario.
Figures 7, 8 and 9 show the new proposed MLS scenarios. The chart also includes
the current April 2021 MLS for comparison as well as the observed data (actuals).
Tables 4A and 4B show the totals and daily peaks by quarter for the new proposed
MLS scenario.
In all of the following tables, COVID-19 cases are rounded to the nearest 100.
Deaths and ICU admissions are rounded to the nearest 10. Total COVID-19
admissions are rounded to the nearest 100 and peak daily COVID-19 admissions
are rounded to the nearest 10.
There is currently not enough data to determine how much more transmissible the
Delta variant will be over the Alpha variant and the true transmission advantage is
likely to be in the middle somewhere.
13Table 2A: Totals for new proposed RWC and MLS between 1 June 2021 and 30
March 2022
Scenario Cases Deaths Admissions ICU Admissions
RWC 318,500 2,270 6,800 410
MLS 171,500 1,040 3,200 190
Table 2B: Daily peaks for new proposed RWC and MLS between 1 June 2021 and
30 March 2022
Scenario Cases Deaths Admissions ICU Admissions
RWC 6,300 40 120 -
MLS 1,300 10 20 -
Table 3A: Totals by quarter for the new proposed RWC scenario
Quarter Cases Deaths Admissions ICU Admissions
01/06/21 – 31/08/21 235,700 1,260 4,500 270
01/09/21 – 30/11/21 60,200 730 1,600 90
01/12/21 – 28/02/22 22,100 270 700 40
Table 3B: Daily peaks by quarter for the new proposed RWC scenario
Quarter Cases Deaths Admissions
01/06/21 – 31/08/21 6,300 40 120
01/09/21 – 30/11/21 1,100 20 40
01/12/21 – 28/02/22 500 - 10
14Figure 4 COVID-19 cases under potential new RWC based on mid vaccine effectiveness.
Figure 5 COVID-19 hospital admissions for new RWC with mid vaccine effectiveness for
preventing admissions
15Figure 6 COVID-19 deaths under new RWC assuming mid vaccine effectiveness in
preventing deaths.
Table 4A: Totals by quarter for the new proposed MLS scenario
Quarter Cases Deaths Admissions ICU Admissions
01/06/21 – 31/08/21 59,400 200 900 50
01/09/21 – 30/11/21 83,800 580 1,700 100
01/12/21 – 28/02/22 23,500 220 800 50
Table 4B: Daily peaks by quarter for the new proposed MLS scenario
Quarter Cases Deaths Admissions
01/06/21 – 31/08/21 1,000 10 20
01/09/21 – 30/11/21 1,300 10 20
01/12/21 – 28/02/22 500 - 10
16Figure 8 COVID-19 Cases under new MLS (most likely scenario).
Figure 7 COVID-19 hospital admissions under potential new MLS (most likely scenario)
17Figure 9 COVID-19 deaths under potential new MLS (most likely scenario).
18Appendix 1. Charts showing all scenarios
Note: on these charts the ribbon bands show a range from high, mid, low vaccine
effectiveness.
1920
21
You can also read