Combined heliospheric modulation of galactic protons and helium nuclei from solar minimum to maximum activity related to observations by PAMELA ...
←
→
Page content transcription
If your browser does not render page correctly, please read the page content below

Combined heliospheric modulation of galactic
protons and helium nuclei from solar minimum to
maximum activity related to observations by
PoS(ICRC2021)1337
PAMELA and AMS02
M.D. Ngobenia,b,*, O.P.M. Aslama, D. Bisschoffa, D.C. Ndiitwania,b, M.S. Potgieterc, M.
Boeziod, N. Marcellie, R. Muninid, V.V. Mikhailov,f S.A. Koldobskiyf
a Center for Space Research, North-West University, 2520, Potchefstroom, South Africa
b School of Physical and Chemical Sciences, North-West University, 2735, Mmabatho, South Africa
c Institute for Experimental and Applied Physics, Christian Albrechts University in Kiel, 24118, Kiel,
Germany
d INFN, Sezione di Trieste I-34149 Trieste, Italy
e INFN, Sezione di Rome I-00133 Rome, Italy
f National Research Nuclear University MEPHI, RU-115409, Moscow, Russia
E-mail: donald.ngobeni@nwu.ac.za
The global features of the modulation of galactic cosmic ray protons and helium nuclei are
studied in the heliosphere from minimum to maximum solar activity with a comprehensive,
three-dimensional drift model and compared to observations measured by PAMELA and AMS02
taken between 2006 and 2017. Combined with accurate very local interstellar spectra (VLIS) for
protons and helium nuclei, this provides the opportunity to study in detail how the proton to
helium (p/He) ratio at different rigidities behaves with increasing solar activity, through solar
maximum conditions and afterward. In particular, the effects at the Earth of the difference in
their VLIS’s, mass-to-charge ratio (A/Z) and those caused by the main modulation mechanisms
are investigated. We find that the rigidity slopes of the parallel and perpendicular diffusion
coefficients below 4 GV should change differently before solar maximum than afterwards to
reproduce the observed p/He ratio, in addition to scaling down (up) the values of the diffusion
and drift coefficients towards (after) solar maximum. The compatibility between the model
computations and observations indicate that the PAMELA and AMS02 measurement of p/He
above ~ 5 GV precisely reveals the difference in the rigidity slopes of their VLIS’s at these
rigidities.
37th International Cosmic Ray Conference (ICRC 2021)
July 12th – 23rd, 2021
Online – Berlin, Germany
*
Presenter
Copyright owned by the author(s) under the terms of the Creative Commons
Attribution-NonCommercial-NoDerivatives 4.0 International License (CC BY-NC-ND 4.0). https://pos.sissa.it/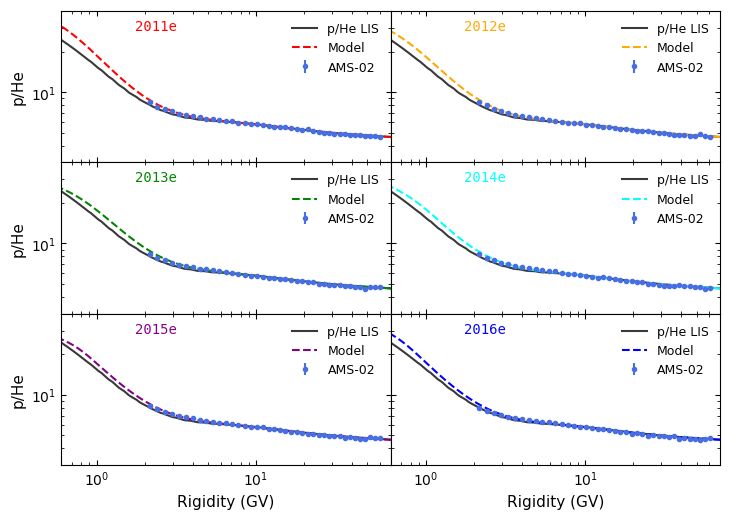
Modeling proton to helium ratios                                                   M.D. Ngobeni

1. Introduction

      The cosmic ray proton (p) to total Helium (He) ratio has been a matter of active debate in
solar modulation studies since the first report by [1] that the ratio p/He observed by AMS02 is
not constant as a function of time at rigidities below 3 GV. In particular, it was shown that at
these rigidities the observed p/He decreases from 2014 in the A > 0 magnetic cycle in response
to the declining level of solar activity. It remains to be seen whether the observed time
dependence in p/He is a general modulation pattern where a decreasing (increasing) ratio
coincide with the increasing (decreasing) intensities of both species. Recently [2] studied the p/

                                                                                                     PoS(ICRC2021)1337
He ratio between 2006 and 2009 using observations from the PAMELA experiment. They found
an overall decrease in p/He of about 10% from 2006 to 2009 below 1 GV, which may indicate a
general modulation pattern. Regarding the cause(s) of the time dependence in p/He, there is a
consensus that it is due to differences in their mass-to-charge ratios (A/Z) and their very local
interstellar spectra (VLIS) ([3 - 5]). What has also been known over a long period is that p/He
can be influenced by the 3He2 and 4He2 isotopic mixing (see discussion by [5]), an aspect that
has been overlooked in comprehensive modelling until recently ([3 - 4]). From a numerical
modelling point of view, separating the modulation effects of 3He2 and 4He2 is crucial for
understanding exactly how p/He, p/3He2, p/4He2 and 3He2/4He2 change with rigidity and time (see
also [6]).
      In this paper the modelling is devoted to repeating the essence of the study done by [3] for
the period of increasing solar activity after 2009 until the end of the PAMELA mission [7] and
with the addition of AMS02 observations since May 2011 [1]. This requires a focused and more
advanced numerical study because simulating GCR modulation during times of maximum solar
activity, including a heliospheric magnetic field (HMF) polarity reversal, is challenging (see
[8]). Hence, refined computations, especially at high rigidity with P > 10 GV where modulation
effects are relatively small and easily overlooked, perhaps undervalued in numerical modelling,
are crucial when illustrating the intensity ratios of different GCRs. Results of numerical
modeling and comparison with observations in this paper provide insight into how the rigidity
slopes of the diffusion coefficients (DCs) below 4 GV change during the HMF polarity reversal
epoch; and at what rigidity p/He measured by PAMELA and AMS02 begins to reveal the
difference in the rigidity slopes of their VLIS’s.

2. Modulation model and the very local interstellar spectra

2.1. Numerical model

      The numerical model used in this study is based on solving the transport equation by [9].
The detailed essentials together with the elements of the diffusion tensor have been published by
[3] and [6]. In this drift-model the magnitude of the HMF and the tilt angle of the wavy
heliospheric current sheet are changed with time from 2006 to 2017, including the HMF’s
‘polarity’ reversal. In addition, the values and the rigidity dependence of the DCs were adjusted,
especially in terms of the assumed power-law slopes, reported in Figure 1 of [6] and the drift
coefficient (indicated as drift scale) as reported in Figure 5 of [8].

                                                2
Modeling proton to helium ratios M.D. Ngobeni
PoS(ICRC2021)1337
Figure 1: VLIS for galactic protons (p, solid red line), 3He2 (solid blue line) and 4He2 (dashed blue line) as
a function of rigidity computed with GALPROP. The axis values in red correspond to the proton VLIS,
whereas the axis in blue to the 3He2 and 4He2 VLIS’s. The VLIS for total helium (He) can be obtained by
adding together the VLIS’s for 3He2 and 4He2.
2.2. Very local interstellar spectra for p, 3He2 and 4He2
The VLIS’s of GCRs are of central importance in the general understanding of the global
and total heliospheric modulation because they always provide the input spectra in numerical
models to be modulated from a given HP position up to the Earth. In this work, the proton VLIS
is used as described in detail by [10], whereas the VLIS for He is derived by adding the
GALPROP computed VLIS’s of 3He2 and 4He2 but modestly adjusted according to AMS02
observations for 3He2/4He2 (see [6]).
Figure 1 depicts three VLIS’s, for p, 3He2 and 4He2 as a function of rigidity specified at the
HP position assumed to be at a radial distance of 122 AU from the Sun. Notice that apart from
the large difference in intensity levels, the slopes of the VLIS’s for p, 3He2 and 4He2 are
significantly different at low rigidities, also having spectral peaks at different rigidity values.
These features greatly influence the difference in the total amount of p and He modulation
between the HP and the Earth for a given rigidity range and also the shape of their modulated
spectra at Earth as will be illustrated in the next figure. With individually separated VLIS’s for
3
He2 and 4He2, the modulated p/He ratio can be computed with improved confidence and
accuracy.
3Modeling proton to helium ratios M.D. Ngobeni
PoS(ICRC2021)1337
Figure 2: Modulated p (red dashed lines), 3He2 (blue dashed lines) and 4He2 (purple dashed lines) spectra,
with respect to their respective VLIS (solid lines), computed as a function of rigidity, shown at the Earth
for six periods including Bartel rotations (BR) at the end of each year: 2433 (11/11/20 - 11/12/16; 2011;
2011e), 2447 (12/12/02 - 12/12/28; 2012e), 2460 (13/11/18 - 13/12/14; 2013e), 2474 (14/12/01 -
14/12/27; 2014e), 2487 (15/11/17 - 15/12/13; 2015e) and 2501 (16/11/29 - 16/12/25; 2016e). These
modulated spectra are compared to AMS02 observations [1] (coloured filled circles).
3. Comparison of modelling results with observations
3.1. Spectra
Figure 2 depicts the computed galactic p, 3He2 and 4He2 modulated spectra with respect to
their VLIS’s as a function of rigidity, in comparison with the corresponding observed AMS02
spectra at the Earth. These modulated spectra exhibit a characteristic peak value for each
species, but the rigidity where the maximum occurs gradually shifts to higher values with
increasing A/Z. This figure illustrates the features and characteristics of the modulated spectra at
the Earth of species with different VLIS’s and A/Z. The essence of this figure is to show that,
using the same set of modulation parameters, galactic p, 3He2 and 4He2 spectra from AMS02
taken between 2011 and 2017 are simultaneously well reproduced by our numerical model. The
explicitly distinguished modulation effects of 3He2 and 4He2 as done in Figure 2, can then be
used to compare the simulated p/He with how the observed ratios of both PAMELA and AMS02
had changed as a function of rigidity and time between 2006 to 2017.
4Modeling proton to helium ratios M.D. Ngobeni
PoS(ICRC2021)1337
Figure 3: The p/He ratios as a function of rigidity for six time periods between 2011e to 2016e. Computed
and observed ratios (with uncertainties depicted by error-bars) are represented by the coloured lines and
symbols, respectively. The corresponding p/He VLIS ratio is given by dark grey lines in each panel. The
AMS02 observations are reported by [1].
3.2. The proton to Helium ratios
As mentioned before, when considering the effects caused by differences in VLIS’s or by
A/Z-values on the p/He ratio at the Earth, it becomes relevant to illustrate the contribution by
3
He2 and 4He2 isotopic mixing. For comparison with p/He observations by PAMELA and
AMS02, the computed spectra of 3He2 and 4He2 are added up to describe what is called the total
He spectra. Figure 3 shows the computed p/He and those observed from AMS02 as a function of
rigidity at six different times, between 2011e and 2016e. Also shown repeatedly in each panel is
the VLIS ratio. Overall the value and shape of p/He are reproduced quite well at all rigidities
with the numerical modulation model. It is noted that the rigidity dependence of the ratio of the
modulated spectra closely follows that of the corresponding VLIS ratio with P >∼5 GV, and it
is doing so independently of the assumed modulation conditions. But, with decreasing rigidity it
deviates progressively from these values (for even lower rigidities, see [3]). This indicates that
the observed p/He by AMS02 above ~ 5 GV essentially reveals the difference in the rigidity
dependence of the VLIS’s for protons and He already at these rigidities, providing evidence
about the difference in their origin and propagation in the interstellar medium.
5Modeling proton to helium ratios M.D. Ngobeni
PoS(ICRC2021)1337
Figure 4: The p/He ratios at low, 1.92 GV - 2.40 GV, and high rigidities, 7.76 GV - 8.45 GV, as a function
of time. Observed ratios from PAMELA and AMS-02 are given by the green triangles and blue circles
respectively; the computed ratios from the model are given by the solid lines (with the shaded bands
representing a 3% variation in the p VLIS) for the time periods as indicated, whereas. the grey dotted
lines indicate the period of the polarity reversal of the Sun’s magnetic field. The p/He AMS02 and
PAMELA observations are reported by [1] and [2], respectively.
Figure 5: Computed p/3He2 (green line), p/4He2 (blue line) and p/He (red line) at 2.40 GV as a function of
time, normalized with respect to the ratio at the end of 2006. The vertical dotted lines again indicate the
period of the polarity reversal of the Sun’s magnetic field.
6Modeling proton to helium ratios M.D. Ngobeni
Figure 4 shows both the AMS02 and PAMELA observed p/He, from November 2006 to
May 2017 at three closely matching rigidity ranges, and compared with the computed p/He done
at the highest rigidity of the indicated bin. The shaded band associated with the modelled ratio
(red solid line) represents an estimated 3% error in proton modulation caused by the possible
deuteron isotopic mixing (see [11]). The vertical dotted lines indicate the polarity reversal phase
of the HMF, a period without a well-defined HMF polarity. Evidently, at rigidities ≤ 2.40 GV
the modelled p/He follows the same trend as the observed ratio, that is, slightly decreasing
between 2006 and 2009 with slightly decreasing solar activity in the A < 0 cycle solar minimum
period but gradually increasing from 2009 to reach a maximum around the end of 2013 during
solar maximum conditions, then decreasing gradually to reach a minimum level in 2017 in the A
PoS(ICRC2021)1337
> 0 magnetic cycle. While at rigidities ≥ 7.76 GV, the observed and modelled ratios are both
steady over time. It is further noted that the decreasing (increasing) computed values of p/He
coincide with the increasing (decreasing) intensities of both protons and He. We consider this to
be indicative of a general modulation pattern (or trend) for GCRs with different A/Z below 5
GV, with the strength (changing rate with time) of the trend being different before and after the
period of maximum solar activity. This is reasonable because there is no compelling reason why
modulation conditions during the ascending phase of solar activity until and up to maximum
activity, with a reversal in HMF polarity, should develop in the same manner than after solar
maximum going into a descending phase of solar activity up to solar minimum.
Figure 5 shows the modelled p/3He2, p/4He2 and p/He as a function of time relative to the
end of 2006 to highlight the time variation in these ratios from 2006 to 2017. Evidently, the time
variation of p/He follows that of p/4He2, (this remains the case even though p/ 3He2 is a factor of
~ 6 higher than p/ 4He2 at this rigidity) with the trend in p/3He2 not changing significantly before
solar maximum but decreases noticeably after the solar maximum conditions. However, it is our
opinion that these trends in time are similar, just more pronounced for the first mentioned ratios.
4. Summary and conclusions
The availability of simultaneous and precise measurements of GCR protons, 3He2 and 4He2
by AMS02 from 2011 to 2017, in addition to p/He measured by PAMELA between 2006 to
2009, has motivated the detailed modelling of their ratios in this work. The modelling of 3He2
and 4He2 is done separately and then added together to obtain the modulation for total He. In this
way, p/He is computed more accurately as a function of rigidity and time, taking into
consideration the contribution of the He isotopic mixing. This is quite important to understand
how differently GCRs with a dissimilar A/Z are modulated down to a few hundred MV. We find
that the 3D drift model reproduces AMS02 measurements of protons and both helium isotopes
quite well (Figure 2) when using the exact same set of modulation parameters including three
diffusion coefficients and the drift scale. This indicates that there is no reason to believe that
fundamental differences exist between these GCRs when modulated inside the heliosphere. The
modulation features noted in Figures 2 to 4 lead to three conclusions: 1) At rigidity below about
3 GV the decreasing (increasing) values of the computed p/He coincide with the increasing
(decreasing) intensities of both species; 2) A time dependence in the rigidity slopes of the
parallel and perpendicular diffusion coefficients below 4 GV is required to reproduce the
observed p/He before solar maximum conditions and afterward, in addition to scaling down (up)
7Modeling proton to helium ratios M.D. Ngobeni
the values of the diffusion and drift coefficients; and 3) The AMS02 measurement of p/He
above ~ 5 GV reveals the difference in the rigidity slopes of their VLIS’s already at these
rigidities, thus providing evidence about their origin and propagation in the interstellar medium.
Acknowldgement
MDN thanks the SA National Research Foundation (NRF) for partial financial support under the
Joint Science and Technology Research Collaboration between SA and Russia (Grant no:
118915) and BAAP (Grant no: 120642). He also acknowledges that the opinions, findings and
conclusions or recommendations expressed in any publication generated by the NRF supported
research is that of the authors alone, and that the NRF accepts no liability whatsoever in this
PoS(ICRC2021)1337
regard. DB and OPMA acknowledge the financial support from the NWU post-doctoral
programme. VVM acknowledges the financial support from the Russia Foundation for Basic
Research (RFBR) according to research project no.19-52-60003. RM acknowledges partial
financial support from the INFN Grant “giovani”, project ASMDM. We thank the GALPROP
developers and their funding bodies for access to and use of the GALPROPWebRun service as
fully acknowledged in [10].
References
[1] M. Aguilar et al., Phys.Rev. Lett. 123, 181102 (2019)
[2] N. Marcelli et al., Astrophys. J. 893, 145 (2020)
[3] M.D. Ngobeni et al., Astrophys & Space Sci. 365, 182 (2020)
[4] C. Corti et al., Astrophys. J. 871, 153 (2019)
[5] N. Tomassetti et al., Adv. Space Res. 64, 12 (2019)
[6] M.D. Ngobeni et al., Proc. Sci (ICRC 2021)
[7] M. Martucci et al., Astrophys. Lett, 854, L2 (2018)
[8] O.P.M. Aslam et al. Astrophys. J, 909, 215 (2021)
[9] E.N. Parker, Planet. Space Sci, 13, 9 (1965)
[10] D. Bisschoff et al., Astrophys. J, 878, 59 (2019)
[11] O. Adriani et al., Astrophys. J, 818, 68 (2016)
8You can also read