Third Quarter FY 2021 Earnings Call Presentation - Thursday, March 18, 2021 ADD COVER IMAGE HERE - Seeking ...
←
→
Page content transcription
If your browser does not render page correctly, please read the page content below
ADD COVER IMAGE HERE

Third Quarter FY 2021 Earnings Call Presentation
             Thursday, March 18, 2021
                                                   Art © Dav Pilkey. DOG MAN ™/® Dav Pilkey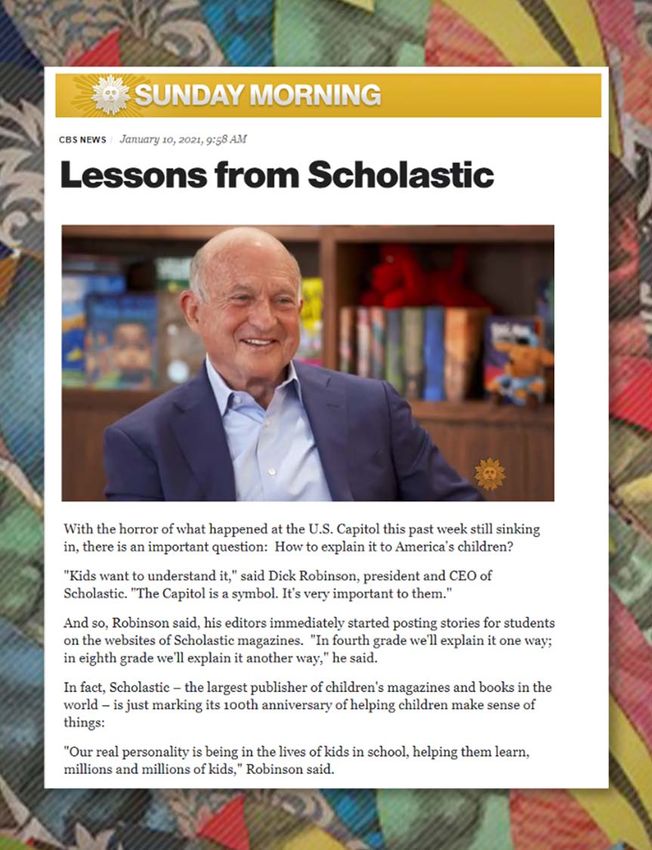
Forward-Looking Statements

This presentation contains certain forward-looking statements. Such forward-looking
statements are subject to various risks and uncertainties, including those arising from
the continuing impact of COVID-19 related measures taken by governmental authorities,
school administrators, or suppliers or customers which may curtail or otherwise
adversely affect certain of the Company’s business operations, and the conditions of the
children’s book and educational materials markets generally and acceptance of the
Company’s products in those markets, as well as other risks and factors identified from
time to time in the Company’s filings with the Securities and Exchange Commission.
Actual results could differ materially from those currently anticipated.
    2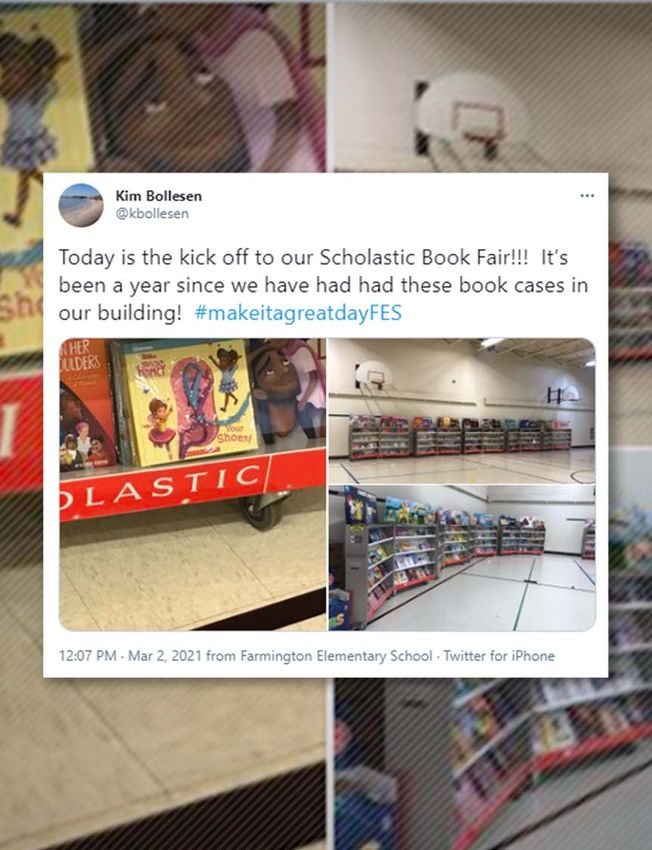
Regulation G

Today’s comments include references to certain non-GAAP financial measures as
defined in Regulation G. The reconciliation of these non-GAAP financial measures with
the relevant GAAP financial information and other information required by Regulation G
is provided in the Company’s earnings release, which is posted on the Company’s
investor relations website at investor.scholastic.com.

   3

Richard Robinson
Chairman, President
and Chief Executive Officer

4

Third Quarter FY 2021

• It has been one year since the pandemic shutdown
  began, closing schools throughout the U.S. and around
  the globe.
                                                             ADD IMAGE HERE;
• A recent feature on CBS Sunday Morning reminded us          FULL WIDTH AND
                                                            HEIGHT OF GREY BOX
  of the many times Scholastic has been there to support
  educators and students throughout its 100-year history.

    5
Third Quarter FY 2021
• In the third quarter, despite a $96 million, or 26%, decline in revenue, mainly in Book Fairs, we
were able to lower our seasonal operating loss year-over-year because of significant cost
reductions.
• For the nine months year-to-date, revenue declined by $304 million to approximately $900
million compared to our pre-COVID results last year, while operating income decreased by
only $9.7 million excluding one-time items.
• Management’s aggressive actions to change the Company’s operating model and reduce its
cost base have largely offset the bottom-line impact of pandemic-related disruptions and
should provide greater operating leverage going forward.
6Children’s Book Publishing &
Distribution
• As schools across the U.S. are returning to in-classroom instruction,
the climate for book fairs is improving and we are continuing to tailor
fair formats to enable safe, flexible experiences.
• There is an uptick in Q4 fair bookings to-date, enabled by our ADD IMAGE HERE;
expanded marketing programs. FULL WIDTH AND
HEIGHT OF GREY BOX
• In Clubs, we have sharply improved the bottom line, as we
reengineer the business to drive profitability on reduced revenues.
• The Clubs pivot to home delivery options has led to higher revenue
per transaction from parents, helping profitability.
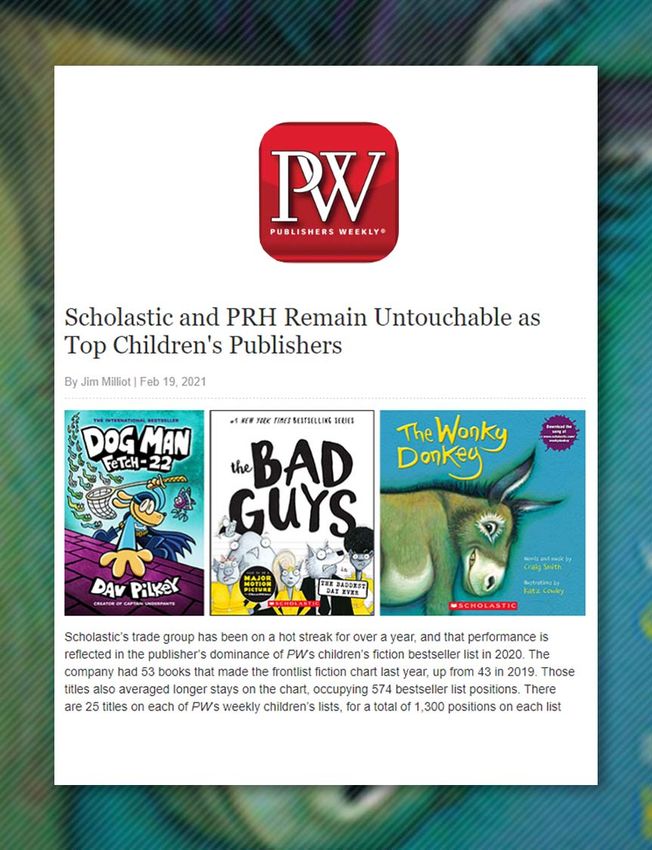
7Children’s Book Publishing &
Distribution
• Fiscal 2018 to-date, Trade publishing revenues have grown by
approximately 50% domestically and 30% internationally.
• Publishers Weekly noted Scholastic’s “unstoppable” performance in
children’s fiction. ADD IMAGE HERE;
FULL WIDTH AND
• We are building the audience for our iconic characters and series HEIGHT OF GREY BOX
through an increasing pipeline of streaming, television, and feature
film development.
o Stillwater on Apple TV+ has launched in 107 countries and was
nominated for an Annie Award.
o Playing Cupid was a ratings hit on the Hallmark Channel.
8International
• In our International segment, we have had significant growth in
profits throughout the year, thanks in part to successful revenue
increases in Trade.
• Fair counts in Canada and the U.K. declined due to COVID-19, ADD IMAGE HERE;
however the impact on income was mitigated, in part, by cost FULL WIDTH AND
savings programs. Fairs in Australia have continued to be strong. HEIGHT OF GREY BOX
• In Asia, we are investing in new English language learning
products for schools and homes, and continue to expand our
franchised schools and direct sales to parents via Internet
marketers in China.
• We are also working with a local partner to develop digital content
designed for English education and teaching solutions in Korea.
9Education
• We are forming a new Education Solutions group that combines
our classroom books and curriculum division with the classroom
Courtesy of: Governor's Early Literacy Foundation
magazines, digital subscriptions, and teaching resources group,
beginning June 1st.
ADD IMAGE HERE;
• This new structure will put us in an excellent position to capture FULL WIDTH AND
growth opportunities focused on literacy improvement. HEIGHT OF GREY BOX
• The unprecedented amount of federal stimulus funds dedicated to
supporting K–12 education will be a “game changer” for educators
and districts.
10Summer Learning 2021 • Scholastic is putting resources behind areas that address both the urgent and longer-term needs of educators and students. • Through book packs and other programs, we have a history of supporting summer learning success. • We are well-positioned to be the ideal partner this summer because of our deep knowledge of how to engage kids in reading and accelerate learning. • While our free summer reading program continues to serve as an entry point for many, this year we are creating new offers which build on what we know works well. 11
Scholastic Priorities

• Our major opportunities and priorities over the next years lie in the following areas:
        o rebuilding Book Fair revenues;
        o expanding the reach of our intellectual property through trade and international businesses, and
          developing more streaming, television, and feature film properties;
        o increasing investment in and expanding the reach of our Education content, especially digital;
        o enabling more parents to acquire children’s books directly via home shipment;
        o growing our international English language learning business in Asia;
        o continuing to make it easier for customers to acquire products and information through our digital
          platforms; and
        o continuing to simplify processes and lower costs.

   12
Kenneth Cleary Chief Financial Officer 13
Q3 FY21 Earnings                                                               (before and after one-time items)

      In $ Millions (except per share)
                                                                        Third Quarter 2021                      Third Quarter 2020                      Fiscal Year to Date 2021                  Fiscal Year to Date 2020

                                                                                           Excluding                               Excluding                                  Excluding                                  Excluding
                                                                    As         One-Time    One-Time       As           One-Time    One-Time          As          One-Time     One-Time         As          One-Time      One-Time
                                                                  Reported       Items       Items      Reported         Items       Items         Reported        Items        Items        Reported        Items         Items
         Diluted earnings (loss) per share   (1)
                                                                     ($0.41)       $0.26      ($0.14)       ($1.25)        $0.91       ($0.34)         ($0.54)       $0.65         $0.11         ($0.89)       $1.03         $0.15

         Net income (loss)            (2)
                                                                     ($13.9)        $9.1       ($4.8)       ($43.3)        $31.4       ($11.9)         ($18.6)       $22.3          $3.7         ($30.8)       $35.9             $5.1

              Children's Book Publishing and Distribution   (3)
                                                                      ($6.6)        $2.9       ($3.7)         $2.2          $0.0         $2.2            $1.9          $2.9         $4.8          $70.1          $0.0        $70.1
              Education                                               10.1            -         10.1           9.8            -           9.8            19.8            -          19.8            2.6              -            2.6
              International     (4)
                                                                       (1.1)         0.2        (0.9)          (3.7)          -           (3.7)          23.3           2.8         26.1            4.3              -            4.3
              Overhead    (5)
                                                                      (26.6)         9.2       (17.4)        (68.3)         43.2        (25.1)          (77.4)         24.1        (53.3)        (119.3)         49.4        (69.9)
         Operating income (loss)                                     ($24.2)       $12.3      ($11.9)       ($60.0)        $43.2       ($16.8)         ($32.4)       $29.8         ($2.6)        ($42.3)       $49.4             $7.1

         1.    Earnings (loss) per share are calculated on non-rounded net income (loss) and shares outstanding. Recalculating earnings per share based on numbers rounded to millions may not yield the results as presented.
         2.    In the three and nine months ended February 28, 2021, the Company recognized a benefit for income taxes in respect to one-time pretax charges of $3.2 and $7.5, respectively. In the three and nine months ended
               February 29, 2020, the Company recognized a benefit for income taxes in respect to one-time pretax charges of $11.8 and $13.5, respectively.
         3.    In the three and nine months ended February 28, 2021, the Company recognized pretax asset impairment of $2.4 and branch consolidation costs of $0.5 related to its plan to permanently close 12 out of its 54 book fair
               warehouses in the U.S.
         4.    In the three and nine months ended February 28, 2021, the Company recognized pretax severance of $0.2 and $2.5, respectively, and pretax branch consolidation costs of $0.0 and $0.3, respectively.
         5.    In the three and nine months ended February 28, 2021, the Company recognized pretax severance of $0.6 and $15.5, respectively, and pretax asset impairment charges of $8.5 and branch consolidation costs of $0.1
               related to its plan to cease use of certain leased office space and consolidate into its company-owned New York headquarters building. In the three and nine months ended February 29, 2020, the Company recognized
               pretax severance of $3.2 and $6.9, respectively, and a pretax asset write down of $40.0 related to the Company’s club and fair channels. In the nine months ended February 29, 2020, the Company recognized pretax
 14            settlement charges of $2.5.
Q3 FY21 Adjusted EBITDA
Three Months Ended Nine Months Ended
In $ Millions 2/28/2021 2/29/2020 2/28/2021 2/29/2020
Earnings (loss) before income taxes as reported ($22.0) ($60.1) ($26.2) ($42.3)
One-time items before income taxes 12.3 43.2 29.8 49.4
Earnings (loss) before income taxes excluding one-time items (9.7) (16.9) 3.6 7.1
Interest (income) expense 1.7 (0.3) 4.1 (1.0)
1
Depreciation and amortization 15.9 16.1 49.3 48.1
Amortization of prepublication costs 6.3 6.7 19.0 19.7
2
Adjusted EBITDA $14.2 $5.6 $76.0 $73.9
1. For the three and nine months ended February 28, 2021, amounts include depreciation of $0.8 and $2.4, respectively, recognized in cost of goods sold, amortization of deferred financing costs of $0.2 and $0.4,
respectively, and amortization of capitalized cloud software of $0.2 and $0.5, respectively, recognized in selling, general and administrative expenses. For the three and nine months ended February 29, 2020, amounts
include depreciation of $0.6 and $1.7, respectively, recognized in cost of goods sold, amortization of deferred financing costs of $0.1 and $0.2, respectively, and amortization of capitalized cloud software of $0.0
recognized in selling, general and administrative expenses.
2. Adjusted EBITDA is defined by the Company as earnings (loss), excluding one-time items, before interest, taxes, depreciation and amortization. The Company believes that Adjusted EBITDA is a meaningful measure
of operating profitability and useful for measuring returns on capital investments over time as it is not distorted by unusual gains, losses, or other items.
15Q3 FY21 Balance Sheet Items and Cash Flow
In $ Millions Feb 28, 2021 Feb 29, 2020
1
Free cash flow (use) (3 month period ending) $5.5 $4.9
1
Free cash flow (use) (9 month period ending) $1.5 ($25.9)
Accounts receivable, net $238.0 $281.2
Inventories, net $304.8 $307.7
Accounts payable $134.3 $187.9
Accrued royalties $77.6 $77.3
Total debt $190.7 $16.1
Cash and cash equivalents $353.2 $263.8
2
Net debt (cash) ($162.5) ($247.7)
1. Free cash flow (use) is defined by the Company as net cash provided by or used in operating activities (which includes royalty advances) and cash acquired through acquisitions and from sale of assets, reduced
by spending on property, plant and equipment and prepublication costs. The Company believes that this non-GAAP financial measure is useful to investors as an indicator of cash flow available for debt repayment
and other investing activities, such as acquisitions. The Company utilizes free cash flow as a further indicator of operating performance and for planning investing activities.
2. Net debt (cash) is defined by the Company as lines of credit and short-term debt plus long-term-debt, net of cash and cash equivalents. The Company utilizes this non-GAAP financial measure, and believes it is
useful to investors, as an indicator of the Company’s effective leverage and financing needs.
16Q3 FY21 Revenues
In $ Millions
Three Months Ended Nine Months Ended
2/28/2021 2/29/2020 Change 2/28/2021 2/29/2020 Change
Book Clubs $35.0 $43.4 ($8.4) (19%) $107.7 $137.3 ($29.6) (27%)
Book Fairs 27.0 100.1 (73.1) (73%) 87.9 351.7 ($263.8) nm
Consolidated Trade 79.3 76.7 2.6 3% 276.9 254.4 $22.5 8%
Total Children's Book Publishing and Distribution 141.3 220.2 (78.9) (36%) 472.5 743.4 ($270.9) (57%)
Education 66.3 74.3 (8.0) (11%) 187.4 192.6 ($5.2) (3%)
International 69.9 78.8 (8.9) (11%) 239.0 267.1 ($28.1) (12%)
Total Revenues $277.5 $373.3 ($95.8) (26%) $898.9 $1,203.1 ($304.2) (34%)
17Questions For any questions, please contact Scholastic Investor Relations: Investor_Relations@Scholastic.com 18
You can also read