Isolation of five carotenoid compounds from tangerine tomatoes
←
→
Page content transcription
If your browser does not render page correctly, please read the page content below
Isolation of five carotenoid compounds
         from tangerine tomatoes

                                   Thesis

                               Thomas Haufe

                     Advisor: Steven J. Schwartz, Ph.D

                Department of Food Science and Technology

Presented in fulfillment of the requirements for the Research with Distinction
 program in the College of Food, Agricultural and Environmental Sciences at
                           The Ohio State University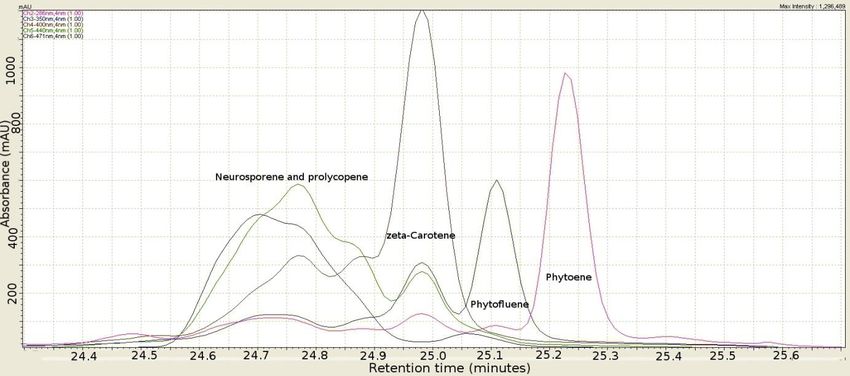
Table of Contents
    I.     Abstract
   II.     Introduction
 III.      Methods
  IV.      Results
   V.      Discussion
  VI.      Acknowledgements
 VII.      References
VIII.      Supplementary materials

 Haufe 2
I. Abstract
Tomatoes are widely consumed in the American diet, and epidemiological data
suggest health benefits from consumption. It is hypothesized that these observed health
benefits may be caused by carotenoids, a class of pigments widely found in fruits and
vegetables. Well-known carotenoids include beta-carotene and lycopene. The tangerine
tomato is an orange colored tomato; its color difference can be attributed to a different
carotenoid profile compared to red tomatoes. Some carotenoids present in tangerine
tomatoes are suggested to be more bioavailable. The goal of this project was to isolate and
purify five carotenoids from tangerine tomatoes to use as authentic standards, as these
compounds are not readily available for purchase so they must be prepared in the lab
immediately before use. To be able to assess bioavailability or bioefficacy, these
carotenoids must be quantified in animal and/or human blood and tissues after ingestion
of tangerine tomatoes. Authentic standards of each compound must be available in order
to determine the amount present in the biological samples. Phytoene, phytofluene, zeta-
carotene, neurosporene, and tetra-cis lycopene (also known as prolycopene) were
extracted from tangerine tomatoes using nonpolar solvents. These compounds were
separated and fractionated using preparative high performance liquid chromatography
with photodiode array detection (HPLC-PDA). The purity of these fractions was then
assessed using analytical HPLC-PDA. These five purified carotenoid standards were used
to prepare calibration curves for assessing bioavailability differences between red and
tangerine tomatoes in humans. Additionally, these standards will be used to quantify
carotenoids in serum and tissues from other pre-clinical and clinical studies involving red
Haufe 3and tangerine tomato diets. Isolating these carotenoid compounds is essential step in
continuing this research on the effects of tangerine tomato consumption on health.
II. Introduction
i. Objective
The main objective of this research is to isolate five carotenoid compounds from
tangerine tomatoes using preparative high performance liquid chromatography (HPLC).
These compounds need to be isolated so that they can be used as analytical standards for
other studies being completed in the Schwartz lab.
ii. Previous studies
Previous studies that relate to this work include chromatographic methods used to
separate carotenoids from tomatoes and biological samples. These studies were the basis
of the methods used in this research but they were highly modified in order to obtain the
desired results. The background research involved in this project included learning about
HPLC theory and training on the equipment. See the methods section for details on the
chromatographic methods used.
iii. Background
High performance liquid chromatography is a laboratory technique used to separate
compounds in a sample. Separation is achieved by passing the sample through a column in
which some analytes interact more strongly with the column than others; thus these
Haufe 4analytes have different “retention times” or amount of time before they pass through the
column. The column used in HPLC can separate compounds from a sample based on
structure, hydrophobicity, ionic charge, ligand affinity, or other means. This research used
C30 and C18 columns which interact with analytes based on hydrophobicity. HPLC has an
advantage to traditional column chromatography because the system is under high
pressure which allows columns to be tightly packed with narrow diameters. This allows
for separation of compounds very similar in structure and polarity (such as the target
compounds in this research).
After separation in the column the compounds are analyzed using a detector which
varies based on the application. A common detector used in conjunction with HPLC is
photodiode array detector (PDA) which emits light in the ultraviolet through the visible
range (roughly 200-700 nm). This light passes through the analytes as they exit the column
and the absorbances of the analytes is shown on a computer attached to the machine.
Carotenoids are colored compounds which are found in a multitude of fruits and
vegetables. Individual carotenoids can be distinguished based on their absorbance spectra
as they absorb light in the UV-vis range.
iv. Problem identification and justification
The following five compounds need to be separated using preparative high
performance liquid chromatography: tetra-cis lycopene, neurosporene, zeta-carotene,
phytoene, and phytofluene. These compounds are very similar in structure and polarity
which makes them difficult to separate and isolate. Much of the work that was done during
the course of this research was modifying HPLC methods in order to actually achieve
Haufe 5separation between the compounds. The similar polarity and structure made this
separation difficult, especially considering that this was done on the preparative scale
versus the analytical scale. The difference between analytical and preparative is that the
purpose of analytical HPLC is to identify and quantify the target analyte(s); whereas the
purpose of preparative HPLC is to isolate and purify the target analyte(s) for further use.
Analytical HPLC columns have a much smaller column width than preparative columns,
and this facilitates better analyte separation and resolution.
These compounds must be isolated in our lab because they are unavailable for
purchase from chemical suppliers. Some are unavailable because they would degrade
during shipping and processing and/or are extremely expensive, while others are simply
not sold by chemical suppliers.
The justification for isolating these compounds is because they are needed for use as
analytical standards. Analytical standards are pure compounds which are used in HPLC-
PDA and HPLC-MS in order to quantify these compounds in biological samples. Specifically,
a Ph.D candidate in our lab was doing a mouse study involving consumption of tangerine
tomatoes and skin cancer. After the mice are sacrificed, this researcher will quantify levels
of these five compounds in the mice tissue samples. In order to quantify these compounds
with HPLC-PDA/MS, the researcher needs to first run the analytical standards and create a
calibration curve. The reason for quantifying these analytes in biological samples is to
examine any possible correlation between the levels of carotenoids in mouse tissue versus
the incidence of tumor growth or other biomarkers of intensive skin damage.
Haufe 6III. Methods
i. Tangerine tomato cultivation
The tangerine tomatoes used for this research was grown at the tomato breeding and
genetics lab by Dr. David Francis at Ohio Agricultural Research and Development Center
(OARDC). A portion of these tomatoes were processed into juice using a hot break process;
this juice was then dried into a powder and stored at -20° C until needed.
ii. Carotenoid extraction
A nonpolar solvent extraction method was used to selectively extract the carotenoid
compounds from dried tangerine tomato powder; this is an unpublished method used in
the Schwartz lab. About 0.5 grams of tangerine tomato powder were crushed and ground
into powder, then 5 mL methanol was added to the powder and vortexed. This mixture is
sonicated for 9 seconds then centrifuged at 5,000 RPM for 5 minutes. Next 5 mL of 1:1
acetone:hexane are added to the solution, vortexed, sonicated and centrifuged. The top
hexane layer is pipetted off; this layer will be orange/yellow as it contains the carotenoid
compounds. The carotenoid containing hexane solution is dried down under nitrogen gas.
This extract is then used in the HPLC methods below.
iii. HPLC methodology
There were two different HPLC methods used during this research: a C18
preparative method (adopted and heavily modified from the Isaacson1 et al method) and a
C30 preparative method (adopted and modified from the C30 method used in the Schwartz
lab2). These methods were initially intended for use on the analytical scale thus they had to
Haufe 7be modified for use on the preparative scale. The injection volume for the preparative scale
was determined using the following equation:
Where D is the inner diameter of each column (mm) and L is the length of the
column (mm) and Volanalytical is the injection volume on the analytical scale. Using this
equation resulted in a preparative injection volume of 100 µL. Next the flow rate for the
preparative scale was calculated using the equation:
Using this equation resulted in an analytical flow rate of 22 mL/minute, which was
not possible with the equipment used in the research. So a lower flow rate of 15 mL/min
was used for both methods.
The analytical methods did not translate well to the preparative column thus the
solvent flow gradient had to be significantly modified as well. See Table 1 for the final C18
method after modification and optimization. After injection and separation, the eluate was
collected manually by attaching a 6 inch section of HPLC tubing to the “out” port of the PDA
and collecting in glass vials by hand.
A Sunfire Preparative C18 column (19 x 150 mm) was used for the C18 methods and
a YMC Preparative C30 column (19 x 200 mm) was used for the C18 methods.
Haufe 8IV. Results and discussion
All five compounds were successfully isolated to an acceptable level for use as
analytical standards. These isolated compounds were used to create calibration curves for
each respective compounds for continued research in our lab. The isolation of these five
compounds was handled on a case-by-case basis. For example: phytoene could be isolated
to an acceptable purity after one injection with the C18 method (after extensive
optimization of the method). However tetra-cis lycopene and neurosporene were much
more difficult to separate from each other and from other trace cis-lycopene isomers.
These compounds had to be run through the HPLC column several times in order to reach
an acceptable purity level. After a sample was injected, the analytes were collected and run
through the column again until an acceptable purity was reached. Sometimes this required
use of both the C18 and the C30 column methods.
The methods found in literature had to be significantly modified in order to
successfully separate the analytes with the HPLC columns available. The resolution was
lower when using preparative C30 and C18 columns versus analytical C30 and C18
columns. Figure 1 shows the chromatogram obtained after injecting a tangerine tomato
extract after the initial method modifications. The retention times of the individual
compounds were far too close together to collect fractions containing isolated compounds.
After changing the solvent gradient and flow rate, the retention times between compounds
increased. The peaks obtained using this method were not sharp but they did allow for
collection of isolated compounds (Figure 2), which was the objective of the research.
Phytoene, phytofluene and zeta-carotene were collected using only the C18 method (see
Haufe 9Figure 2). See Figure 3 for a comparison of the absorbance spectra of these compounds
versus literature reference examples. As mentioned before, these compounds were purified
in order to be used as analytical standards to quantify them in biological samples. See
Figure 4 for the phytoene, phytofluene and zeta-carotene calibration curve.
V. Conclusions and future work
Phytoene, phytofluene, zeta-carotene, neurosporene, and tetra-cis lycopene were
successfully isolated from tangerine tomatoes using preparative high performance liquid
chromatography. This was completed using a mixture of C18 and C30 chromatographic
methods as needed for each compound. These compounds were used in our lab to create
calibration curves for quantification of the compounds in biological samples.
VI. Acknowledgements
I would like to thank my research advisor, Dr. Steven Schwartz, for allowing me to
work in his lab and gain invaluable experience along the way. Additionally, I would like to
thank Jessica Cooperstone who guided me along the research process and trained me in all
of the lab processes. All of the research done in this experiment used equipment and
supplies available in the Schwartz Lab. These supplies are funded by combination of
research grants and the Carl E. Haas endowment.
Haufe 10VII. Bibliography
1Isaacson T, et. Al. 2002. Cloning of tangerine from tomato reveals a carotenoid isomerase
essential for the production of beta-carotene and xanthophylls in plants. Plant Cell.
14(2):333-342
2FerruzziM, Schwartz S, et al. 1998. Carotenoid Determination in Biological Microsamples
Using Liquid Chromatography with a Coulometric Electrochemical Array Detector. Anal.
Biochem. 256:74-81.
3BrittonG, Liaaen-Jenson S, Pfander H. Carotenoids: Handbook. 2004; 1st edition.
Birkhauser, Basel, Switzerland.
VIII. Supplementary material
Table 1. Modified C18 preparative HPLC method used to separate carotenoids in tangerine
tomatoes. Solvent A: 90% acetonitrile, 8% H2O, 2% of 2% ammonium acetate solution
(aqueous). Solvent B: 100% ethyl acetate.
Time %A %B
0 65 35
13 50 50
20 45 55
22 0 100
22.01 65 35
26 65 35
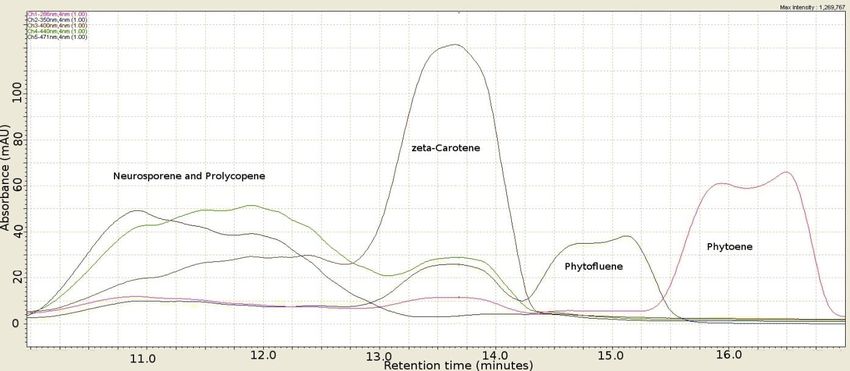
Haufe 11Figure 1. Chromatogram for C18 prep-HPLC run before modification. Note that all
carotenoids eluted in under 60 seconds; the compounds could not be isolated when
the retention times were so similar to each other
Figure 2. Chromatogram for C18 prep-HPLC run after method modification. Phytoene,
phytofluene and ζ-carotene have retention times which are more spread out thus they
could be effectively isolated by collecting the eluate off the column
Haufe 12Figure 3a Figure 3b Figure 3: Comparison of experimental spectra obtained after purification of phytoene, phytofluene and zeta-carotene. Figure 3a shows experimental spectra collected during the course of this research while Figure 3b shows reference spectra from a carotenoids reference handbook3 Haufe 13
Phytoene, Phytofluene and zeta-Carotene
                                         Standard Curves
                  2500
                                  y = 3.743E+13x - 1.056E+00
                  2000                   R² = 1.000E+00
  Peak area PDA

                  1500
                                                                y = 2.5556E+13x + 1.4777E-01          Phytoene
                  1000
                                                                       R² = 1.0000E+00                Phytofluene
                                                                         y = 1.192E+13x + 2.427E+00
                  500
                                                                                R² = 9.992E-01        Zeta-carotene
                     0
                         0      2E-11        4E-11             6E-11         8E-11         1E-10
                                                Moles injected

Figure 4. Calibration curves created from three of the five compounds isolated during this research
(phytoene, phytofluene and zeta-carotene)

Haufe 14
You can also read