Variations of the IMF through environment

Page created by Amanda Mcdonald
 
CONTINUE READING
Variations of the IMF through environment
Poster P14
        Variations of the IMF through environment
        • Investigate the emergence of the IMF using high-resolution models of
          a piece of a molecular cloud
        • Test predictions from turbulent fragmentation

    • Only cores with high
      density unstable                                                       • All cores unstable
                             # Stars

    • Turnover connected                                                     • IMF follows CMF
      to distribution of                                                     • Powerlaw from
      dense gas                                                                turbulence
                                       Peak set by mass of
                                       Bonnor-Ebert core
                                       with confinement by
                                       turbulent pressure

Troels Haugbølle – EPOS 2018                            Mass   Haugbølle, Padoan, Nordlund (2018)
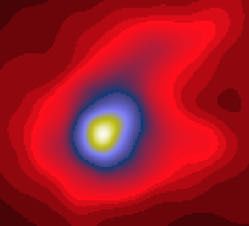
Variations of the IMF through environment
Numerical model
• RAMSES with essential ingredients
           Turbulence         Gravity        Magnetic Fields
• Resolution: 4 parsec à 50 AU. Extensive convergence study.
• Four models to probe different environments: Mbox=1500-12000 Msun
Variations of the IMF through environment
Numerical model
• Use RAMSES. Simplest possible model
           Turbulence         Gravity         Magnetic Fields
• Resolution: 4 parsec to 50 AU. Extensive convergence study
• Four different models to probe different densities
Variations of the IMF through environment
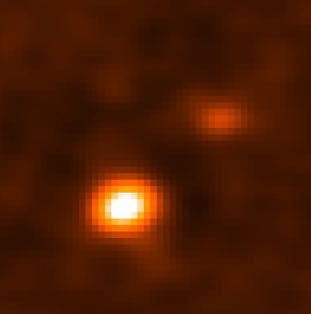
The virial number is the ratio of the kineti
Virial parameter
           binding regulates
                   energy. For evolution
                               a uniform sphere it is given
                                     These results were confirmed and exten      2
                                                           2E
                                 parameter study by Federrath                5
                                                                kin and Klessen  1D
                                            ↵vir grid
                                 on 34 uniform
                                                     = simulations=     with the Fla
                                 a resolution of up to 512
                                                           E  grav
                                                                3              GM
                                                                   computational p
                                 AMR run with maximum resolution equiva
           where                 computational points). Six of their runs
                                         SFRff ≈ ½ exp(-1.38 ⍺vir ½) incl
                                 field, covering the range 1.3  MA  13, b
                                 proximately the same sonic Mach number,
                                 the 3     2of =dependence
                                         ⍺vir
                                      lack       0.21, 0.42,       0.83,
                                                              of SFR   ↵ on 1.67
                                                                              Ms fo
                          Ekin = et al.    1D   M
                                        (2012) could not be verified. On the
                                                                                   E
                                     2
                                 28 runs without magnetic fields span a wide
                                 of sonic Mach number, 2.9  Ms  52,
           Given a density profile   ⇢(r),
                                 Federrath      a projection
                                              and  Klessen
                                         Padoan+2011,        (2012) to factor
                                                        Padoan+2012,      confirm thei
                                 numerical
           the change in the gravitational     result ofbinding
                                         Federrath+2012.  Padoan    andenergy
                                                          See also Poster Nordlund
                                                                          P7
                                 the non-magnetized case SFR↵ increases w
1/2 grid, light, high, 1/2
 for the run high. Furthermore,                             3/23Proot
                                                           G256  0
                                                                          (1 + Ms ) heavy andMmassive
                                                                                               s
                                                           The IMFs are all sampled at SFE= 0.024, co
  shed that the value of mpeak in
                                         which is a Variation
                                                       goodof 2.07, of  IMF
                                                                    0.83,
                                                              approximation    with
                                                                           0.46,  andtoenvironment
                                                                                        0.23
                                                                                         theMyr,     respectivel
                                                                                                turnover    mas
   fully converged (see Fig. 5), it is
                                         the turbulent of     the first star. Except for the top one, the h
                                                            fragmentation        models mentioned ab
alue of mpeak in the run massive         providing
                                                           vertically by a factor of 1/4 (heavy), 1/16 (h
                                                      anPredicted
                                                          intuitive     explanation        of the     origin  of
                                                           The dotted
                                         Figure 10.Assumption:      IMF  lines
                                                                           peak areaccording
                                                                                     lognormal  tofits between
                                                                                                    equation  (6
 as the total mass in this run is        IMF    peak.
                                         sus cloud  mass,To   test
                                                           where
                                                          for
                                                                     cores
                                                                     the
                                                                   the
                                                               Outer    IMF
                                                                       Galaxy
                                                                             are
                                                                           validityconfined
                                                                               appears
                                                                                 Survey
                                                                                                by
                                                                                        oftoclouds
                                                                                             this  prediction
                                                                                              be complete    and
                                                                                                    from Heyer
 aller than in the run high. The         express
                                         (1998) and  turbulent
                                                   the  IMF
                                                      the  m     pressure
                                                                  . The
                                                               peak
                                                           Galactic
                                                             peak     as IMF
                                                                      Ring       peak clouds
                                                                              Survey    clearly from
                                                                                                 shiftsRoman-
                                                                                                         toward
    of numerical convergence with                          mean
                                         et al. (2010), more      densitythan
                                                               massive      increases.
                                                                                 103 M (see main text fo
   could then explain the observed                         of Mm
                                         tails about the cloud     peak ⌘ ✏BE
                                                                 selection).   TheM  error   , give the mea
                                                                                       BE,tbars
                                                                  BE , we get a modified turbulent B
 iction of equation 6. mpeak             standard deviation of mpeak in six logarithmic bins of Mcl .
                                         where ✏BE is a local efficiency      1.182parameter
                                                                                         4            analogou
ms velocity assuming a tempera-          ✏star-forming
                                                in the   sink  particle     accretion    th model, M      BE,0
                                                                                                        and   use
 tem size (or total mass) based on         acc                  M
                                                           regions.BE,t   ⇡
                                                                      We can3/2   express     =
                                                                                        1/2 mpeak as a 2fun      1/
                                         simulations     to  verify   whether
                                          of the nondimensional parameters    G      P
                                                                                    it  provides (1  +a  M
                                                                                                         good
                                                                                       0 of the simulation  s  )  fi
  ity-size relation (see § 3). If we     the    total This
                                          the numerical
                                                      mass:gives
                                                            IMFs.
observed Larson velocity–size re-           For this purpose, is
                                                            which    wea use
                                                                           goodthe  approximation
                                                                                        four simulations   to thel
ocity and the size (or total mass)       high, heavy, and  mthe   turbulent
                                                                   ⇡
                                                                massive
                                                             peak      1.124   M
                                                                            with fragmentation
                                                                                     a
                                                                                   tot Mroot
                                                                                           s
                                                                                              4 3/2 models
                                                                                                ↵
                                                                                                grid
                                                                                                  vir ,of  256  3
escaled, as long as the nondimen-        and six AMR levels, with four di↵erent values of theofv
                                                            providing     an   intuitive      explanation
e simulation, Ms and ↵vir , were          which shows
                                         parameter         that
                                                        (seeIMF  for
                                                             Table    constant
                                                                   peak.
                                                                      1).2 The      ↵vir and
                                                                              To test
                                                                                    virial the   for standard
                                                                                                 validity
                                                                                             parameter       of va
                                                                                                             is   t
                                                                                                1/2
   may suspect that the predicted               relations,  express
                                                             M tot  /  the
                                                                        L   IMF
                                                                             and    peak
                                                                                      v   /
                                         by leaving the rms velocity constant and, increasin
                                          son                                                as
                                                                                              L       mpeak is
with the numerical IMFs only for          stant. However,
                                         decreasing            observed
                                                        the mean     density MCs      havemass)
                                                                                 (total       a rangein   of valu
                                                                                                         the  com
                                                                                      mpeak ⌘ ✏BE MBE,t           ,
mperature or system size, but it          ↵
                                         tational
                                            vir  and  yield   Larson     relations     with    a
                                                    volume by a factor of two or four relative to  significant
 at this agreement is immune to           ter and with
                                         reference          exponents
                                                            where
                                                      run high   (see✏BE§ 3in  ageneral
                                                                           isand   local     di↵erent
                                                                                   Tableefficiency        from
                                                                                                           paramt
                                                                                             1). The overden
  lation. The virial parameter can        standard at
                                         threshold     values.
                                                            ✏acc Thus,
                                                          which   in the
                                                                  the  rootour
                                                                            sink
                                                                              gridIMF     model
                                                                                     particle
                                                                                     is refined    isshould
                                                                                                 accretion
                                                                                                      changed   pr
                                                                                                                mf
1/2 grid, light, high, 1/2
 for the run high. Furthermore,                                                                  3/23Proot
                                                                                                G256  0
                                                                                                               (1 + Ms ) heavy andMmassive
                                                                                                                                    s
                                                                                                The IMFs are all sampled at SFE= 0.024, co
  shed that the value of mpeak in
                                                                              which is a Variation
                                                                                            goodof 2.07, of  IMF
                                                                                                         0.83,
                                                                                                   approximation    with
                                                                                                                0.46,  andtoenvironment
                                                                                                                             0.23
                                                                                                                              theMyr,     respectivel
                                                                                                                                     turnover    mas
   fully converged (see Fig. 5), it is
                                                                              the turbulent of     the first star. Except for the top one, the h
                                                                                                 fragmentation        models mentioned ab
alue of mpeak in the run massive                                              providing
                                                                                                vertically by a factor of 1/4 (heavy), 1/16 (h
                                                                                           anPredicted
                                                                                               intuitive     explanation        of the     origin  of
                                                                                                The dotted
                                                                              Figure 10.Assumption:      IMF  lines
                                                                                                                peak areaccording
                                                                                                                          lognormal  tofits between
                                                                                                                                         equation  (6
 as the total mass in this run is                                             IMF    peak.
                                                                              sus cloud  mass,To   test
                                                                                                where
                                                                                               for
                                                                                                          cores
                                                                                                          the
                                                                                                        the
                                                                                                    Outer    IMF
                                                                                                            Galaxy
                                                                                                                  are
                                                                                                                validityconfined
                                                                                                                    appears
                                                                                                                      Survey
                                                                                                                                     by
                                                                                                                             oftoclouds
                                                                                                                                  this  prediction
                                                                                                                                   be complete    and
                                                                                                                                         from Heyer
 aller than in the run high. The                                              express
                                                                              (1998) and  turbulent
                                                                                        the  IMF
                                                                                           the  m     pressure
                                                                                                       . The
                                                                                                    peak
                                                                                                Galactic
                                                                                                  peak     as IMF
                                                                                                           Ring       peak clouds
                                                                                                                   Survey    clearly from
                                                                                                                                      shiftsRoman-
                                                                                                                                              toward
    of numerical convergence with                                                               mean
                                                                              et al. (2010), more      densitythan
                                                                                                    massive      increases.
                                                                                                                      103 M (see main text fo
   could then explain the observed                                                              of Mm
                                                                              tails about the cloud     peak ⌘ ✏BE
                                                                                                      selection).   TheM  error   , give the mea
                                                                                                                            BE,tbars
                                                                                                       BE , we get a modified turbulent B
 iction of equation 6.                                                        standard deviation of mpeak in six logarithmic bins of Mcl .
                                                                              where ✏BE is a local efficiency      1.182parameter
                                                                                                                              4            analogou
ms velocity assuming a tempera-                                               ✏star-forming
                                                                                     in the   sink  particle     accretion    th model, M      BE,0
                                                                                                                                             and   use
 tem size (or total mass) based on                                              acc                  M
                                                                                                regions.BE,t   ⇡
                                                                                                           We can3/2   express     =
                                                                                                                             1/2 mpeak as a 2fun      1/
                                                                              simulations     to  verify   whether
                                                                               of the nondimensional parameters    G      P
                                                                                                                         it  provides (1  +a  M
                                                                                                                                              good
                                                                                                                            0 of the simulation  s  )  fi
  ity-size relation (see § 3). If we
     Figure 9. Values of the IMF peak, m             , from the lognormal     the    total This
                                                                               the numerical
                                                                                           mass:gives
                                                                                                 IMFs.
observed            Larson           velocity–size                 re-pa-        For this purpose, is
                                                                                                 which    wea use
                                                                                                                goodthe  approximation          to thel
                                                peak
     fits of the previous figure, plotted  as a function of the virial
     rameter of each simulation (a proxy for the inverse of the mean gas                                                     four simulations
ocitydensityand      thermssize
              at constant      velocity (or     total
                                        and size).          mass)
                                                    The filled circle shows
     the value predicted by equation 6 for the simulation high, assuming      high, heavy, and  mthe   turbulent
                                                                                                        ⇡
                                                                                                     massive
                                                                                                  peak      1.124   M
                                                                                                                 with fragmentation
                                                                                                                          a
                                                                                                                        tot Mroot
                                                                                                                                s
                                                                                                                                   4 3/2 models
                                                                                                                                     ↵
                                                                                                                                     grid
                                                                                                                                       vir ,of  256  3
escaled,                                                                      and six AMR levels, with four di↵erent values of theofv
                                                                                                 providing     an   intuitive      explanation
     an efficiencyas   long
                   factor ✏ BE     as inthe
                               = 0.64,     order nondimen-
                                                  to match exactly m  peak
     measured from the simulation. Assuming this fixed value of ✏ ,    BE

e simulation,                 Ms and
     three simulations. The measured     value for ↵
                                                   thevir   , wererun
     the open circles show the prediction of equation 6 for the other
                                                        highest-density
                                                                               which shows
                                                                              parameter         that
                                                                                             (seeIMF  for
                                                                                                  Table    constant
                                                                                                        peak.
                                                                                                           1).2 The      ↵vir and
                                                                                                                   To test
                                                                                                                         virial the   for standard
                                                                                                                                      validity
                                                                                                                                  parameter       of va
                                                                                                                                                  is   t
                                                                                                                                     1/2
     is larger than the prediction, possibly because of a decreasing nu-
   may
     merical suspect           that
              convergence of the  value of the
                                           m peak  aspredicted
                                                      this becomes smaller                       express
                                                                                                    tot  /  the  IMF     peak
                                                                                                                           v   /
                                                                              by leaving the rms velocity constant and, increasin
                                                                               son   relations,   M          L    and             as
                                                                                                                                   L       mpeak is
     with increasing mean density.
with the numerical IMFs only for                                               stant. However,
                                                                              decreasing            observed
                                                                                             the mean     density MCs      havemass)
                                                                                                                      (total       a rangein   of valu
                                                                                                                                              the  com
                                                                                                                           mpeak ⌘ ✏BE MBE,t           ,
mperature               or
     these four simulations    system
                                 are shown insize, Figure but
                                                            8, whereitthe
     histograms are shifted vertically by a factor of four be-
                                                                               ↵
                                                                              tational
                                                                                 vir  and  yield   Larson     relations     with    a
                                                                                         volume by a factor of two or four relative to  significant
 at tween
       this      agreement
              consecutive   runs, exceptis  for immune
                                                 the top histogram,  to  to    ter and with
                                                                              reference          exponents
                                                                                                 where
                                                                                           run high   (see✏BE§ 3in  ageneral
                                                                                                                isand   local     di↵erent
                                                                                                                        Tableefficiency        from
                                                                                                                                                paramt
                                                                                                                                  1). The overden
     minimize the confusion of overlapping plots. The IMFs
  lation.         Theatvirial
     are all sampled         SFE= 0.024, parameter
                                             corresponding tocan    a time     standard at
                                                                              threshold     values.
                                                                                                 ✏acc Thus,
                                                                                               which   in the
                                                                                                       the  rootour
                                                                                                                 sink
                                                                                                                   gridIMF     model
                                                                                                                          particle
                                                                                                                          is refined    isshould
                                                                                                                                      accretion
                                                                                                                                           changed   pr
                                                                                                                                                     mf
1/2 grid, light, high, 1/2
 for the run high. Furthermore,                                                                                3/23Proot
                                                                                                            G256      0
                                                                                                                                  (1 + Ms ) heavy andM              massive
                                                                                                                                                                       s
                                                                                                               The IMFs are all sampled at SFE= 0.024, co
  shed that the value of mpeak in
                                                                                      which is a Variationgood of 2.07,  of  IMF
                                                                                                                         0.83,
                                                                                                                   approximation      with
                                                                                                                                  0.46,   andtoenvironment
                                                                                                                                                 0.23
                                                                                                                                                  theMyr,       respectivel
                                                                                                                                                         turnover         mas
   fully converged (see Fig. 5), it is
                                                                                      the turbulent of            the first star. Except for the top one, the h
                                                                                                                fragmentation            models mentioned ab
alue of mpeak in the run massive                                                      providing
                                                                                                               vertically by a factor of 1/4 (heavy), 1/16 (h
                                                                                                         anPredicted
                                                                                                              intuitive      explanation            of the       origin      of
                                                                                       Figure        10.       The   dotted
                                                                                                                         IMF   lines
                                                                                                                                 peak   are  lognormal
                                                                                                                                          according       to fits between
                                                                                                                                                               equation       (6
 as the total mass in this run is                                                     IMF
                                                                                       sus cloud peak.  Assumption:
                                                                                                       mass,To    test
                                                                                                               where
                                                                                                              for  Outer
                                                                                                                          cores
                                                                                                                          the
                                                                                                                        the  IMF
                                                                                                                            Galaxy
                                                                                                                                    are
                                                                                                                                 validity confined
                                                                                                                                      appears
                                                                                                                                         Survey
                                                                                                                                                         by
                                                                                                                                                 oftoclouds
                                                                                                                                                      this    prediction
                                                                                                                                                        be complete
                                                                                                                                                               from Heyer   and
 aller than in the run high. The                                                      express
                                                                                       (1998) and       turbulent
                                                                                                      the  IMF
                                                                                                         the   m      pressure
                                                                                                                   peak
                                                                                                               Galactic
                                                                                                                  peak . Theas IMF
                                                                                                                           Ring          peak clouds
                                                                                                                                    Survey       clearly from
                                                                                                                                                            shiftsRoman-
                                                                                                                                                                     toward
    of numerical convergence with                                                      et al. (2010), more     mean    densitythan
                                                                                                                    massive       increases.
                                                                                                                                         103 M (see main text fo
   could then explain the observed                                                     tails about the cloud   of Mm    peak ⌘ ✏BE
                                                                                                                      selection).     TheM   error    , give the mea
                                                                                                                                               BE,tbars
                                                                                                                       BE , we get a modified turbulent B
 iction of equation 6.                                                                 standard deviation of mpeak in six logarithmic bins of Mcl .
                                                                                      where ✏BE is a local efficiency                1.182parameter
                                                                                                                                                 4               analogou
ms velocity assuming a tempera-                                                                11
                                                                                      ✏star-forming
                                                                                                in   the   sink    particle       accretion      th model, M        BE,0
                                                                                                                                                                  and     use
 tem       size (or total mass) based on                                                acc                         M
                                                                                                             regions.      We
                                                                                                                        BE,t   ⇡  can    express
                                                                                                                                               1/2
                                                                                                                                                      =m  peak    as   a  fun
                                                                                                                                                                          2   1/
 and size).                                                                           simulations          to    verify
                                                                                       of the nondimensional parameters    whether  G   3/2it
                                                                                                                                            P   provides   (1  +a
                                                                                                                                               0 of the simulation
                                                                                                                                                                   M
                                                                                                                                                                   good s   )  fi
  ity-size
  open    cir-       relation            (see       §   3).      If    we             the     numerical This gives
                                                                                                               IMFs.
  redFigure
       value 9. Values of the IMF peak, m , from the lognormal
observed
  responds             Larson           velocity–size
                                           peak
                                                                      re-pa-           the     total    mass:  which     is  a use
                                                                                                                                 goodthe   approximation              to thel
     fits of the previous
     rameter
 elated
                             figure, plotted  as a function of the virial
           lo- of each simulation (a proxy for the inverse of the mean gas                For       this  purpose,       we                     four     simulations
ocitydensityand
  accretion             the
                at constant  rmssize
                                  velocity (or     total
                                           and size).           mass)
                                                       The filled circle shows
                                                                                      high,        heavy,    m
                                                                                                            andthe    turbulent
                                                                                                                        ⇡
                                                                                                                    massive1.124      M
                                                                                                                                   with fragmentation
                                                                                                                                            a M root
                                                                                                                                                       4 3/2 models
                                                                                                                                                         ↵
                                                                                                                                                         grid   , of  256    3
     the value predicted by equation 6 for the simulation high, assuming                                         peak                     tot      s       vir
escaled,
     an efficiencyas
     measured     from
                         BElong
                      factor
                         the
                             ✏        as
                                  = 0.64,
                             simulation.
                                            the
                                           in order nondimen-
                                          Assuming
                                                     to match exactly m
                                                      this
                                                               peak
                                                           fixed value  of ✏   ,      and     six    AMR       providing
                                                                                                             levels,    with    an
                                                                                                                                four  intuitive
                                                                                                                                         di↵erent      explanation
                                                                                                                                                        values     of   the  ofv
        with                                                    BE

epeak
    simulation,                  Ms and     value for ↵        , wererun
     the open circles show the prediction of equation 6 for the other                  which shows           that
                                                                                                               IMF   for  constant
                                                                                                                        peak.       To     ↵vir and
                                                                                                                                           test    the    for standard
                                                                                                                                                          validity       of va t
  with
     three
  crepancy
          thesimulations. The measured                thevir
                                                           highest-density
     is larger than the prediction, possibly because of a decreasing nu-
   may
     merical suspect              that
                                     value of the     aspredicted
                                                                                      parameter
                                                                                       son     relations,
                                                                                                          (see
                                                                                                        Notice   Table
                                                                                                                  that /
                                                                                                               express
                                                                                                                M  tot
                                                                                                                           1).
                                                                                                                        Mthe
                                                                                                                           tot
                                                                                                                            L  MIMF
                                                                                                                               2  The
                                                                                                                                   and
                                                                                                                                           virial
                                                                                                                                    s ≈ constant
                                                                                                                                     -4
                                                                                                                                            peak
                                                                                                                                              v   /
                                                                                                                                                      parameter
                                                                                                                                                      as
                                                                                                                                                      L   if on
                                                                                                                                                         1/2
                                                                                                                                                              , increasin
                                                                                                                                                                 mpeak is
                                                                                                                                                                         is
 cant,   it  is convergence of the
     with increasing mean density.
                                         peak m          this becomes smaller         by     leaving      the    rms    velocity
                                                                                                        Larson relations.               constant        and
with
  certaintythe numerical IMFs only for                                                 stant.
                                                                                      decreasing     However,
                                                                                                          the      observed
                                                                                                                mean     density   MCs       havemass)
                                                                                                                                        (total         a range in   of valu
                                                                                                                                                                   the     com
  hermore,                                                                                                                                    mpeak ⌘ ✏BE MBE,t                ,
mperature
     these
  mpeak     in
              four
     histograms
                            or system size, but it
                     simulations    are  shown    in  Figure   8,  where
                       are shifted vertically by a factor of four be-
                                                                            the        ↵
                                                                                      tational
                                                                                         vir     and    yield    Larson      relations         with
                                                                                                       volume by a factor of two or four relative to     a  significant
 at
 g. 5),this
         it
     tween
 n massive
             is    agreement
               consecutive     runs, exceptis  for immune
                                                    the top histogram,  to   to        ter and with
                                                                                      reference         run    exponents
                                                                                                               where
                                                                                                             high    (see✏BE§  3 in
                                                                                                                                 isandageneral
                                                                                                                                          local
                                                                                                                                          Table      di↵erent
                                                                                                                                                    efficiency
                                                                                                                                                      1).   The      from
                                                                                                                                                                     paramt
                                                                                                                                                                   overden
     minimize the confusion of overlapping plots. The IMFs
  lation.
 his run all
     are            The
             is sampled     atvirial
                       Figure   SFE=        parameter
                                 10. Predicted
                                        0.024,                     tocan
                                                   IMF peak according
                                                corresponding          a time          standard
                                                                             to equation
                       sus cloud mass, for Outer Galaxy Survey clouds from Heyer
                                                                                         (6) ver-
                                                                                      threshold
                                                                                            et al.
                                                                                                         values.
                                                                                                        at     ✏acc Thus,
                                                                                                            which     in the
                                                                                                                      the  root  our
                                                                                                                                   sink
                                                                                                                                    grid IMF      model
                                                                                                                                            particle
                                                                                                                                            is refined      isshould
                                                                                                                                                           accretion
                                                                                                                                                                changed      pr
                                                                                                                                                                             mf
Time Evolution of IMF and Growth of Stellar Mass                                                                                           13                                                                   A

                                                                                                                                                                            1 pc

                                                                                                                                                                                              F1

                                                                                                                                                                                               F2

                                                                                                                                                                     F6                  F3

                                                                                                                                                                             F5
                                                                                                                                                                    a                  F4                          b

                                                                        12                                              Haugbølle, Padoan, Nordlund
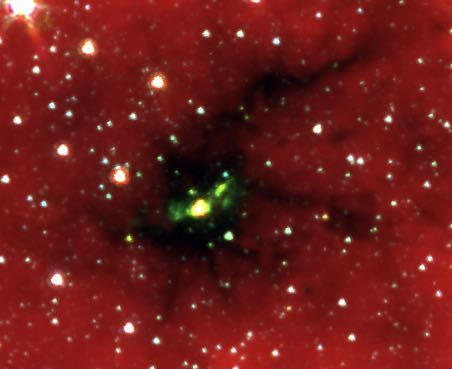
                                                                                                                                                                                       Perrotto+ 2013
                                                             surveys, the mean and standard deviations are mpeak =                                      Fig. 1. a) Mid-infrared Spitzer composite image (red: 8 µm
     It takes time for a star to form:                       0.6 ±Figure
Figure 12. Time evolution of the mass distribution of sink par-     0.25 M 13. andTime
                                                                                     mpeak    = 0.26 ±
                                                                                           evolution    of 0.09   M parameters
                                                                                                            the IMF      for the outer derived from     indicated with yellow dashed lines, emphasizing their conver
ticles in the reference simulation high. The time of each IMFand inner
                                                                   the fitsGalaxy
                                                                            shown respectively,
                                                                                      in the previous   with    over The
                                                                                                            figure.     90%IMF of these
                                                                                                                                   peak is already
                                                                                                                                                        centre is usually interpreted as a signature of powerful outflow
     • Massive stars do not form through massive cores
since the formation of the first sink particle is given next to each
histogram. The histograms are shifted vertically by an arbitrary
                                                                   established
                                                             star-forming
                                                                   particles,
                                                             mpeak < 1.0 M .
                                                                                 after yielding
                                                                             clouds
                                                                               although
                                                                                        less then 1values
                                                                                           it is  a
                                                                                                       Myr from
                                                                                                     bit  larger
                                                                                                                    the range
                                                                                                               in the
                                                                                                                   around
                                                                                                                          creation
                                                                                                                             1.5
                                                                                                                                 0.1of <
                                                                                                                                 Myr
                                                                                                                                       the first sink
                                                                                                                                        (top panel).    column density image of SDC335. The locations of the filam
value, except for the case of 0.03 Myr that shows the actual num-
                                                               ThisThe power-law tail at large masses takes approximately 2 Myr to
                                                                      scatter   in the10peak                                                            of this image is 2500 (yellow circle), that of Herschel at 350
                                                                                            M of  andthe    stellara IMF
                                                                                                                      stablepredicted
     • Massive stars are not due to competitive accretion
ber of stars in each mass bin. The dotted lines are log-normal
fits between the smallest mass bin where the IMF appears to be
                                                                   develop
                                                             for di↵erent
                                                                            beyond
                                                                            MCs    is  the  consequence
                                                                                                        achieve
                                                                   with Salpeter’s value (bottom panel). The   of the
                                                                                                                              slope, , consistent
                                                                                                                        scatter  in thebuild up of
                                                                                                                           progressive
                                                                                                                                                        2 ⇥ 1022 cm 2 , and from 2.15 ⇥ 1023 to 4.15 ⇥ 1023 cm 2 in
                                                                                                                                                        calculated the SDC335 and Centre region masses quoted in T
                                                             velocity-size
complete (based on a sharp cuto↵ at lower masses, more apparent             and   mass-size     relations,
                                                                   the tail and the decreasing value of        or, equivalently,
                                                                                                                      are reflectedthe by a gradual
                                                                                                                                                        where two cores are identified, MM1 and MM2. The rms no
     Rather we find that matter is fall in through inertial flows and there is
                                                             scatter
in histograms with narrower bins and corresponding to late times)
and 2 M . The solid lines are power-law fits above 2 M .
                                                                      in the in
                                                                   increase   relation
                                                                                 the width
                                                                   (middle panel).
                                                             (see Figures
                                                                                          between
                                                                                               of thevirial
                                                                                                        IMF,parameter
                                                                                                                  m , during
                                                                             31, 33, 34 and 35 in Padoan et al. (2016b)
                                                                                                                             and
                                                                                                                               themass
                                                                                                                                    initial 1.7 Myr
                                                                                                                                                        from 22 to 62 in steps of 10 mJy/beam. The yellow ellipse rep
     a maximum accretion rate that can be sustained – see poster P30 and
                                                             and Figures 5, 6 and 7 in Padoan et al. (2016a)). We have
rest of the mass has to be accreted through a circum- recently     cles,shown
                                                                          such that
                                                                                  as insupernova
                                                                                           the work(SN)    by Padoan         et al. (2014b). In
                                                                                                                 driven turbulence
     talk by Padoan
stellar disk fed by the same converging flows that had generates   Padoan MCsetwithal. (2014b),
                                                                                         propertiesusing         a simulation
                                                                                                         consistent     with the ob- with almost        witnessing the early stages of the formation of, at least, t
                                                                                                                                                        sive stars.
assembled the prestellar core. In other words, the stel- servationsidentical    physical
                                                                          (Padoan     et al.and    numerical
                                                                                              2016b;     Pan et al. parameters
                                                                                                                       2016; Padoan as the model
     Consequence: the IMF only emerges after ≈1.5 – 2 Myr
lar mass predicted by the PN02 model should be seen et al.high
as the total mass available to form a star, while the ac-    tween
                                                                    2016a).
                                                                     MCs
                                                                               Because
                                                                          in this
                                                                           selected
                                                                                    work,ofwe
                                                                                       from
                                                                                               this
                                                                                              our
                                                                                                      successful
                                                                                                   obtained
                                                                                                    simulation
                                                                                                                     comparison
                                                                                                                  nearly
                                                                                                                   and
                                                                                                                            1300 sink
                                                                                                                          the
                                                                   over a time of 3.2 Myr, with a mass function closely fol-
                                                                                                                                     be- particles
                                                                                                                              observa-
                                                                                                                                                            The goal of this paper is to map the dense gas kinem
                                                                                                                                                        SDC335 and analyse it in the context of massive star f
tual mass of a prestellar core (prior to its collapse into a tions,lowing
                                                                     we can ause   the simulation
                                                                                Chabrier       IMF at   to small
                                                                                                            infer that     most and
                                                                                                                      masses     of thea Salpeter
Discussion points
• We find numerical evidence that the IMF is not universal, but
  depends on environment.

• The environmental dependence of the peak can be understood
  in the framework of turbulent fragmentation à there is a
  “simple” connection between cores and low-mass stars?

• Can we observe the time-dependence of the IMF; what does it
  tell us about accretion time-scales?

• Extreme star formation regions may be an interesting window
  to test our theories for the IMF. But important locally driven
  feedback (radiation, outflow) may limit applicability.
Numerical Convergence
               • Non-trivial to reach convergence – high resolution needed
               • In addition, multiple systems will show up with increasing resolution
               • Convergence debated! Guszejnov+ 2018, Lee & Hennebelle 2018a,b, suggest
                 continous fragmentation, BUT only include HD
               • B-field regulating small fragments by ”non-thermal” pressure floor?

      0.14

      0.12

      0.10

      0.08                                       16
SFE

                                                 32
      0.06
                                                 low
      0.04                                       med
                                                 high
      0.02
                                                 fit
      0.00
         0.0        0.5     1.0            1.5   2.0
                            time [ tff ]

      0.14

      0.12
You can also read