A Novel Approach for Semiconductor Etching Process with Inductive Biases
←
→
Page content transcription
If your browser does not render page correctly, please read the page content below
A Novel Approach for Semiconductor Etching Process
                                                        with Inductive Biases

                                                            Sanghoon Myung∗                          Hyunjae Jang             Byungseon Choi
                                              Data and Information Technology (DIT) Center            DIT Center                DIT Center
                                                           Samsung Electronics                     Samsung Electronics       Samsung Electronics
arXiv:2104.02468v1 [stat.ML] 6 Apr 2021

                                                       Jisu Ryu                      Hyuk Kim                          Sang Wuk Park
                                                      DIT Center              Semiconductor R&D Center            Semiconductor R&D Center
                                                   Samsung Electronics           Samsung Electronics                 Samsung Electronics

                                                                  Changwook Jeong†                            Dae Sin Kim
                                                                     DIT center                                DIT Center
                                                                 Samsung Electronics                       Samsung Electronics

                                                                                          Abstract

                                                       The etching process is one of the most important processes in semiconductor man-
                                                       ufacturing. We have introduced the state-of-the-art deep learning model to predict
                                                       the etching profiles. However, the significant problems violating physics have
                                                       been found through various techniques such as explainable artificial intelligence
                                                       and representation of prediction uncertainty. To address this problem, this paper
                                                       presents a novel approach to apply the inductive biases for etching process. We
                                                       demonstrate that our approach fits the measurement faster than physical simulator
                                                       while following the physical behavior. Our approach would bring a new opportunity
                                                       for better etching process with higher accuracy and lower cost.

                                          1        Introduction
                                          Artificial intelligence (AI) has undergone a renaissance recently, and it exceeds human performance
                                          based on a number of data and its low cost in various domains such as vision and language. These
                                          success stories have lured various big data companies in the manufacturing industry (e.g. semicon-
                                          ductor) to attempt to introduce the deep learning model. Nevertheless, it is still hard to find such
                                          stories in the real world. One of the major reasons is that in the test phase, the data distribution
                                          is often shifted. For instance, distributional shift is caused by high dispersion between production
                                          equipment in the manufacturing. In this case, the conventional deep learning model still does not
                                          reach human performance; it even predicts the absurd results. To tackle this problem, there are three
                                          approaches. First, prediction uncertainty is investigated by previous works[1, 2]. It is crucial that the
                                          model can represent whether the results are trustworthy or not, which also helps the decision making.
                                          The second approach is explainable AI (xAI) to interpret how the model makes the decision[3, 4,
                                          7]. The most of previous works introduce the new interpretable model to explain the deep learning
                                          with proper assumptions or insert the interpretable layer (i.e. attention layer) in the neural network.
                                          When xAI results are well matched with the domain knowledge, this approach can give confidence to
                                          human. If not, even the wrong results can inspire humans to modify the model. The third approach is
                                          to apply the inductive biases, which helps the model predict outside of training-range data. The first
                                               ∗
                                                   Primary author, shoon.myung@samsung.com
                                               †
                                                   Corresponding autho, chris.jeong@samsung.com

                                          1st NeurIPS workshop on Interpretable Inductive Biases and Physically Structured Learning (2020), virtual.
and second methods are most preferred in terms of universality. These two methods help humans to
make decisions, however, they cannot improve accuracy level. The third method, inductive biases,
may improve accurate prediction, but it needs to be specifically designed for each problem. This
paper, with semiconductor etching process, investigates the problem of data shift based on xAI and
uncertainty. It also suggests a novel approach with proper inductive biases for etching process.
2 Methodology for Plasma Etching
We will briefly introduce the semiconductor dataset for etching. The most devices of semiconductor
enforce electrical isolation to prevent leakage currents. One of the ways to impose electrical isolation
is called the Deep Trench Isolation (DTI)[5]. It is essential to optimize the recipe to etch the DTI
shape we design. But there are a number of controllable parameters to develop etching process
in a heuristic and iterative manner. Hence, the engineers rely on the Technology Computer-aided
Design (TCAD) simulators to optimize the recipe with lower cost than experiment. However, TCAD
simulators require proper calibration of the model parameters to match the simulation results with the
measurements. In addition, TCAD approach may be inaccessible for some cases due to its extremely
long turn-around-time (TAT). At last, even if these problems are definitely resolved, it is difficult to
accurately design the DTI because the physical models cannot capture all the relevant features in
experiment. If deep learning can replace TCAD, the development costs can be significantly reduced
because of its faster speed to infer the result. To add more details, Section 2.1 briefly reviews the
background of semiconductor to understand the etching problem with TCAD simulation. Section 2.2
describes the baseline model to predict the DTI shape and defines the problem from interpretation
of the baseline model. Section 2.3 suggests the inductive biases to resolve the problem described in
Section 2.2.
2.1 TCAD simulation
TCAD simulation is performed using Synopsys Sentaurus 3D topography[6]. In order to predict
how deep the silicon is etched, TCAD simulation solves the complex phenomena based on physical
equations. Figure 1 (a) shows the etching recipe example of the inputs of the model to etch DTI,
whereas Figure 1 (b) describes that of the outputs measured by destroying inspection. Figure 1 (c)
illustrates the physical phenomena in which the neutrons and ions, separated by plasma gas, react. As
discussed above, TCAD simulators need lots of calibration parameters, thus they consume high TAT.
Another problem of TCAD simulation is that parameters are calibrated with equipment by equipment
due to equipment dispersion.
Figure 1: (a) Description of the input recipe of TCAD simulation (b) Description of the output (c) A
summary of physical effects on etching.
2.2 Baseline model and its interpretation
Since both inputs and outputs can deal with sequential data, we use the Transformer[7] model.
Categorical inputs, which are not available for TCAD simulation (e.g. equipment information, wafer
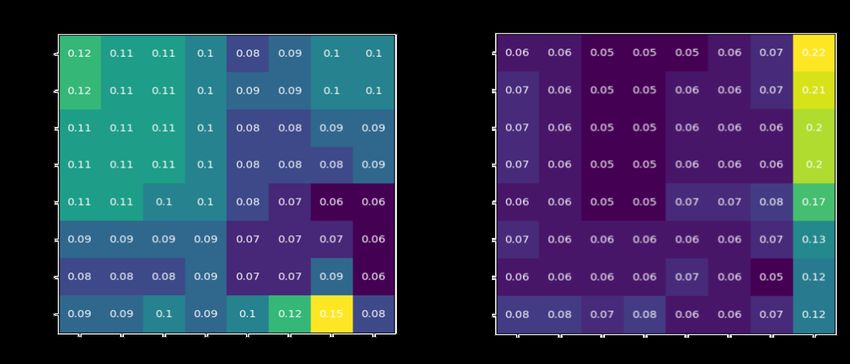
2Figure 2: The attention plots of model when Figure 3: The prediction results at the (a) first
etching (a) the top, (b) the bottom. (b) immediate (c) final step.
location), are also used as our model inputs. We design that the model generates the DTI profile
as input recipes and then, adapts its shape from categorical inputs. Finally, we introduce a deep
ensemble method based on Negative-log-likelihood (NLL) loss to measure the prediction uncertainty.
Now, we firstly inspect how proper our baseline model works. An attention map shows that all steps
have contributed to etch the top of DTI (Fig. 2 (a)). On the other hand, only last step has affected the
bottom of DTI (Fig. 2. (b)). These results are a good agreement with domain knowledge. Second,
we experiment how model etches the trench per each step. Interestingly, the model predicts that the
bottom is etched by the first step (Fig. 3 (a)) out of our expectation. This result is regarded as a
significant fault even considering the prediction uncertainty. The model also occurs additional errors
in which the trench is covered again even after being etched by the previous step.
2.3 Inductive biases for the etching model
Although the data distribution is shifted in the test phase, the problem described in Section 2.2
is caused by inference based on distribution of training samples. There are two main ideas to be
introduced based on the analysis in Section 2.2.
1) DTI is etched horizontally first, and then etched vertically as the step progresses. To simply
realize this phenomena, we hypothesize that the etched DTI profile per each step should follow
the exponential function such as Weibull distribution. The model generates k and λ in each
input recipe step and then predicts the DTI shape as the k and λ parameters pass through the
Weibull activation. One of the advantages of this assumption is that two parameters control the
DTI profile. Figure 4 (a) shows ideal results of etching profile based on the domain knowledge.
2) The silicon is always etched as steps advance. To implement this phenomena into
the baseline model, the output of the network is designed to forecast the amount of etching at
the moment of the step. The amount of the etched DTI is accumulated in the final step in order
to prevent the DTI from being covered. Figure 4 (b) depicts the DTI shape in each step.
Finally, we summarize the model architecture in Fig. 4 (c).
Figure 4: (a) The etching profile per each step. (b) The accumulated etching profile as the step
progresses. (c) Illustration of the model architecture.
33 Experimental Results and Discussion
To assess the effectiveness of our assumption, the prediction of our model should be compared with
the real DTI profile at each step; however, they are not available due to substantial cost in development
phase. Therefore, to validate the effectiveness, we experiment in two folds. We inspect how much
prediction results of the model and TCAD simulations are similar in Section 3.1. We also test the
generalization ability of the model compared with the baseline model in Section 3.2. At the end, we
discuss the results.
3.1 Ablation study
Figure 5 shows the prediction results of TCAD simulation. As described in Section 2.2, it is confirmed
that the DTI is vertically etched as the step progresses. However, the final shape derived from TCAD
simulation would not match with actual process results because of the following reasons. 1) The
physical models to describe the etching process are a work in progress. 2) TCAD simulators require
proper calibration of the model parameters to match the measurements; though, it would be difficult
to fit the measurements because there exist numerous calibration parameters. Figure 5 (b) interprets
our model prediction results applied to inductive biases. It is validated to be a good agreement with
physics of TCAD simulation. It is much better matched with the measurement of the final step than
TCAD simulation results. If Weibull activation is not applied, the DTI is not properly etched even
after the model learns the fact that the DTI is always etched (Fig. 5(c)). This result is much different
from TCAD simulation.
3.2 Generalization test
We assess how our model works better than baseline model. The training data and test data are
recipes consisted of five to nine steps and ten to eleven steps, respectively (Fig. 6 (a)). Our model’s
score has been improved by 9.4% compared to the baseline model (Fig. 6 (b)). The reason why
the improvement is lower than expectation is that output distribution is not changed although input
distribution is shifted. Nevertheless, NLL score is much better than the baseline model because the
prediction uncertainty is accumulated after each step (Fig. 7).
Figure 6: (a) Explanation of training and test input
recipe (b) Result of generalization test.
Figure 5: Prediction results.
Figure 7: Prediction results with the uncertainty as the each step advances.
44 Conclusion
We present a novel approach applying the inductive biases for etching process to learn causality
between each step. Our approach can generate profile at any step without intermediate data. Our
model proves that the DTI shape is a good agreement with TCAD simulation results. Above all,
our model can easily fit the measurement faster than TCAD simulation. These results may open
possibilities for a new, more convenient and more accurate way than TCAD simulation.
References
[1] Yarin Gal and Zoubin Ghahramani. “Dropout as a bayesian approximation: Representing model
uncertainty in deep learning”. In: international conference on machine learning. 2016, pp. 1050–
1059.
[2] Balaji Lakshminarayanan, Alexander Pritzel, and Charles Blundell. “Simple and scalable
predictive uncertainty estimation using deep ensembles”. In: Advances in neural information
processing systems. 2017, pp. 6402–6413.
[3] Scott M Lundberg and Su-In Lee. “A unified approach to interpreting model predictions”. In:
Advances in neural information processing systems. 2017, pp. 4765–4774.
[4] Marco Tulio Ribeiro, Sameer Singh, and Carlos Guestrin. “" Why should I trust you?" Explaining
the predictions of any classifier”. In: Proceedings of the 22nd ACM SIGKDD international
conference on knowledge discovery and data mining. 2016, pp. 1135–1144.
[5] RD Rung, H Momose, and Y Nagakubo. “Deep trench isolated CMOS devices”. In: 1982
International Electron Devices Meeting. IEEE. 1982, pp. 237–240.
[6] I Synopsys. “Sentaurus Topography 3D User Guide”. In: Synopsys, Mountain View, CA (2016).
[7] Ashish Vaswani et al. “Attention is all you need”. In: Advances in neural information processing
systems. 2017, pp. 5998–6008.
5You can also read