2021 EU wide stress test - Summary of results EBA Stress Testing Team 30 July 2021 - European Banking Authority
←
→
Page content transcription
If your browser does not render page correctly, please read the page content below
2021 EU‐wide stress test
Summary of results

EBA Stress Testing Team

30 July 2021
Agenda
Introduction
Overall results
Deep dive into the main drivers
Special focus on Covid‐19
Transparency, dissemination and wrap‐up
2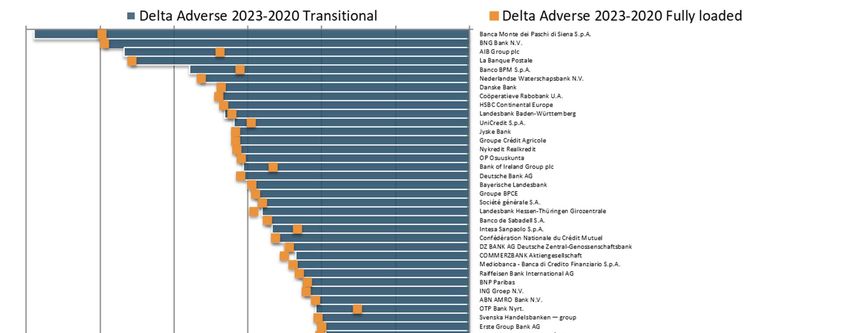
Agenda
Introduction
Overall results
Deep dive into the main drivers
Special focus on Covid‐19
Transparency, dissemination and wrap‐up
3
Introduction
Biennial exercise, initially scheduled for 2020 but postponed by 1 year as part of the temporary relief
measures decided by the EBA, due to the pandemic, for allowing banks to concentrate on operations and
funding the economy.
2021 EU‐wide stress test involves 50 banks from 15 EU and EEA countries, covering 70% of the EU banking
sector assets.
Main methodological changes compared to the 2018 exercise: the treatment of sight deposits; changes in
the minimum NPL coverage; new securitisation framework; P2R disclosure and enhancing transparency in
credit risk area; after postponed 2020: moratoria and public guarantees*; enlarging the scope of FX
treatment to NFCI and administrative expenses; changes in regulation (i.e. CRR “Quick Fix”).
This year’s stress test is characterised by a specific scenario that assumes a prolonged Covid‐19 scenario in
a “lower for longer” interest rate environment:
• very severe having in mind the weaker macroeconomic starting point in 2020;
• drop of GDP in three years by 3.6% in the EU, while the unemployment peaks in 2023 at 12.1%.
The individual bank results promote transparency and market discipline, and are an input into the
supervisory decision‐making process.
* Based on the stress test methodology, from 1 January 2021 onwards, moratoria is assumed to expire and its mitigating effect
is disregarded. Exposures under PGS are assumed to keep their guarantee throughout the stress test horizon. 4
Agenda
Introduction
Overall results
Deep dive into the main drivers
Special focus on Covid‐19
Transparency, dissemination and wrap‐up
5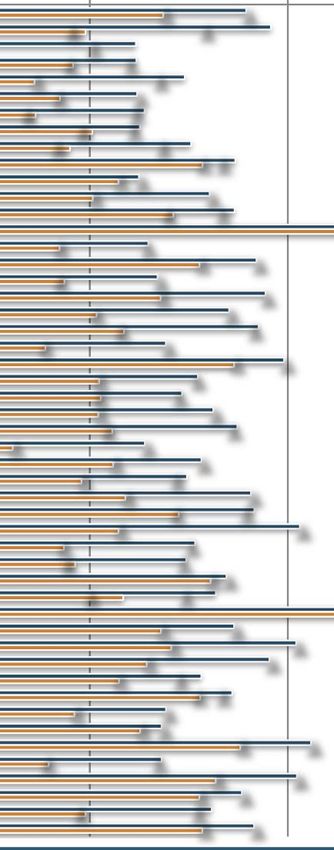
2021 ST results – Impact on EU aggregate CET1 ratio
Transitional – starting point 15.3% Fully loaded – starting point 15%
Stress test impact: ‐497bps Stress test impact: ‐485bps
Capital depletion: €273bn Capital depletion of €265bn
Increase of total REA: €866bn Increase of total REA: €868bn
Baseline Adverse Baseline Adverse
15.3% 15.4% 15.7% 15.8% 18%
16%
15.6% 15.8%
15.0% 15.2%
14% 15%
11.8%
12% 11.0%
10.3% 12% 11.2%
10.7%
10% 10.2%
8% 9%
6%
6%
4%
3%
2%
0% 0%
2020 2021 2022 2023 2020 2021 2022 2023
The impact (adverse) on CET1 capital ratio varies significantly across banks, ranging from a minimum decrease of
‐80 bps to a maximum decrease of ‐1,179 bps (transitional) or ‐80 bps to ‐996 bps (fully loaded).
The CET1 ratio impact in the 2018 EU‐wide stress test amounted to 410bps transitional and 395bps fully‐loaded.
In the baseline scenario, banks’ CET1 ratio increase by 51bps on transitional (78bps on fully‐loaded) basis.
6
2021 ST – Impact on leverage ratio (transitional)
Evolution of aggregate leverage ratio (%)                     LR dispersion – 5th and 95th percentiles,
                    Baseline   Adverse
                                                              interquartile range and median in the
7%                                                            adverse scenario (%)
                                5.9%        6.0%              11%
        5.7%       5.8%
6%
                                                              10%
5%                     4.8%         4.6%                       9%
                                                4.4%
                                                               8%
4%
                                                               7%
3%                                                             6%

2%                                                             5%
                                                               4%
1%
                                                               3%
0%                                                             2%
        2020         2021         2022        2023                     2020      2021     2022      2023

     Transitional leverage ratio falls from 5.7% in 2020 to 4.4% in 2023 – adverse.

     Drop solely due to decreasing T1 capital, as leverage exposure remain constant.

     In the adverse scenario, four banks report a ratio below 3% for every year of the stress test horizon

                                                                                                             7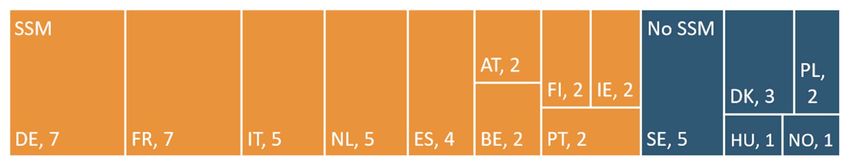
Impact on EU aggregate CET1 ratio by bank cluster
                                                    transitional     fully loaded

                       Aggregate                                                          497
                                                                                         485

                        domestic                                                                          610
                                                                                                  564
                    non‐domestic                                                         489
                                                                                        479

                          high NII                                        347
                                                                         333
                     non‐high NII                                                                547
                                                                                                536

                      large assets                                                        498
                                                                                         491
                  non‐large assets                                                       490
                                                                                       468

                                     0   100        200            300       400       500         600          700
                                         CET1 capital ratio depletion (from 2020 to 2023 adverse) (bps)

Cumulative capital depletion of 497 bps transitional (485 bps fully loaded)

Banks more focused on domestic market have higher depletion the banks more geographically diversified

Banks with higher Net Interest Income have lower capital depletion than other banks

The size of banks, in terms of total assets, is not a key driver for capital depletion
                                                                                                                      8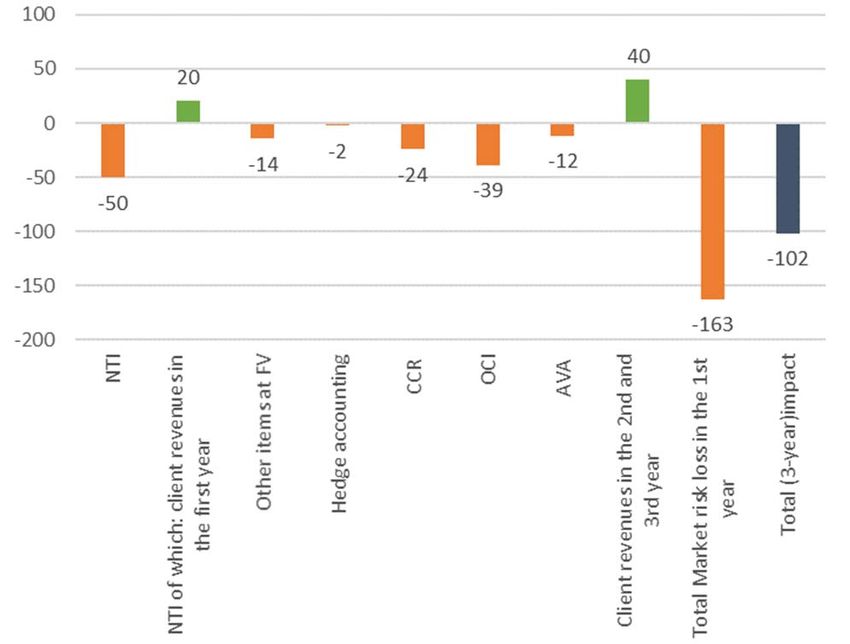
Aggregate waterfall

                                                  Market risk             Op and
                                                   losses                conduct
                                                                        risk losses

                                      Credit
                                        risk
                                      losses

Contribution from P&L: 2.9pp (3.9pp in 2018). The main driver is NII for which the contribution is around 100bps lower.
Credit losses have the highest impact: ‐€308bn, ‐423bps (‐425bps in 2018).
Market risk impact (including OCI): ‐€74bn, ‐102bps (‐52bps in 2018).
Op. risk: ‐€49bn, ‐68bps (‐100bps in 2018), mostly conduct risk, ‐37bps (‐65bps in 2018).
REAs increase by 12% compared to 2020, with a negative impact on capital of 121bps (‐160bps in 2018).

                                                                                                                          9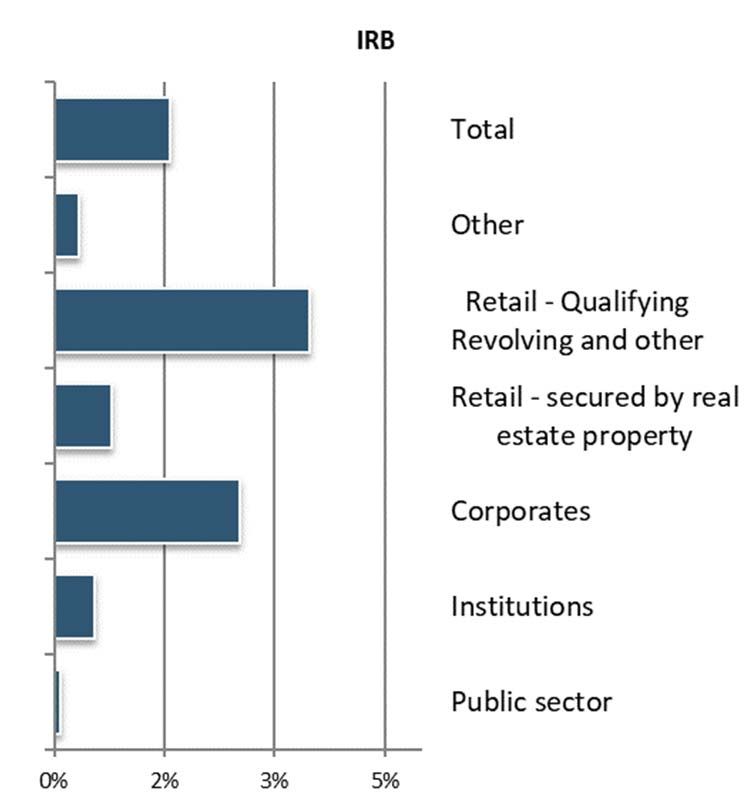
Summary of impacts ‐ Key results, aggregate EU level
                                                                                  Delta baseline   Delta adverse
 Metric                            Starting 2020   Baseline 2023   Adverse 2023
                                                                                   2023 ‐ 2020      2023 ‐ 2020

 Transitional CET1 capital ratio      15.3%           15.8%           10.3%           51 bps         ‐497 bps

 Fully loaded CET1 capital ratio      15.0%           15.8%           10.2%           78 bps         ‐485 bps

 Transitional leverage ratio           5.7%            6.0%           4.4%            28 bps         ‐130 bps

 Fully loaded leverage ratio           5.6%            6.0%           4.3%            39 bps         ‐124 bps

 Transitional CET1 capital           1,115 bn        1,180 bn         843 bn          65 bn           ‐273 bn

 Transitional total REA              7,284 bn        7,455 bn        8,149 bn        172 bn           866 bn

 Fully loaded CET1 capital           1,093 bn        1,176 bn         828 bn          84 bn           ‐265 bn

 Fully loaded total REA              7,279 bn        7,451 bn        8,148 bn        172 bn           868 bn

                                                                                                                10
Agenda
Introduction
Overall results
Deep dive into the main drivers
Special focus on Covid‐19
Transparency, dissemination and wrap‐up
11Impact on profitability, aggregate EU level
19%
0.9% 1.00%
0.73%
Net Trading income
0.04%
14% 1.8%
5.3%
Net Fee and Commission Income
4.5%
0.1%
9% Dividend income
0.1%
Net Interest Income
10.2%
4% 8.5%
‐0.1%
‐1% 2020‐23 unstressed cumulative impact of stress 2020‐23 adverse
(constant)
Cumulative net loss before tax as of end 2023 under the adverse scenario: ‐€140bn, ‐193bps.
Measured in terms of contribution to capital, if the P&L was assumed to be constant it would contribute 16.5pp;
however, due to the application of stress it reduces by 3.5pp. In particular: ‐176bps from NII, ‐73bps from NFCI, and
‐100bps from NTI.
Contribution to capital from NII is 845bps, while from NFCI 454bps (compared to 2018: 939bps and 468bps).
Notes: 2023 unstressed represents the cumulative contribution of NII, NTI, NFCI and dividend income as if the 2020 figures were kept unchanged.
2023 adverse represents the cumulative contribution of NII, NTI, NFCI and dividend income as of end 2023 under the adverse scenario.
12Administrative expenses, other operating expenses , other
provisions and depreciation
Evolution of admin expenses, other operating expenses, other provisions and depreciation
(EUR bn) Floor One‐off adjustments Banks' projections
300
250
200
150
100
50
0
2020 2021 2022 2023
The methodology requires banks to project administrative expenses, other operating expenses, depreciation and other provisions or
reversal of provisions floored at the starting level. Only adjustments coming from one‐off costs approved by the EBA BoS can be applied.
23 banks were allowed to adjust their cost projections due to justified one‐off events.
On a cumulative basis, the reduction over the three years due to one‐offs was EUR 27.9bn with an impact on CET1 of 38bps. Banks
projected expenses above the floor once this was adjusted with the one‐offs.
13Credit risk losses
Evolution of absolute credit losses (€ bn) Distribution of impairments by country of the
Baseline Adverse counterparty
180 100%
Others
160
Denmark
80% 36%
140 Belgium
120 Sweden
3%
100
60%
3% 2% United Kingdom
4%
80 7% U.S.A.
40% 7%
60 4% Spain
12% Netherlands
40
20% Italy
20 8%
Germany
0 15%
0% France
2021 2022 2023
Cumulative credit risk losses over the three years of the exercise in the adverse scenario are 308bn EUR, ‐ 423bps
impact on the CET1 capital ratio.
The credit risk impact reflects the distribution of exposures across asset classes (higher losses to corporate and retail
non‐secured by real estate) as well as the severity of the scenario in the country of the counterparties.
Exposures towards counterparties in France, Italy, Germany, US, Spain and the Netherlands show the largest losses.
14Evolution of credit risk exposures by stages
Share of exposures per stage (%)
Share of S1 Share of S2 Share of S3
100%
90%
90% 83% 81% 80%
80%
70%
60%
50%
40%
30%
20% 13% 14% 14%
8% 6%
10% 3% 5%
2%
0%
2021 (Jan) 2021 (Dec) 2022 2023
The share of stage 1 exposures decreased over the 3 years of the stress test horizon by 10pp, reflecting moves to
stage 2 and stage 3. The share of stage 2 and stage 3 exposures increased by 6pp and 4pp respectively. In 2023, the
share of stage 2 and stage 3 exposures stands at 14% and 6%, respectively.
Banks with high exposures towards the sectors most affected by COVID‐19 show higher flows to stage 3 than the
aggregate (above 2% per year vs. 1.5% per year for the aggregate). The share of stage 3 exposures for these banks
increased from ca. 3% in 2020 to 9% in 2023.
For stage 1 and stage 2 exposures, the coverage ratio stays fairly stable over the stress test horizon. For stage 3 it
steadily decreases. This is driven by the high increase in the share of stage 3 exposures and the lower loss rates being
applied to new defaults in comparison to the loss rates of the initial defaults.
15Credit risk losses by portfolio
Credit losses as a percentage of 2020 exposure (%)
In relative terms, as a percentage of total exposures, retail exposures non‐secured by real estate have the highest
level of cumulative impairments under the adverse scenario compared to the volume of exposures.
In absolute terms, corporate exposures contribute the most to total losses (46% of total losses), followed by retail
exposures (34% of the total, excluding secured by real estate).
16Market risk
Drivers of market risk losses in 2021 Evolution of market risk P&L impact (bps)
In the first year of the adverse scenario, market risk losses amount to 118bn EUR (163bps). The cumulative market risk
impact, considering also the income generated by client revenues projections over the 3 years of the adverse scenario, is
102bps. The dispersion of the total 3‐year cumulative impact coming from market risk is significant and ranges from ‐50 bps
(10th percentile) to ‐183 bps (90th percentile)
The main drivers of the market risk impact in 2021 are NTI, OCI and CCR which represent 31%, 24% and 15% of total market
losses, respectively.
The losses in the first year of the adverse scenario are partially offset by the positive income in the next years resulting in a
net cumulative P&L loss in the adverse scenario of ‐37bn EUR (51bps).
17Conduct risk and other operational risk losses
Operational risk losses(€ bn) Breakdown conduct risk and other operational risk (%)
20 100%
Baseline Adverse
18 90%
16 80%
14
70% Losses arising
12 from other
60% operational risk
10
50%
8 Losses arising
40% from conduct
6 risk
30%
4
20%
2
10%
2020 2021 2022 2023 0%
Aggregate cumulative operational risk losses in the adverse scenario are 49bn EUR. Conduct risk losses account for
26.7bn EUR, the remaining amount (22.5bn EUR) is composed of projected losses classified as other operational risk.
Banks projected the largest volumes of losses in 2021.
18Total REA
120 Other risk exposure amounts
110 112
107 11
100 11 Risk exposure amount for operational risk
100 11
5 5
10 5 3 3
4 2 Risk exposure amount for market risk
80 1
29 29
29 Credit risk ‐ Contributions to default fund of
28
a CCP
60
Credit risk ‐ Securitisation and re‐
securitisations positions
40 Credit risk ‐ Standardised approach
61 portfolios
58 60
54
Credit risk ‐ IRB approach portfolios
20
TOTAL REA
‐
2020 2021 2022 2023
Total REA increase by 12% as of end 2020, with a capital impact of 121bps.
The main driver of the increases come from credit risk IRB portfolios.
19Agenda
Introduction
Overall results
Deep dive into the main drivers
Special focus on Covid‐19
Transparency, dissemination and wrap‐up
20Analysis of the impact of Covid‐19
Loans under moratoria per stage (%)
100%
3% 8% 11% 13%
90%
24% 27% 27% 25%
80%
Metric 2020
70%
Exposures under moratoria (% of total exposures) 4.2% 60%
of which expired 2.8%
50%
of which non‐expired 1.4%
40%
73% 65% 62% 62%
Newly originated loans and advances subject to COVID‐19 30%
public guarantee schemes (PGS) (% of total exposures) 1.6%
20%
10%
0%
2020 2021 2022 2023
Stage 1 Stage 2 Stage 3
From the total exposures at the end of 2020, about 4% had benefitted of moratoria measures (two thirds of which
already expired by the end of 2020); less than 2% was subject to public guarantee schemes (PGS).
As of end 2020, stage 3 exposures represented 3% of exposures that benefitted of moratoria (2% for the whole
portfolio; 1% for PGS); as of end 2023 the projected share of stage 3 exposures is 13% (6% for the entire portfolio,
7% for PGS).
21Agenda
Introduction
Overall results
Deep dive into the main drivers
Special focus on Covid‐19
Transparency, dissemination and wrap‐up
22Transparency and disclosure
EBA will publish on 30th July 2021, 18:00 CET the results of the 2021 EU‐wide stress
test. The disclosure will cover extensive amount of comparable bank‐by‐bank actual
and projected data.
10 transparency templates will be disclosed for each bank:
8 templates which were available in previous years: TRA_SUM, TRA_CR_IRB,
TRA_CR_SA, TRA_CR_SEC, TRA_REA, TRA_CAP, TRA_P&L and TRA_CAPMEAS
2 new templates added: TRA_CR_COVID19_IRB and TRA_CR_COVID19_SA,
which summarise credit risk results in the context of Covid‐19 support
measures
50 banks participating from 15 EEA countries
23Analysis, data and tools
Analysis of Individual
results Transparency
Aggregate templates
report 50 files – one
Frequently for each bank
Asked (pdf)
Questions
Visualization Entire dataset
tools Transparency
www.eba.europa.eu templates
4 tools with Press Release
individual 4 CSV files
30 July at 18:00 CET
results and plus metadata,
EU/country data dictionary,
aggregates manual
24Conclusions
Banks started the exercise with the highest CET1 ratios compared to the
previous EU‐wide stress tests.
This year’s scenario is very severe (more than the one in 2018), there is a
different and very specific narrative.
The results show a high depletion close to 500 bps, but banks finish the exercise
above 10% CET1 ratio on average.
Credit risk remains the main driver, but there is a higher impact on NII
compared to previous stress tests.
The results also show dispersion across banks. Banks more focused on domestic
activities or with lower net interest income (NII), display a higher depletion.
The baseline scenario results provide comparable information about individual
banks in the context of a gradual exit from the pandemic.
The results facilitate market discipline and will be used as an important input
into the SREP.
25ANNEX: Bank‐by‐bank results
26Bank‐by‐bank impact, order by size of transitional impact
25% of the banks report a decrease above 631bps, with another 25% of banks reporting a decrease below 360bps.
27Bank‐by‐bank impact, order by size of FL impact
25% of the banks report a decrease above 621bps, with another 25% of banks reporting a decrease below 315bps.
28Bank‐by‐bank CET1 ratio, starting and end point (%)
0% 10% 20% 30% 40% 50%
ABN AMRO Bank N.V.
AIB Group plc
Banca Monte dei Paschi di Siena S.p.A.
Banco Bilbao Vizcaya Argentaria S.A.
Banco BPM S.p.A. Transitional CET1 starting 2020
Banco Comercial Português, SA
Banco de Sabadell S.A.
Banco Santander S.A.
Transitional CET1 adverse 2023
Bank of Ireland Group plc
Bank Polska Kasa Opieki SA Fully loaded CET1 starting 2020
Bankinter, S.A.
Bayerische Landesbank Fully loaded CET1 adverse 2023
Belfius Banque SA
BNG Bank N.V.
BNP Paribas
Caixa Geral de Depósitos, SA
COMMERZBANK Aktiengesellschaft
Confédération Nationale du Crédit Mutuel
Coöperatieve Rabobank U.A.
Danske Bank
Deutsche Bank AG
DNB Bank Group
DZ BANK AG Deutsche Zentral‐Genossenschaftsbank
Erste Group Bank AG
Groupe BPCE
Groupe Crédit Agricole
HSBC Continental Europe
ING Groep N.V.
Intesa Sanpaolo S.p.A.
Jyske Bank
KBC Group NV
La Banque Postale
Landesbank Baden‐Württemberg
Landesbank Hessen‐Thüringen Girozentrale
Länförsäkringar Bank AB (publ)
Mediobanca ‐ Banca di Credito Finanziario S.p.A.
Nederlandse Waterschapsbank N.V.
Nordea Bank Abp
Nykredit Realkredit
OP Osuuskunta
OTP Bank Nyrt.
Powszechna Kasa Oszczednosci Bank Polski SA
Raiffeisen Bank International AG
SBAB Bank AB – group
Skandinaviska Enskilda Banken — group
Société générale S.A.
Svenska Handelsbanken — group
Swedbank — group
UniCredit S.p.A.
Volkswagen Bank
Large dispersion also of banks’ capital position at the starting and end‐point. CET1 ratios range from 12.1% to 45.1% on a transitional
basis (from 9.9% to 45.1% on a fully loaded basis) at the end of 2020 and from 0.3% to 37.8% on a transitional basis (from ‐0.1% to
37.8% on a fully loaded basis) at the end‐2023 adverse scenario.
All banks have a CET1 capital ratio in excess to the overall capital requirement (OCR), with a median excess capital of 704 bps; 90% of the
sample (45 banks) has an excess capital above 391 bps. Under the adverse scenario, in 2023 the median excess capital is 528 bps with
respect to the relevant total SREP capital requirement (TSCR); 90% of the banks of the sample is above 219 bps; and two banks are 29
below the TSCR. 22 trigger MDA rules during the projection years of the stress test.EUROPEAN BANKING AUTHORITY Floors 24‐27, 20 Av André Prothin, 92927 Paris La Défense Tel: +33 1 86 52 7000 E‐mail: info@eba.europa.eu http://www.eba.europa.eu
You can also read