The oxygen consumption rate of an inactive dry yeast (IDY) selected to protect wine from oxidation

Page created by Frederick Ross
 
CONTINUE READING
The oxygen consumption rate of an inactive dry yeast (IDY) selected to protect wine from oxidation
The oxygen consumption rate
                                          of an inactive dry yeast (IDY)
                                               selected to protect wine
                                                        from oxidation

                                                                             Pere Pons1, José M. Heras2, Nathalie Sieczkowski2,
                                                                                     Joan Miquel Canals1, Fernando Zamora1
                                                  1
                                                      Department of Biochemistry and Biotechnology. Tarragona Oenology Faculty.
                                                             Universidad Rovira i Virgili. C/ Marcel.lí Domingo 1. 43002-Tarragona.
                                                                     2
                                                                         Lallemand Bio S.L. C/ Galileu 303. 1ª planta. 08028-Barcelona.

                                                                 This article was published in InvestIgacIón y Ciencia, Jan / Feb 2019

Visionary biological solutions / www.lallemandwine.com
The oxygen consumption rate of an inactive dry yeast (IDY) selected to protect wine from oxidation
Abstract
The oxygen consumption rate of a specific inactivated yeast (Pure-Lees™
Longevity, Lallemand) specially selected to protect wine from oxidation
thanks to its high capacity for oxygen consumption was calculated using
a non-destructive luminescence-based technique in a model solution,
to which different concentrations of inactive dry yeast, sulphur dioxide
or ascorbic acid were added. Results indicate that the specific inacti-
vated yeast consumes oxygen at a similar rate to sulphur dioxide at the
usual concentrations of use for both antioxidants.

                                                 Introduction
Ageing on lees, particularly white wines, is currently a widespread
practice in winemaking [1]. The presence of lees in contact with the
wine enriches the wine with polysaccharides and mannoproteins
through the process of autolysis [2,3], which translates into increased
mouth-feel [4,5] and, in the case of red wines, lower astringency [3,6].
Similarly, when it comes to sparkling wines, the presence of these
macromolecules helps the incorporation of carbon dioxide gas and
promotes foam stability [7,8]. Finally, the presence of mannoproteins
aid the wine stability, helping to combat protein degradation [9] and
prevent the appearance of tartaric acid salt crystals [10].

Another positive effect of the presence of lees on wine quality is their
ability to lees consume oxygen [11,12], thereby protecting the wine
from oxidation, both in terms of it’s colour and it’s aroma [4,13].

However ageing on lees, as well as being laborious, does entail certain
risks such as the appearance of reduced aromas [4], increased produc-
tion of histamines and other biogenic amines [14], or the development
of problematic microorganisms such as Brettanomyces/Dekkera [14,15].

For this reason, the use of specific inactivated yeasts (SIY) has increased
over the past few years as a source of mannoproteins and polysaccha-
rides. SIYs enrich wines with these macromolecules without any of the
aforementioned disadvantages [3,16]. More recently, it has been sug-
gested that some SIYs may act to protect musts and wines from oxi-
dation due to their high levels of glutathione [17], and also that some
may directly consume oxygen [18].

Given the interest in looking for alternative antioxidants to sulphur
dioxide for protecting wine from oxidation, the aim of this study is to
evaluate the oxygen-consumption capacity of one SIY (Pure-Lees™
Longevity. Lallemand), which has been specially selected for its high
capacity for oxygen consumption, when compared to the two most
commonly-used antioxidant additives, sulphur dioxide and ascorbic acid.

                            Materials and methods
The oxygen-consumption rate is calculated using a non-destructive
luminescence-based technique, as described by Pascual et al, (2017)
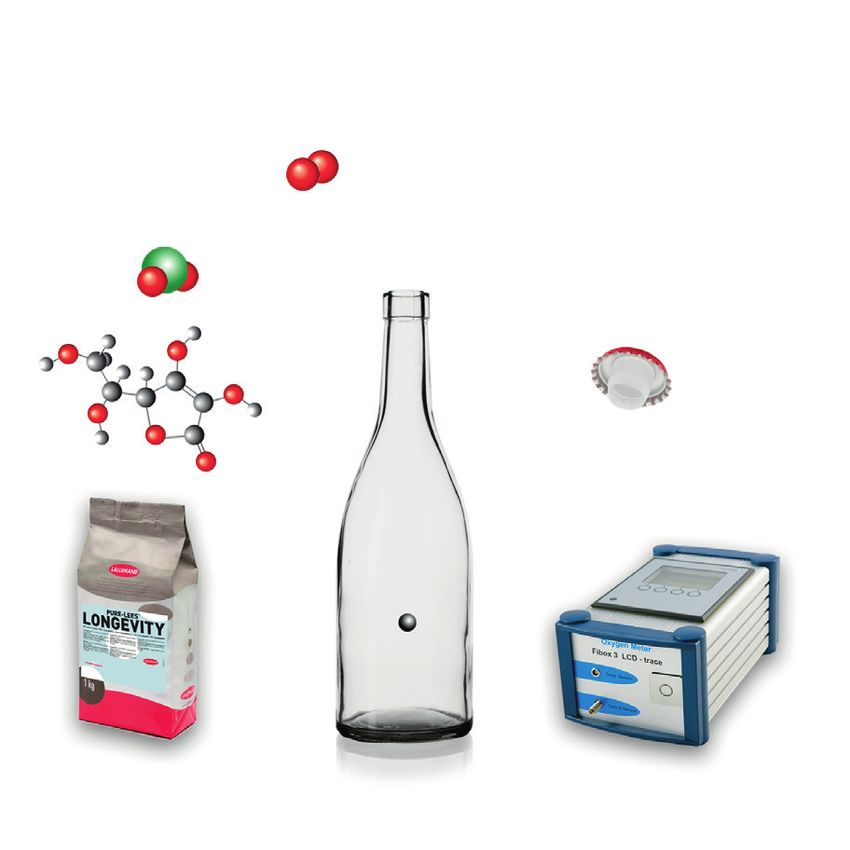
[19]. Figure 1 shows the experimental protocol used in this study.
Sensors (PreSens Precision Sensing GmbH, Regensburg, Germany)
                                     were attached to the insides of transparent bottles (0.75 L) to measure
                                     dissolved oxygen.
                                                                                                                                                    Model wine solution
                                                                                            O2                                                        - Ethanol: 12% (v/v)
                                                                                                                                                      - Tartaric acid: 4 g/L
                                                                                                                                                      - pH: 3.5
                                                    SO2                                                                                               - Fe (III): 3 mg/L
                                                                                                                                                      - Cu (II): 3 mg/L

                                         Ascorbic                                                                                                          Crown cap
                                             acid                                                                                                          and seal insert

                                                                                                                                      Spot
                                      Pure-Lees™
                                       Longevity

                                              Figure 1. Experimental protocol to measure O2 consumption in
                                                         model wine by three different antioxidants.

                                     These sensors were fixed to the centre of the inside of the bottle, which
                                     was filled with a model solution composed of 12% ethanol, 4 g tartaric
                                     acid/L, 3 mg/L of iron (III) and 0.5 mg/L of copper (II). The pH was ad-
                                     justed to 3.5. This solution was saturated with oxygen by bubbling air
                                     through it for 10 minutes. To these bottles, 0, 50, 100 and 150 mg/l of
                                     SO2 or ascorbic acid was added, or 200, 400 and 600 mg/L of the spe-
                                     cific inactivated yeast (Pure-Lees™ Longevity. Lallemand). The bottles
                                     were then hermetically sealed and kept at a constant temperature of
                                     20°C. Oxygen concentration was measured for the first time one hour
                                     later, and was then measured periodically until oxygen consumption
                                     was complete.

                                                                                                                                                                  Results
                                     Figure 2 shows oxygen consumption by SO2, ascorbic acid and the spe-
                                     cific inactivated yeast over time. These graphs clearly show that all three
                                     antioxidants (SO2, ascorbic acid and the specific inactivated yeast) do
                                     consume oxygen     over time.
                                                     Figure   2. Oxygen consumption
Oxygen consumption (mg/L)

                                                                                                         Oxygen consumption (mg/L)

                                     SO2                                                                                                       Ascorbic acid
                            10                                                                                                       10
                                          2

                             8                                                                                                        8

                             6                                                                                                        6

                             4                                                               50 mg/L                                  4                                    50 mg/L
                                                                                                                                                                          100 mg/L
                             2                                                              100 mg/L                                  2                                   150 mg/L
                                                                                            150 mg/L
                             0                                                                                                        0
                                 0            5                                       10         15                                       0     1     2       3       4        5     6
                                                  Time (days)                                                                                             Time (hours)
                                                     Oxygen consumption (mg/L)

                                                                                 10        Pure-Lees™ Longevity
                                                                                  8

                                                                                  6                                                                          200 mg/L
                                                                                  4                                                                          400 mg/L
                                                                                                                                                             600 mg/L
                                                                                  2

                                                                                  0
                                                                                      0          5                                        10          15
                                                                                                      Time (days)

                                              Figure 2. Oxygen consumption of three different antioxidants
It should be noted that ascorbic acid consumes oxygen much more ra-
                                 pidly than SO2 and the specific inactivated yeast, as the time scale on
                                 this graph Figure
                                            is hours,3. Modelling
                                                     whereas        of antioxidants
                                                             the other oxygen consumption
                                                                                    are measured in days.
 1/Oxygen consumption (mg/L)

                                                                                                                                      1/Oxygen consumption (mg/L)
                                     SO2  2

                               2.0                                                                                                                                        1/t = 0.20/[O2] + 0.10
                                                                                                                                                                               r2 = 0.9956
                                        1/t = 1.28/[O2] + 0.08
                                                                                                                                                                    0.5                          1/t = 0.08/[O2] + 0.09
                                                                                                                                                                                                      r2 = 0.9941
                               1.5           r2 = 0.9899                                     1/t = 0.78/[O2] + 0.05
                                                                                                                                                                    0.4
                                                                                                  r2 = 0.9880
                               1.0                                                                                                                                  0.3
                                                                                                                       50 mg/L
                                                                                                                      100 mg/L                                      0.2
                               0.5                                                                                                                                                                    1/t = 0.05/[O2] + 0.09
                                                                                      1/t = 0.55/[O2] + 0.05
                                                                                           r2 = 0.9818                150 mg/L                                      0.1
                                                                                                                                                                                                           r2 = 0.9962

                               0.0                                                                                                                                            Ascorbic acid
                                  0.0         0.5                            1.0                  1.5                                                               0.0
                                                                                                                                                                          0       1          2         3          4
                                              1/Time (days)
                                                                                                                                                                                   1/Time (hours)
                                                        1/Oxygen consumption (mg/L)

                                                                                              Pure-Lees™ Longevity
                                                                                      1.0
                                                                                      0.8       1/t = 0.50/[O2] + 0.21
                                                                                                     r2 = 0.9586                     1/t = 0.25/[O2] + 0.15
                                                                                      0.6                                                 r2 = 0.9304

                                                                                      0.4                                                                                      200 mg/L
                                                                                      0.2                         1/t = 0.21/[O2] + 0.12                                       400 mg/L
                                                                                                                       r2 = 0.9646                                             600 mg/L
                                                                                      0.0
                                                                                         0.0            0.5           1.0           1.5
                                                                                                        1/Time (days)

                                     Figure 3. Modelling of oxygen consumption by three different antioxidants

                                 With the aim of modelling and parametrizing the kinetics of oxygen
                                 consumption, different models of adjustment were tried. Represen-
                                 tation of the inverse oxygen consumed compared to inverse time
                                 was the model that provided the best linear adjustment. Figure 3
                                 demonstrates the results obtained. It can be seen that excellent li-
                                 near regression coefficients were obtained, which confirms that this
                                 mathematical model works well. Using this model, the following
                                 equation can be established.

                                 1 / [O2] = a / t + B.

                                 This equation describes the relationship between oxygen consumed
                                 and the time function which allows for, after carrying out the first deri-
                                 vative and considering the baseline (time zero), the calculation of the
                                 oxygen  consumption
                                     Figure            rate (OCR)of
                                              4. Calculation      which
                                                                     thecorresponds     to the inverse
                                                                           baseline (time       zero) of
                                 the equation slope. These calculations can be seen in Figure 4.
                                                        oxygen consumption rate (bOCR)

                                              1. Solve for [O2]                                            2. First                                                                   3. For t = 0
                                                                                                              derivative
 1                                                                                                               d[O2]                                                                       d[O2]   1
    = A +B                                            [O2] =
                                                                                           t
                                                                                                                       = 2
                                                                                                                               A
                                                                                                                                                                                                   =   = TCOt0
[O2] t                                                                                  A + Bt                     dt    A +2ABt + B2t2)                                                      dt     A

                                Figure 4. Calculation of the baseline (time zero) oxygen consumption rate (bOCR)

                                 With the slopes obtained through applying this model of adjustment
                                 it is possible to calculate the relationship between concentration of
                                 SO2, ascorbic acid or specific inactivated yeast and the baseline oxy-
                                 gen consumption rate (bOCR). Figure 5 illustrates the result.
Figure 5. Oxygen consumption rates (bOCR0) for SO2,
                   ascorbic acid and specific inactivated yeast
                                               Inactive dry yeast

            bOCR0 (mg of O2/L.day)

                                                                                                       bOCR0 (mg of O2/L.hour)
                                     2.0                                                                                         20        Ascorbic acid

                                     1.5                                                                                         15

                                     1.0                                                                                         10
                                                                                                                                                      y=0.0124x+1.001
                                     0.5                                     y=0.0119x+0.0789                                     5                      r2=0.9954
                                                                                 r2=0.9884
                                     0.0                                                                                          0
                                           0           50                         100     150                                         0       50      100      150
                                                 [SO2] (mg/L)                                                                             [Ascorbic acid] (mg/L)

                                                                                   Pure-Lees™ Longevity

                                                   bOCR0 (mg of O2/L.hour)
                                                                             20

                                                                             15

                                                                             10

                                                                              5                  y=0.0072x+0.368
                                                                                                    r2=0.9527
                                                                              0
                                                                                  0 200     400     600                          800
                                                                                        [LSI] (mg/L)

                                       Figure 5. Oxygen consumption rates (bOCR0) for SO2, ascorbic acid
                                                          and specic inactivated yeast

                    The results demonstrate that there is a good linear relationship between
                    oxygen consumption and the concentration of the three antioxidants.
                    The slopes of the regression lines correspond to the oxygen consump-
                    tion rates as reflected in Table 1. In this table, it can be seen that ascorbic
                    acid has a much higher oxygen consumption rate than sulphur dioxide
                    or specific inactivated yeast (around 300 times faster). However, it should
                    be taken into account that ascorbic acid generates hydrogen peroxide,
                    and its use without the addition of SO2 can generate greater oxidation
                    after a certain length of time [20]. However, the specific inactivated
                    yeast Pure-Lees™ Longevity consumes oxygen when applied at 40g/hL
                    at a rate of 0.29 mg of oxygen/day. This value is very similar to sulphur
                    dioxide at a dose of 20 mg/L (0.24 mg of oxygen/day), meaning that its
                    efficacy can be considered to be equivalent to that of SO2 at its usual
                    levels of use.

                    Table1. Oxygen consumption rates (OCR) for SO2,
                            ascorbic acid and specific inactivated yeast
                                                                                                  Oxygen consumption rate (OCR)
         Antioxidant
                                                                                                                                          mg O2/day

                                        mg O2/mg
 Ascorbic                                                                         [Asc. Ac] = 50 mg/L                            [Asc. Ac] = 100 mg/L        [Asc. Ac] = 150 mg/L
                                     Ascorbic acid.day
   Acid
                                           2.976                                        148.8                                                297.6                      446.4
                                        mg O2/mg
                                         SO2.day
                                                                                   [SO2] = 20 mg/L                                [SO2] = 40 mg/L              [SO2] = 60 mg/L
   SO2
                                           0.0119                                         0.24                                               0.48                       0.71
                                        mg O2/mg
Pure-Lees™                               SIY.day
                                                                                   [SIY] = 20 mg/hL                               [SIY] = 40 mg/hL            [SIY] = 60 mg/hL
Longevity
                                           0.0072                                         0.14                                               0.29                       0.43
Conclusion
The results show that the specific inactivated yeast Pure-Lees™ Longevity
consumes oxygen in a model medium at a similar rate to sulphur dioxide,
and therefore could be a good alternative to SO2 and a means to reduce
the levels of SO2 used during winemaking, while still protecting wine from
oxidation.
                                  Acknowledgements

This study was funded by CDTI (CIEN Programme) “new strategies in
the wine sector for sustainability and increased competitiveness on
the international market (VINYSOST 2014).”

                                                 Bibliography

1. Zamora F. (2002) La crianza del vino tinto sobre lías; Una nueva
   tendencia. Enólogos, 19, 24-29.

2. González, E., Urtasun, A., Gil, M., Kontoudakis, K., Esteruelas, M.,
   Fort, F., Canals, J.M., Zamora, F. (2013) Effect of yeast strain and sup-
   plementation with inactive yeast during alcoholic fermentation on
   wine polysaccha- rides. Am. J. Enol. Vitic., 64, 268-273.

3. González-Royo, E., Esteruelas, M., Kontoudakis, N., Fort, F.,
   Canals, J.M., Zamora, F. (2017) The effect of supplementation with
   three commercial inactive dry yeasts on the color, phenolic com-
   pounds, polysaccharides and astringency of a model wine solution
   and red wine. J. Sci. Food Agric., 97, 172–181.

4. Fornairon-Bonnefond, C., Camarasa, C., Moutounet, M., Salmón,
   J.M. (2002) New trends on yeast autolysis and wine ageing on lees:
   a bibliographical review. J. Int. Vigne Vin 36, 49-69.

5. Del Barrio-Galán, R., Pérez-Magariño, S., Ortega- Heras, M., Williams,
   P., Doco, T. (2011) Effect of aging on lees and of three different dry
   yeast derivative products on verdejo white wine composition and
   sensorial characteristics. J. Agric. Food Chem., 59,12433–12442.

6. Quijada-Morín, N., Williams, P., Rivas-Gonzalo, J.C., Doco, T., Escri-
   bano-Bailón, M.T. (2014) Polyphenolic, polysaccharide and oli-
   gosaccharide composition of tempranillo red wines and their
   relationship with the perceived astringency. Food Chem., 154. 44-5.

7. Esteruelas, M., González-Royo, E., Kontoudakis, N., Orte, A., Cantos,
   A., Canals, J.M., Zamora, F. (2015) Influence of Grape Maturity on
   the Foaming Properties of Base Wines and Aparkling Wines (cava).
   J. Sci. Food Agric., 95, 2071-2080.

8. González-Royo, E., Pascual, O., Kontoudakis, N., Este- ruelas, M., Es-
   teve-Zarzoso, B., Mas, A., Canals, J.M., Zamora, F. (2015) Oenological
   consequences of sequential inoculation with non-Saccharomyces
   yeasts (Torulaspora delbrueckii or Metschnikowia pulcherrima) and
   Saccharomyces cerevisiae in base wine for sparkling wine produc-
   tion. Eur. Food Res. Technol., 240, 999-1012.

9. Lubbers, S., Leger, B., Charpentier, C., Feuillat, M. (1993) Effet des
   colloïdes-protecteurs d’extraits de parois de levures sur la stabilité
   tartrique d’un vin modè- le. J. Int. Sci. Vigne Vin 27,13-22.
10. Waters, E.J., Pellerin, P. Brillouet, J.M. (1994) A Saccharomyces
    mannoprotein that protects wine from pro- tein haze. Carbohydr.
    Polym., 23,185-191.

11. Fornairon, c., Mazauric, J.P., Salmon, J.M., Moutounet, M. (1999) Ob-
    servations sur la consommation de l’oxygène pen- dant l’élevage
    des vins sur lies. J. Int. Vigne Vin, 33, 79-86.

12. Salmon, J.M ,Mazauric, J.P.,. Fornairon, C. Y Moutou- net, M.(2001)
    L’enjeu œnologique de l’élevage sur lie des vins rouges. I – Les lies
    de levure et la consommation d’oxygène. en “connaissances ac-
    tuelles & avenir de l’élevage en barriques. Burdeos, pp 39-42.

13. Salmon, J.M., Fornairon-Bonnefond, C., Mazauric, J.P., Moutounet,
    M. (2000) Oxygen consumption by wine lees: impact on lees inte-
    grity during wine ageing. Food Chem., 71, 519-528.

14. Pérez-Serradilla, J.A., Luquede Castro, M.D. (2008) Role of lees in
    wine production: a review. Food Chem., 111, 447-456.

15. Oelofse, A., Pretorius, I.S., du Toit, M. (2008) Significance of Bret-
    tanomyces and Dekkera during Winemaking: a synoptic Review. s.
    afr. J. Enol. Vitic., 29, 128-144.

16. Pozo-Bayón, M.A., Andujar-Ortiz, I., Alcaide-Hidalgo, J.M., Martín-Ál-
    varez, P.J., Moreno-arribas, M.v. (2009) characterization of com-
    mercial inactive dry yeast preparations for enological use based
    on their ability to release soluble compounds and their behavior
    toward aroma compounds in model wines. J. Agric. Food Chem., 57,
    10784-10792.

17. Andújar-Ortiz, I., Chaya, C., Martín-Álvarez, P.J., Moreno-Arribas,
    M.V., Pozo-Bayón, M.A. (2014) Impact of using new commercial
    glutathione enriched inactive dry yeast oenological preparations
    on the aroma and sensory properties of wines. Int. J. Food Prop., 17,
    987-1001.

18. Pons, P., Heras, J.M., Sieczkowski, N., Canals, J.M., Zamora, F. (2018)
    Determinación de la tasa de consumo de oxígeno por parte de una
    levadura seca inactivada (LsI); comparación con el ácido ascórbico
    y con el dióxi- do de azufre. Comunicación al XIV Congreso Nacional
    de Investigación Enológica. GIENOL 2018.

19. Pascual, O., Vignault, A., Gombau, J., Navarro, M., Gómez-Alonso, S.,
    García-Romero, E., Canals, J.M., Her- mosín-Gutíerrez, I., Teissedre,
    P.L., Zamora, F. (2017) Oxygen consumption rates by different oe-
    nological tannins in a model wine solution. Food Chem., 234, 26-32.

20. Peng, Z., Duncan, B., Pocock, K.F., Sefton, M.A. (1998) The effect of
    ascorbic acid on oxidative browning of white wines and model
    wines. Aust. J. Grape Wine Res., 4, 127-135.
You can also read