Optimization of Rectilinear Motion Experiments using Tracker Application
←
→
Page content transcription
If your browser does not render page correctly, please read the page content below

IOP Conference Series: Materials Science and Engineering

PAPER • OPEN ACCESS

Optimization of Rectilinear Motion Experiments using Tracker
Application
To cite this article: M G Nugraha et al 2018 IOP Conf. Ser.: Mater. Sci. Eng. 288 012096

View the article online for updates and enhancements.

                               This content was downloaded from IP address 46.4.80.155 on 24/09/2021 at 11:47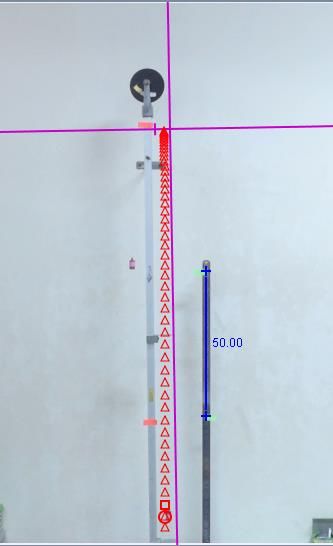
The 2nd Annual Applied Science and Engineering Conference (AASEC 2017)                     IOP Publishing
IOP Conf. Series: Materials Science and Engineering 288 (2018) 012096 doi:10.1088/1757-899X/288/1/012096
                                               1234567890‘’“”

Optimization of Rectilinear Motion Experiments using Tracker
Application

                     M G Nugraha1*, K H Kirana2, F Nugraha1, E A Nurinsani1 and F N Sholihat1
                     1
                       Physics Education Department, Universitas Pendidikan Indonesia, Jl. Dr. Setiabudhi
                     229 Bandung, Indonesia, 40154
                     2
                       Geophysics Department, Universitas Padjadjaran, Jl. Raya Bandung-Sumedang Km
                     21, Jatinangor 45363

                     *muhamadginanugraha@upi.edu

                     Abstract. Physics is one part of Natural Sciences which underlies the development of
                     technology, so that the process of learning Physics should not only emphasize the mastery of the
                     concept but also on aspects of the discovery as the scientist did. Therefore, experimental
                     activities are considered very important in Physics learning. In the experimental activities, it is
                     important to have appropriate tools and methods of measurement to obtain accurate findings.
                     One of the experimental activities of physics which conducted in school is a uniformly
                     acceleration rectilinear motion using a set of dynamics train experiment and Atwood experiment.
                     The measurement methods of both experiments generally use conventional tools, i.e. ruler,
                     stopwatch and ticker timer that are susceptible to interruptions and errors in the data acquisition
                     process. One method of measuring and processing data that considered has more precision is to
                     use the application tracker. In this research, a uniform rectilinear motion kinematics experiments
                     have been done with two methods of measurement using conventional tools and compared with
                     using the tracker by recording the movement of objects using high definition camera (HD) with
                     24 fps shooting speed. The results showed that the result using tracker to produce some
                     acceleration data is more constant than the result using conventional methods. In addition, time-
                     positions graphs (s = f (t)) are formed in the form of quadratic and time-velocity graphs (v = f
                     (t)) are straight lines with a constant gradient corresponding to the rectilinear motion theory.
                     Based on the results of the research, the use of tracker application in the experimental kinematics
                     of rectilinear motion produces more accurate data so it can be used as an alternative to optimize
                     the experiments of rectilinear motion.

1. Introduction
Physics as one of the cornerstone in the development of technology, must be supported by learning
activities that can provide opportunities for learners to find and apply the knowledge gained. This is
linear with statement which say the nature of Physics as part of the natural science that requires learners
to gain experience of discovery as scientists discover theories, concepts and laws [1] [2]. Efforts in order
to develop student skills as a potential scientist can be done through experimental activities, because in
the experimental activities students can develop the way of thinking and how to work as a scientist [3].
In experimental activities, students are actively involved in a process, observing an object, analyzing,
proving, and drawing its own conclusions about a particular object, state or process [4]. In other words,
experimental activities can provide experience for students to learn directly from the activities they do

              Content from this work may be used under the terms of the Creative Commons Attribution 3.0 licence. Any further distribution
              of this work must maintain attribution to the author(s) and the title of the work, journal citation and DOI.
Published under licence by IOP Publishing Ltd                          1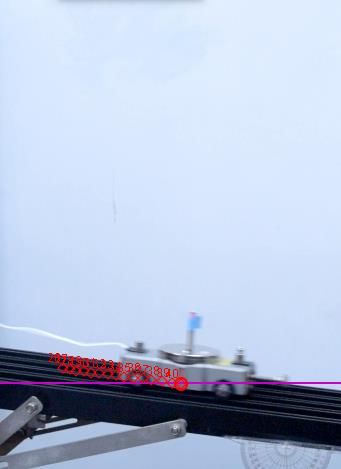
The 2nd Annual Applied Science and Engineering Conference (AASEC 2017)                     IOP Publishing
IOP Conf. Series: Materials Science and Engineering 288 (2018) 012096 doi:10.1088/1757-899X/288/1/012096
                                               1234567890‘’“”

(learning by doing) so that students are not only able to master the concept but also can develop and
cultivate high-level process and thinking skills.
    The use of media in learning has a great contribution on the effectiveness of learning [5], therefore
the selection and use of measuring tools and methods in experiments need to be reviewed and developed
in order to produce precise and accurate data. One of the most common experimental activities in a
school is a uniformly changing rectilinear motion using a set of dynamics train and a set of Atwood
machine as shown in Figure 1. In the data acquisition process, generally the measurement of motion
parameters in both sets of experimental devices is still done manually, which uses the ruler to measure
length of track and stopwatch to measure the travel time of the object motion. Manual measurement
method is very susceptible to errors due to measuring factors that are less precise or error when retrieving
data by students, so the data measurement results are very subjective. In addition to the ruler and
stopwatch, another commonly used measuring tool is the ticker timer. Ticker timer is a tool that can
provide tap on the band with a fixed frequency, leaving a trail on the ribbon [6]. The traces generated
by ticker timer can be used to investigate the relationship between the movement and the travel time of
the object, the relationship between the velocity with the travel time and the relationship between the
acceleration with the travel time of the object. Utilization of ticker timer has several weaknesses and
constraints, i.e. the trace of the ticker timer ticks the longer it looks unclear, this is because the carbon
paper used to bring the trace will be more depleted. In addition, the use of paper tape on the ticker timer
directly provides obstacles to the movement of the object. Both of these have resulted in inaccurate data
being obtained.
    One of the predicted solutions which can generate more accurate motion parameter data is to use
Tracker. Tracker is software to analyze the motion of objects through the recording of motion (video)
so that the parameters of position, speed parameters, acceleration, kinetic energy, potential energy and
other parameters owned by moving objects [7]. The use of tracker applications in learning and
optimization of experimental tools has been widely used, such as tracker utilization to determine the
acceleration of Earth's gravity through parabolic motion [8], determining fluid viscosity coefficient [9],
determining the gravitational acceleration anomaly of Earth due to solar eclipse [10,11] and analyzing
the leaf motion of the bauhinia purpurea leaf due to changes in the intensity of sunlight on eclipse
phenomena [12]. By using this software, the measurements of motion parameter in rectilinear motion
kinematics can be done with more precision and then students can obtain more accurate data.

2. Methods
In this study, the kinematical experiments of uniformly changing rectilinear motion was performed on
two sets of experimental tools that generally existed in schools, namely sets of dynamics train and set
of Atwood machine with schematics as shown in figure 1. The data acquisition process is done by two
methods of measurement, using conventional ruler, stopwatch and ticker timer, and using measurement
method with tracker application. Tracker is software to analyze video developed by Open Source
Physics (OSP) with Java framework [7]. The software tracks the motion of objects by identifying the
pixels of the specified area and analyzing the position of objects on each frame. To produce accurate
data requires a clear video recording.

                                                      2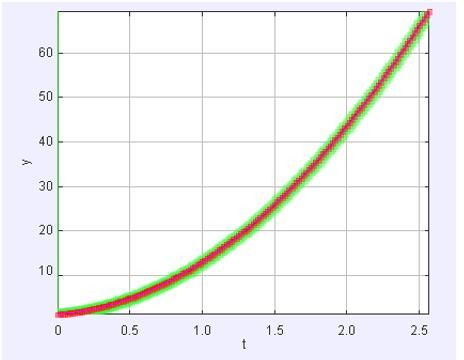
The 2nd Annual Applied Science and Engineering Conference (AASEC 2017)                     IOP Publishing
IOP Conf. Series: Materials Science and Engineering 288 (2018) 012096 doi:10.1088/1757-899X/288/1/012096
                                               1234567890‘’“”

                           a.                              b.

            Figure 1. Experiment apparatus scheme: a. Atwood machine; b. dynamics train

On the set of experimental Atwood machine (Figure 1a), the initial condition of M1 loads whose mass
is equal to M2 (72.26 grams) is held in the X position using a locking bolt. Then the M1 load is released
so that the load moves up and the load M2 which has been given an additional load m moves down
accelerated from position A to position B because the load M2 + m is greater than M1. The length of
the A-B path is measured using a ruler while travel time is measured using a stopwatch. In the set of the
dynamics train experiments (Figure 1b), experiments were performed by varying the mass of the
dynamics trains with a fixed angle of 5o. Ticker timer is connected to AC voltage source with frequency
50 Hz.
    For data processing using the tracker application, the movement of objects in both sets of experiments
is recorded using a high-resolution camera (high definition, HD) with a 24 frame / sec (24 fps) shooting
rate. To get a clear image of the object movement, a white board is used as the background of the
experimental set of tools. Results of data processing using tracker applications compared with the results
obtained using conventional methods to obtain information which data is more accurate and consistent.
This is done to get a better method in the acquisition and processing of experimental data so as to obtain
precise and accurate results.

3. Results and discussion
Based on the experimental results, obtained two types of data that is the video data for processing tracker
and conventional data in the form of distance, time, and paper tape result of ticker timer beat. An
example of the data obtained in the experiment is shown in figure 2.

                                                     3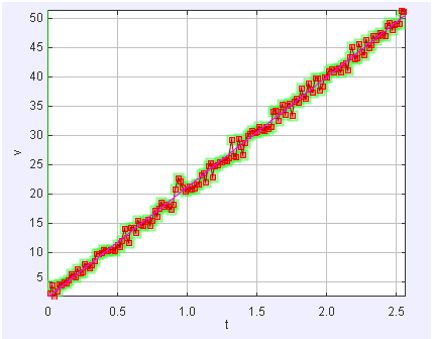
The 2nd Annual Applied Science and Engineering Conference (AASEC 2017)                     IOP Publishing
IOP Conf. Series: Materials Science and Engineering 288 (2018) 012096 doi:10.1088/1757-899X/288/1/012096
                                               1234567890‘’“”

                            a.                     b.                      c.

  Figure 2. Example of experiment result: a. tracker result on Atwood machine; b. tracker result on
                            dynamics train; c. ticker timer beat result

According to the data processing using the tracker application on the video of motion and the data using
conventional data processing, the graph of position-time function graph (s = f (t)), the velocity-time
function graph (v = f (t)) and the comparison table of motion acceleration as shown in figure 3 and table
1.

                                                    4
The 2nd Annual Applied Science and Engineering Conference (AASEC 2017) IOP Publishing
IOP Conf. Series: Materials Science and Engineering 288 (2018) 012096 doi:10.1088/1757-899X/288/1/012096
1234567890‘’“”
a. b.
c
Figure 3. Results of data processing using tracker: Atwood machine experiment: a. graph (v = f (t)); b.
graph (s = f (t)); and for the dynamics train experiment: c. graph (v = f (t))
Table 1. Comparison of object motion acceleration using tracker method and conventional method
Experiment Number of Acceleration (a) cm/s2
experiments Tracker conventional
Atwood machine 1 18,78 11,05
2 18,23 12,66
3 18,45 14,17
Dynamics train 1 60,67 50,00
2 60,15 53,93
3 59,90 53,69
Based on Figures 2 and 3 and Table 1, the parameters of motion of objects in both experiments are
performed. Figure 2a shows that the movement of objects on the A-B path in the experiment of the
Atwood machine has accelerated motion. This is shown from the change in the position which is
5The 2nd Annual Applied Science and Engineering Conference (AASEC 2017) IOP Publishing
IOP Conf. Series: Materials Science and Engineering 288 (2018) 012096 doi:10.1088/1757-899X/288/1/012096
1234567890‘’“”
enlarged at the same time and is also emphasized in Figures 3a and 3b which show that the velocity of
the object changes constantly with time and changes in the position of matter over time are changed
quadratically. This is quite easy to understand because as long as its motion path, the recorded M2 load
gets an additional load of m, so there is a force resultant on the system in the direction of M2 load
movement [13,14]. The same phenomenon is also obtained in the experiment using the set of dynamics
train, i.e. the object accelerated in its movement down the incline. This is evident in Figs. 2b, 2c, and 3c
which indicate the change in the position of the object and the change in the velocity of the object at any
time. The movement of an accelerated object as it descends the incline occurs because there is a resultant
gravitational force acting on a sloping object [13,14]. If we look again at the graph of Fig. 3, especially
the graph of time-varying velocity relation (v = f (t)) in Figures 3a and 3c, it is seen that the change in
velocity of the object occurs in a fluctuating manner but creates a straight-line tendency with a constant
slope. This fluctuating speed value occurs due to the limitations of the speed of the camera in recording
images every second (frame / second) of 24 fps, which means the camera takes 24 images in 1 second.
Thus, in order to record fast moving objects there will be recording images that are cut into pieces.
The interesting part of this research is the comparison of the consistency of the acceleration value of
the object motion using two measurement methods performed as shown in Table 1. Based on the results
of data processing using the application tracker, it is obtained that the acceleration value of experimental
motion of Atwood machine experiments and dynamics train experiments is more consistent compared
with the acceleration value of conventional data processing. For Atwood machine experiments, the
results of data processing using a tracker obtained a consistent motion acceleration at 18 cm / s2, in
contrast to conventional data processing results that accelerate motion values vary in the range 11 cm /
s2 - 14 cm / s2. Likewise, in experiments using dynamics train sets, data processing using a tracker
produces a constant motion acceleration value of 60 cm / s2, whereas with conventional methods the
acceleration value of motion is obtained in the range of 50 cm / s2 - 54 cm / s2. Several studies involving
motion measurements also show that tracker usage shows more accurate results [8,9]. The inconsistency
of the results obtained by using conventional methods is predicted to occur due to several factors, i.e.
less precise measuring instruments, errors during data retrieval, as well as the taping patterns seen on
tape paper are less clear, thus affecting the measurement of changes in the position of objects over time
which ultimately impact on value of other motion parameter.
4. Conclusion
Based on the results of research, measurement methods and data processing using the application of
tracker in kinematics experiments motion is able to produce more consistent and accurate data.
Utilization of tracker application can be one alternative to optimize experimental kinematics motion
straight so that resulted of finding of experiment that precise and accurate.
References
[1] Nugraha M G, Kaniawati I, Rusdiana D and Kirana K H 2016 Combination of inquiry learning
model and computer simulation to improve mastery concept and the correlation with critical
thinking skills (CTS) AIP Conference Proceedings 1708 1 070008
[2] Amien M 1987 Mengajarkan ilmu pengetahuan alam (IPA) dengan menggunakan metode
discovery dan inquiry Jakarta: Proyek Pengembangan Lembaga Pendidikan Tenaga
Kependidikan, Direktorat Jenderal Pendidikan Tinggi, Depdikbud
[3] Subiyanto 1998 Pendidikan Ilmu Pengetahuan Alam (Jakarta: Depdikbud)
[4] Nugraha M G and K H Kirana 2015 Profil Keterampilan Berpikir Kritis Mahasiswa Fisika Dalam
Perkuliahan Eksperimen Fisika Berbasis Problem Solving Seminar Nasional Fisika (SNF) 5
2339-0654
[5] Anderson J L and Barnett M 2013 Learning Physics with Digital Game Simulations in Middle
School Science Journal of Science Educucation and Technololgy 22 6 914
[6] Daton G S 2007 Kinematika Gerak Jakarta : Grasindo
[7] Douglas B and Wolfgang C Tracker 2012 http://www.opensourcephysics.org
6The 2nd Annual Applied Science and Engineering Conference (AASEC 2017) IOP Publishing
IOP Conf. Series: Materials Science and Engineering 288 (2018) 012096 doi:10.1088/1757-899X/288/1/012096
1234567890‘’“”
[8] Afifah N 015 Metode Sederhana Menentukan Percepatan Gravitasi Bumi Menggunakan Aplikasi
Tracker Pada Gerak Parabola Sebagai Media dalam Pembelajaran Fisika SMA Prosiding
Simposium Nasional Inovasi dan Pembelajaran Sains 305-308
[9] Marliani F 2015 Penerapan Analisis Video Tracker dalam Pembelajaran Fisika SMA Untuk
Menentukan Nilai Koefisien Viskositas Fluida Prosiding Simposium Nasional Inovasi dan
Pembelajaran Sains 333-336
[10] Sholihat F N 2016 Anomali Medan Gravitasi Permukaan (g) Akibat Gerhana Matahari Sebagian
(GMS) 9 Maret 2016 Menggunakan Analisis Tracker pada Kater’s Reversible Pendulum
Seminar Nasional Fisika (SNF) 5 2476-9398
[11] Setyadin A H 2016 Optimalisasi Bandul Matematis Menggunakan Tracker Dalam Penentuan
Perubahan Percepatan Gravitasi Permukaan Bumi (g) Akibat Gerhana Matahari Sebagian
(GMS) 9 Maret 2016 Seminar Nasional Fisika (SNF) 5 2476-9398
[12] Alyasyfi M N 2016 Pengaruh Perubahan Intensitas Cahaya Akibat Gerhana Matahari Sebagian
Terhadap Gerak Daun Bauhinia Purpurea Seminar Nasional Fisika (SNF) 5 2476-9398
[13] Tipler P A and Mosca G 2007 Physics for scientists and engineers Macmillan
[14] Giancoli D C 2001 Fisika edisi kelima jilid 1 Jakarta: Erlangga.
7You can also read