Insights from Analysis of Video Streaming Data to Improve Resource Management - arXiv
←
→
Page content transcription
If your browser does not render page correctly, please read the page content below
Insights from Analysis of Video Streaming Data to
                                                   Improve Resource Management
                                                                          Sabidur Rahman∗ , Hyunsu Mun† , Hyongjin Lee† ,
                                                                  Youngseok Lee∗† , Massimo Tornatore∗‡ , and Biswanath Mukherjee∗
                                                ∗ Universityof California, Davis, USA † Chungnam National University, Korea ‡ Politecnico di Milano, Italy
                                                  Email: {krahman, mtornatore, bmukherjee}@ucdavis.edu, {munhyunsu, hjlee201203399, lee}@cnu.ac.kr

                                           Abstract—Today a large portion of Internet traffic is video.      publicly available data from large video streaming services,
                                        Over The Top (OTT) service providers offer video streaming           this area of study lags behind compared to areas such as
                                        services by creating a large distributed cloud network on top of     analysis of mobile traffic patterns [4] and mobile application
                                        a physical infrastructure owned by multiple entities. Our study
                                        explores insights from video streaming activity by analyzing         usage [5]. To fill this void, our study reports insights from
                                        data collected from Korea’s largest OTT service provider. Our        a comprehensive nation-wide dataset including live channels
arXiv:1806.08516v2 [cs.NI] 6 Sep 2018

                                        analysis of nationwide data shows interesting characteristics        and video contents, traces collected over both wireless and
                                        of video streaming such as correlation between user profile          wired network, etc. Another unique feature of the data is
                                        information (e.g., age, sex) and viewing habits, viewing habits of   that it not only contains user’s viewing traces, content types
                                        users (when do the users watch? using which devices?), viewing
                                        patterns (early leaving viewer vs. steady viewer), etc. Video on     and identification in details, but also contains anonymized
                                        Demand (VoD) streaming involves costly (and often limited)           information such as user’s age group, device IP address,
                                        compute, storage, and network resources. Findings from our           device type, etc.
                                        study will be beneficial for OTTs, Content Delivery Networks            To the best of our knowledge, our study is the first to use
                                        (CDNs), Internet Service Providers (ISPs), and Carrier Network       big data analytics tools Apache Spark [6] and Zeppelin [7] to
                                        Operators, to improve their resource allocation and management
                                        techniques.                                                          analyze video streaming activity. The size and scale of data
                                           Index Terms—User behavior; video streaming; cloud network         used in our study required more than traditional analytics
                                        management; data analysis; Apache Spark.                             tools. To keep the analysis scalable for future studies and
                                                                                                             deployable in practical run-time scenarios, we have used big
                                                               I. I NTRODUCTION                              data analytics tools. The results from our analysis enable us
                                                                                                             to explore answers for the following questions:
                                           Internet users are using more and more Video on De-
                                                                                                                • Analysis of user profiles: Who is watching the videos?
                                        mand (VoD) applications such as Netflix, Amazon, YouTube,
                                                                                                                • Temporal patterns in viewing activity: When do users
                                        etc. Even traditional live television channels are now being
                                                                                                                   watch video?
                                        streamed by service providers such as Sling TV, DirectTV
                                                                                                                • Content-centric viewing patterns: Which contents are
                                        Now, etc. According to Cisco Visual Networking Index
                                                                                                                   popular? When are popular contents viewed?
                                        (VNI) [1] 80-90% of the traffic in 2021 will be video.
                                                                                                                • Video browsing behavior: How can we correctly classify
                                           VoD services require compute, storage, and network re-
                                                                                                                   video browsing behaviors (early leaving, steady viewer,
                                        sources which are costly and often limited. Hence, new effec-
                                                                                                                   etc.)?
                                        tive resource management methods are required to serve ever
                                                                                                                • User device: Which device(s) do users use to watch
                                        increasing video traffic. These methods should be scalable,
                                                                                                                   certain videos?
                                        adaptive, and aware of patterns related to user activity, spatio-
                                                                                                                The rest of this study is organized as follows. Section
                                        temporal variation of load, user profiles, devices used, etc.
                                                                                                             II provides a description of the dataset and methodology.
                                        Hence, understanding these patterns is very important for
                                                                                                             Section III describes how we use big-data analytics to an-
                                        resource management of carrier networks, DC networks, Con-
                                                                                                             swer questions that are important for infrastructure owners
                                        tent Delivery Networks (CDNs), Internet Service Providers
                                                                                                             and service providers. Section IV concludes the study and
                                        (ISPs), etc.
                                                                                                             indicates directions for future works.
                                           There have been a few prior works studying partial analysis
                                        of VoD services. For example, Ref. [2] analyzes user behavior                    II. DATASET A ND M ETHODOLOGY
                                        in VoD traffic, specially video watching sessions. The data          A. Description of Dataset
                                        analyzed in the study was collected before 2014 and uses
                                        Hadoop system to process the data. Ref. [3] investigates                Our study uses dataset collected from the largest OTT in
                                        characteristics of user behavior in mobile live streaming            Korea. This nationwide data was collected in 2017 and the
                                        systems. But the data only accounts for live contents and            results in our study are derived from 24-hour data collected
                                        mobile devices, hence it misses out on large portion of              from 3M subscribers on a weekday.
                                        contents and users. Due to privacy concerns, limitation of              The data considers 70 live channels, 7000 movies, and
                                                                                                             280,000 other VoD contents. The data trace was collected
                                                                                                             every 10 seconds. Tables I and II show sample data with
                                        978-1-5386-6831-3/18/$31.00 c 2018 IEEE                              explanation followed.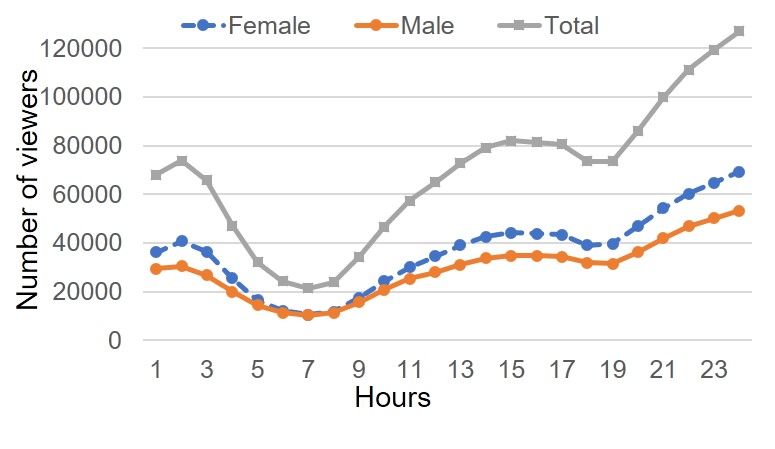
TABLE I: Sample data: viewing information.
U. P. M. age group 20 (31.09%). Such findings can help to understand
D H M S T. Dev. BR IP the distribution of users’ age groups.
ID ID T.
Andr.
d 10 01 10 a3 L A01 01:20 2 p
Ph. TABLE III: Age group analysis for viewers.
Andr. Age group Percentage
d 10 01 20 a3 L A01 01:30 2 p
Ph. Less than 10 0.001
Smrt. 10-19 2.48
d 10 01 20 a5 V A01 00:05 1 q
TV 20-29 31.09
30-39 39.54
40-49 17.16
In Table I, the first four columns (D, H, M, and S) displays 50-59 7.09
60-69 1.78
date, hour, minute, seconds of the trace. The fifth column con- Greater than 70 0.798
tains user identification (e.g., a3) which helps us to map the
viewing info with user profile from Table II. Sixth column (T) The gender breakdown of viewers is 53.54% female,
reports ‘the type of video content’: ‘L’ for live contents, ‘V’ 42.68% male and 3.78% others.
for non-live video contents. Seventh column (P.ID) contains
the content identification. Eighth column (M.T.) contains the B. Temporal patterns in viewing: When do users watch
media time inside the content where viewer is watching now. video?
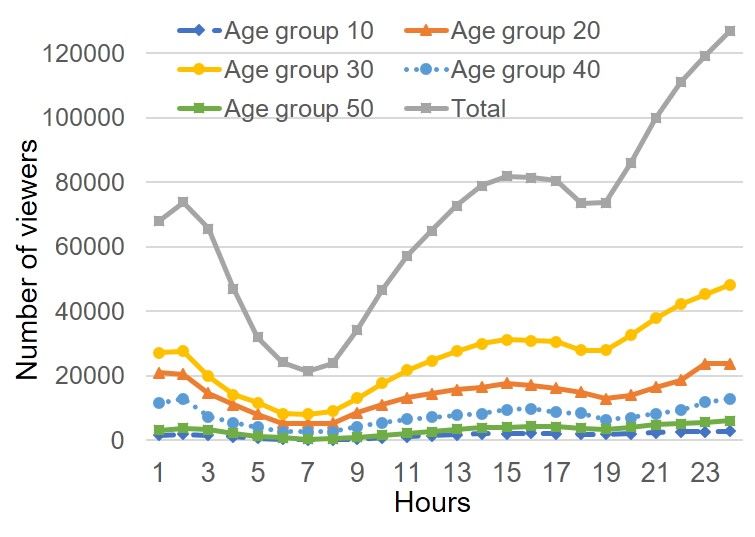
Ninth column (Dev.) contains the device type the viewer is 1) Impact of age: Fig. 1 shows the actual number of users
using. We have seven major types of devices in our study over 24 hours, distributed among different age groups. We
data: Android Phone, iOS Phone, Android Tablet, iOS Tablet, observe that Viewing activity increases as the day progresses,
PC, Smart TV, Chromecast. Tenth column (BR) contains the for all age groups. Also, viewing activity increases rapidly
‘bitrate’ requirement for the connection (‘2’ stands for 2 Kbps after 1900, one explanation of this can be: as more users come
and so on). Eleventh column (IP), contains the IP address back home, number of active viewers grows. In addition, users
(e.g., ‘p’) of the customer device with lower 16 bits hidden from age groups 20 and 30 dominate throughout the day.
(for example, ‘p’ = 192.168.*.*). This phenomenon can be explained by Table III, as we have
Table II contains user profile information such as gender observed the largest number of viewers come from age group
and age group of the user. This helps us to explore the impact 20 and 30.
of such information in viewing behavior and more.
TABLE II: Sample data: user profile information.
User Age
Gender
ID Group
a3 M 30
a5 F 20
B. Methodology and Analysis Environment
For big data analysis environment, we have used Apache
Spark 2.2.0 and Apache Zeppelin 0.7.3. Apache Spark is
an advanced analytics engine for large-scale data processing.
Apache Spark uses both batch and streaming data to gain
high performance. Ref. [6] reports hundred times faster
performance compared to Hadoop.
Traditional methods such as standard database queries and
Hadoop distributed processing can generate these results as
well, when there is no computation time constraints. But, Fig. 1: Actual number of active viewers over 24 hours, from different age
groups.
when we start applying this results in real-time, tools like
Apache Spark are a better option in terms of computation
2) Impact of gender: Fig. 2 shows the hourly user count
time and large-scale data handling.
over 24 hours, distributed among different genders. We ob-
III. F INDINGS AND R ESULTS : W HAT QUESTIONS CAN serve similar patterns as Fig. 1. Viewing activity increases as
DATA ANSWER ? the day progresses for both male and females. Contrary to
We study and analyze the data to understand the rela- popular beliefs, we observe more female viewers throughout
tionship between user activity and features such as time of the day. This phenomenon, again, can be explained by the
the day, users’ age, content type, device type, etc. From our fact that larger portion of the users are from female gender.
findings through data analysis, we report the following results.
C. Content-centric viewing patterns: Which contents are pop-
A. Analysis of user profiles: Who is watching the videos? ular? When are popular contents viewed?
Table III shows the breakdown of number of viewers (%) in Fig. 3 shows very interesting pattern in three different
different age groups. According to Table III maximum num- (types) of contents. Content relevant for “Kids” is popular
ber of users come from age group 30 (39.54%), followed by most of the active day-time and late at night. On the other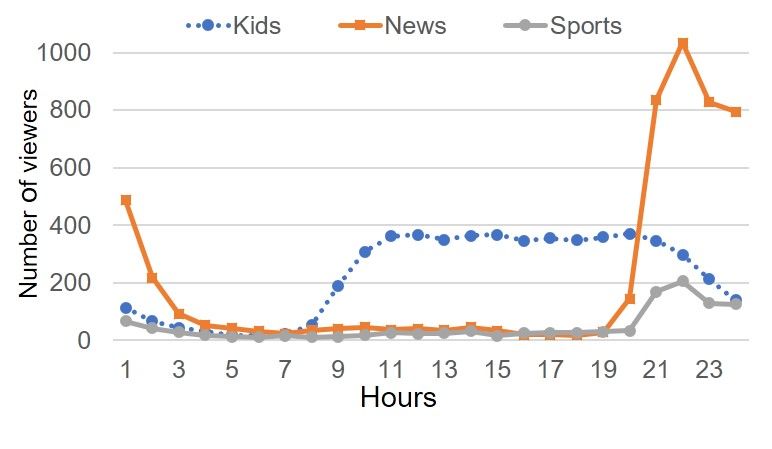
resource management methods should prepare the system to
                                                                             serve highlighters and surfing watchers, in addition to steady
                                                                             and early leaving viewers.
                                                                             E. User device: Which device(s) do users use to watch
                                                                             videos?
                                                                                From our analysis, the breakdown of the devices used for
                                                                             video streaming is as follows: ‘Android Phone’ leads with
                                                                             33.5%, followed by ‘PC’ 29.5% and ‘iOS Phone’ 16.6%.
                                                                             Rest of the devices are ‘iOS Tablet’ (9.6%), ‘Android Tablet’
                                                                             (5.1%), ‘Smart TV’ (5%), and others (0.7%). Content quality
                                                                             and content size (4K HD vs. 1080P) will change with the
 Fig. 2: Number of active viewers over 24 hours, from different genders.     device and screen size making the device type is an important
                                                                             parameter in content and network management problems.
                                                                                                      IV. C ONCLUSION
hand, news related content is popular only at night (1900-
2300) as the adult age group are actively viewing during that                   Our study presents an analysis of nationwide data collected
period. Similar pattern is also followed by “Sports”. Content                from Korea’s biggest OTT service provider. We use big
placement and network management methods unaware of                          data analytics tools (Apache Spark and Zeppelin) to analyze
such trends might make inaccurate decisions, leading to QoS                  the data. Our analysis shows interesting insights into user
violations and additional operational cost.                                  behavior and helps us to look for answers of important ques-
                                                                             tions related to video streaming. Future studies can use such
                                                                             understandings to develop network and content management
                                                                             methods which are more data-driven. Predicting future user
                                                                             behavior (steady viewer vs. early leaving) by learning from
                                                                             previous patterns is one interesting direction to explore.
                                                                                Acknowledgement
                                                                                Youngseok Lee was supported by Basic Science Research
                                                                             Program through the NRF of Korea funded by the Ministry of
                                                                             Education (NRF-2016R1D1A1A09916326) and by the MSIT
                                                                             of Korea under the ITRC support program (IITP-2018-2016-
                                                                             0-00304).
                                                                                                         R EFERENCES
                                                                             [1] “The Zettabyte Era: Trends and Analysis”, Cisco, [Online]. Available:
  Fig. 3: Viewing patterns for different types of contents, over 24 hours.       https://www.cisco.com/c/en/us/solutions/collateral/service-provider/
                                                                                 visual-networking-index-vni/vni-hyperconnectivity-wp.html.
                                                                                 [Accessed: April 06, 2018]
D. Video browsing behavior: How can we correctly classify                    [2] L. Chen, Y. Zhou, and D. M. Chiu. “A study of user behavior in online
video browsing behaviors?                                                        VoD services,” Computer Communications, vol. 46, pp. 66-75, 2014.
                                                                             [3] Z. Li, G. Xie, M. A. Kaafar, and K. Salamatian, “Characterizing
   One of the most interesting insights of our study is the                      and Modeling User Behavior in a Large-scale Mobile Live Streaming
viewer’s behavior during the viewing. After studying the                         System,” IEEE Trans. on Circuits and Sys. for Video Tech., 2016
                                                                             [4] F. Xu, Y. Li, H. Wang, P. Zhang, and D. Jin. “Understanding mobile
data, we have classified the viewer’s viewing pattern in the                     traffic patterns of large scale cellular towers in urban environment,”
following four categories:                                                       IEEE/ACM Trans. on Networking, vol. 25, no. 2, pp. 1147-61, 2017.
                                                          1                  [5] C. Marquez, M. Gramaglia, M. Fiore, A. Banchs, C. Ziemlicki, Z.
   • Early leaving: stops watching content in 5 minutes.
                                                                                 Smoreda. “Not All Apps Are Created Equal: Analysis of Spatiotempo-
   • Steady viewer: watches a single video for more than 5                       ral Heterogeneity in Nationwide Mobile Service Usage,” Proc. of 13th
     minutes.                                                                    International ACM Conference on Emerging Networking Experiments
                                                                                 and Technologies, 2017.
   • Highlighter: browses only the interesting parts of a
                                                                             [6] “Apache Spark”, Apache, [Online]. Available: https://spark.apache.org/.
     video.                                                                      [Accessed: March 12, 2018]
   • Surfing watcher: watches several videos within an hour.                 [7] “Apache Zeppelin”, Apache, [Online]. Avsilable: https://zeppelin.
                                                                                 apache.org/. [Accessed: March 12, 2018]
   Our data indicates that the viewers do not usually watch
the whole content. A large portion of them watches only the
interesting parts (highlighters are 56.44%), followed by the
steady viewers (25.74%). In addition, there is a significant
number of early leaving viewers (10.89%) too, who leaves
the system in less than 5 minutes. Surfing viewers, who watch
multiple contents within an hour consists of 7.0%. Hence,
  1 Prior study [2] examines the early-leaving viewer behavior and shows
why ‘5 minutes’ is a practical threshold.
You can also read