DIMENSIONS ANALYTICS - THE BASICS - Dimensions Analytics (April 2021)
←
→
Page content transcription
If your browser does not render page correctly, please read the page content below
DIMENSIONS ANALYTICS - THE BASICS

NAVIGATION OVERVIEW                                                            1

TYPES OF SEARCHES                                                              2

FILTERS                                                                        6
     Research Categorization Systems                                           6

RESULTS                                                                        8
     Sorting results                                                           10
     Exporting results                                                         13

ANALYTICAL VIEWS                                                               15
     Visualizations                                                            18
     Export options for Analytical views                                       20

FAVORITES                                                                      21
     Alerts                                                                    21

GROUPS                                                                         22
     Customizing pre-set groups                                                23

USER SETTINGS                                                                  24
     Connect your ORCID account                                                24
     Change currency                                                           24

Last updated: April, 2021
NAVIGATION OVERVIEW

The Dimensions platform is divided into three main sections, with a search bar at the top, as illustrated below. The primary sections are Filters,
Results (records), and Analytical Views.

                                                                                                                                                     1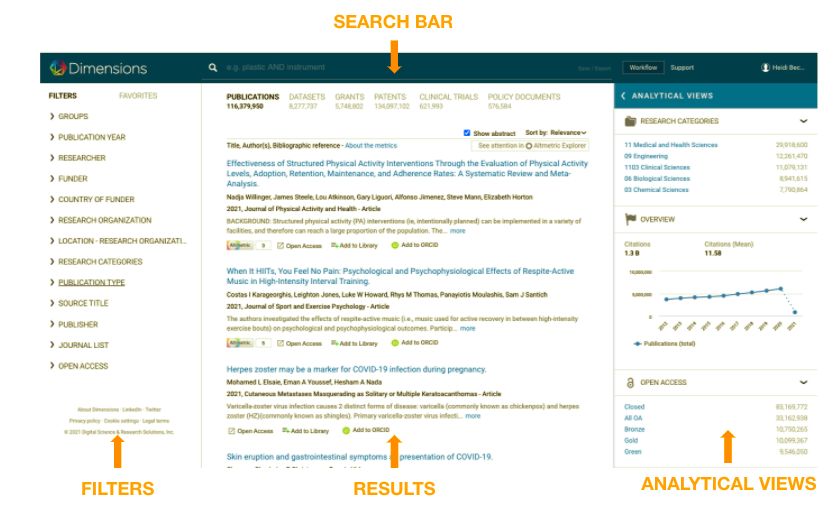
TYPES OF SEARCHES

There are a number of ways to search in Dimensions. Below is a brief summary of each.

Full data

       Our agreements with over 130 publishers means that Dimensions enables you to search the full text of roughly 70% of publications -
       even the ones you may not have full text access to. Whether you’re searching for a specific chemical or field-specific terminology -
       expand your search beyond title and abstract to return a broader set of results.

Title & Abstract

       This is just what it sounds like - limit your search to just the title and abstract available within Dimensions. This will generally give you a
       smaller set of results than a full data search, but likely very relevant.

                                                                                                                                                         2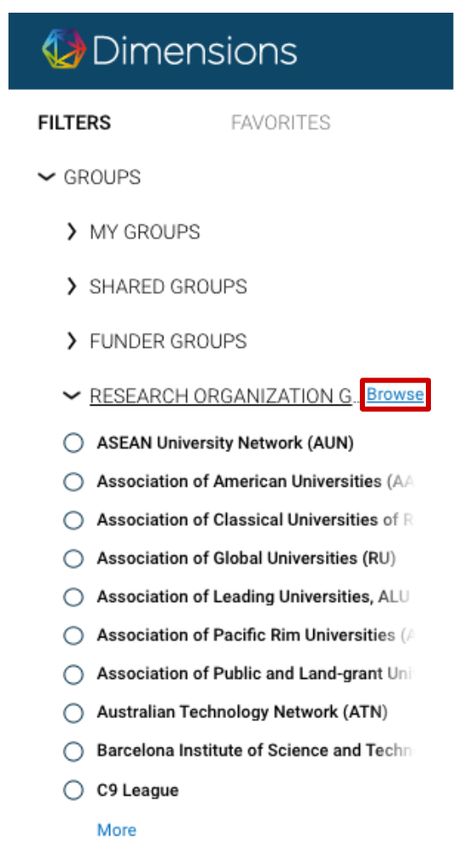
Abstract Search

       Using the Dimensions abstract search, you can enter a thesis statement or project summary (any “blob of text”) to find closely related
       content - Dimensions will extract terms from the text and search all content types simultaneously and return highly similar content. This
       is one of the most popular features in Dimensions. This type of search is recommended when the text is specific enough to yield
       meaningful results. Remember to press enter after pasting the text.

DOI Search (publications only)

       If you know exactly what you’re looking for, you can search for one or more DOIs. Enter a DOI (add a boolean OR to include additional
       DOIs), and select the DOI toggle button.

                                                                                                                                                   3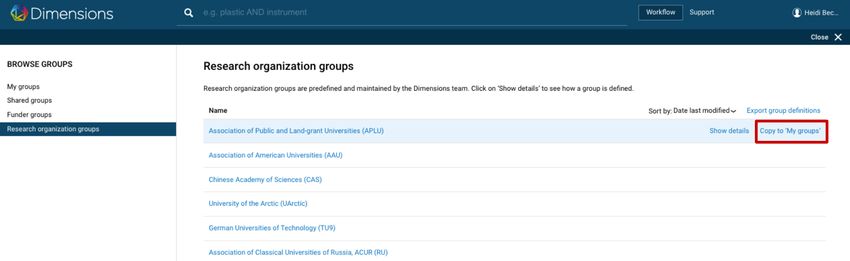
Advanced search with co-occurring concepts

                                             4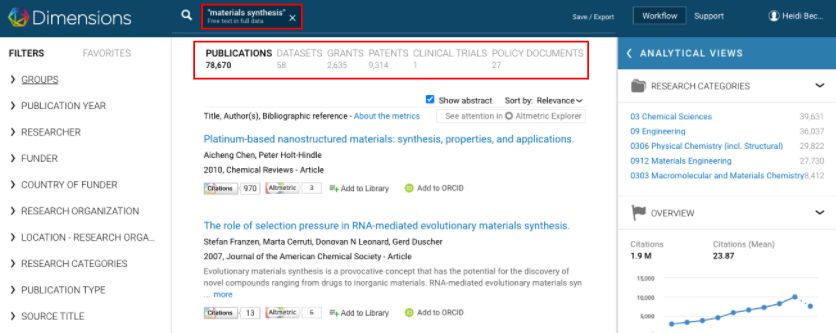
You can access a list of relevant concepts related to their current search to further refine a query: either to narrow down the results or to
broaden the search.
Open the search bar and click on “Advanced” - the panel can be entered from all content types
To calculate co-occurring concepts the user needs to provide at least one keyword or filter
The terms are always calculated based on publication results - We calculate n=20 concepts per default, more can be loaded on request
(click on “show more”), max 100
After adding / manipulating concepts, users can recalculate concepts (“Recalculate concepts” button). As for every other keyword
search, users can choose between searching in “full data” or “title & abstract.”
You can opt to either add the term with a Boolean AND, OR or NOT (drop down will appear when clicking “Add”)

You can also opt to add parentheses to create Boolean nesting.

                                                                                                                                            5
FILTERS

Filters should be considered similar to “advanced search” fields and should be the first stop in constructing a query that involves:
    ●   Date parameters
    ●   Researchers
    ●   Organizations (Funders, Universities, Companies, Publishers)
    ●   Places
    ●   Research categories (see below)
    ●   Status (eg. “active” in grants, “granted” in patents)

Entering these terms (eg. researcher name, organization name) into the search bar will not be as effective and will likely return some erroneous
results.

Filter options will differ by content type (eg. a publication record does not have an “active year” whereas a grant record will).

We recommend checking for applicable filters in relevant content types when constructing a query.

Research Categorization Systems

Fields of Research (FOR)
We have implemented the Fields of Research (FOR) system covering all areas of research from the Australian and New Zealand Standard
Research Classification (ANZSRC). The original FOR system has three levels (2-, 4- and 6-digit codes). The implementation in Dimensions
categorises on 2- and 4-digit codes. This categorization system covers many areas of research including social sciences, art and history.
Research, Condition, and Disease Categorization (RCDC)

The Research, Condition, and Disease Categorization (RCDC) is a classification scheme used by the US National Institutes of Health (NIH) for
reporting required by the US Congress. We have implemented this system using automated allocation of RCDC codes to documents in
Dimensions based on category definitions defined by machine learning. In addition to the semantic definitions, the NIH uses business rules to
assign awards to categories based on decisions rather than an analysis of the content and topic. These business rules are highly specific to the
NIH and have not been taken into account for Dimensions. Also, RCDC reports to the US congress take the specific aims section into account,
as well as the abstract. Using only the abstract and title for category definition, without the business rules or specific aims, allows a comparable
RCDC categorization within Dimensions.

                                                                                                                                                       6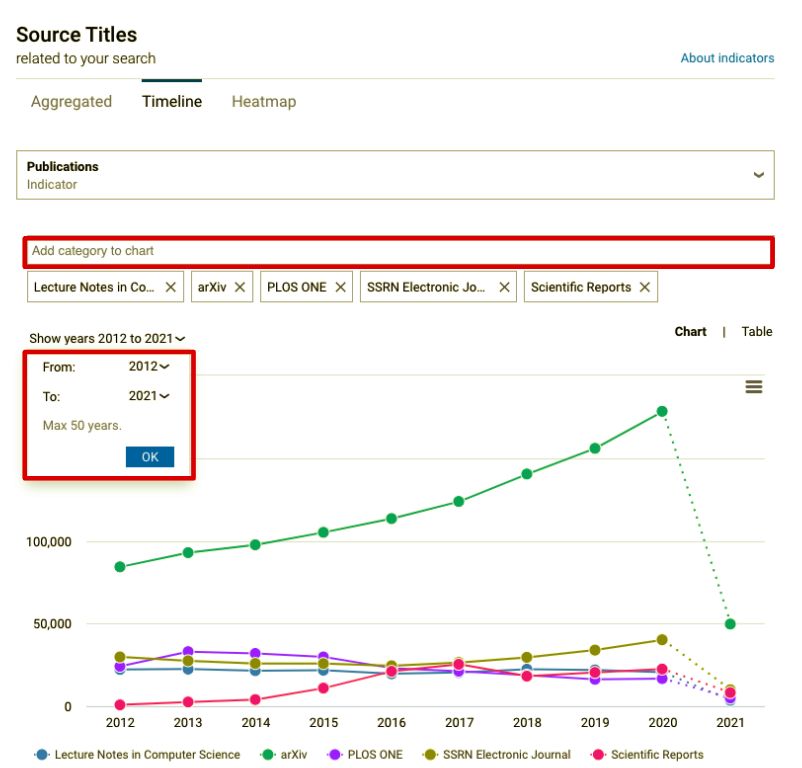
Health Research Classification System (HRCS) and Research Activity Codes (RAC)
The Health Research Classification System (HRCS) is a classification system used by biomedical funders to classify their portfolio in health and
research activity codes. There are two strands to HRCS – Research Activity Codes and Health Categories. We have modelled Health Categories
on a machine learning approach that are automatically applied to all data types, allowing broad analysis and comparison.

ICRP Cancer Types
The ICRP’s cancer type coding scheme complements the CSO and is linked to the International Classification of Diseases. Information about
the codes used can be found at ICRP https://www.icrpartnership-test.org/cancer-type-list. We have implemented this system using automated
allocation of ICRP cancer types to documents in Dimensions based on category definitions defined by machine learning.

ICRP Common Scientific Outline
The Common Scientific Outline or 'CSO' is a classification system organized into six broad areas of scientific interest in cancer research. The
CSO is complemented by a standard cancer type coding scheme. Together, these tools lay a framework to improve coordination among
research organizations, making it possible to compare and contrast the research portfolios of public, non-profit, and governmental research
agencies. The CSO is maintained by the International Cancer Research Partnership and further information on versions, using the CSO and
training guides can be accessed at ICRP https://www.icrpartnership.org/cso. We have implemented this system using automated allocation of
CSO codes to documents in Dimensions based on category definitions defined by machine learning.

Units of Assessment
The Units of Assessment (UoA) is a classification scheme used by the Research Excellence Framework 2021 (REF) for assessing the quality of
research in UK Higher Education Institutions. We have implemented this system using automated allocation of UoA codes to documents in
Dimensions based on category definitions defined by machine learning.

Sustainable Development Goals (publications and grants only)
We have implemented the UN Sustainable Development Goals ( SDGs) as a classification scheme covering areas of research associated with
one or more SDGs (the majority of the SDGs are interrelated). The scheme uses automated allocation of the 17 SDGs and their associated
targets and indicators to all fitting documents in Dimensions thereby addressing research areas aligned to the goals.

                                                                                                                                                  7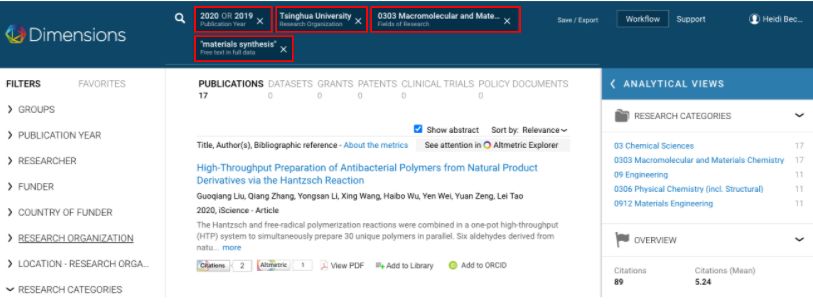
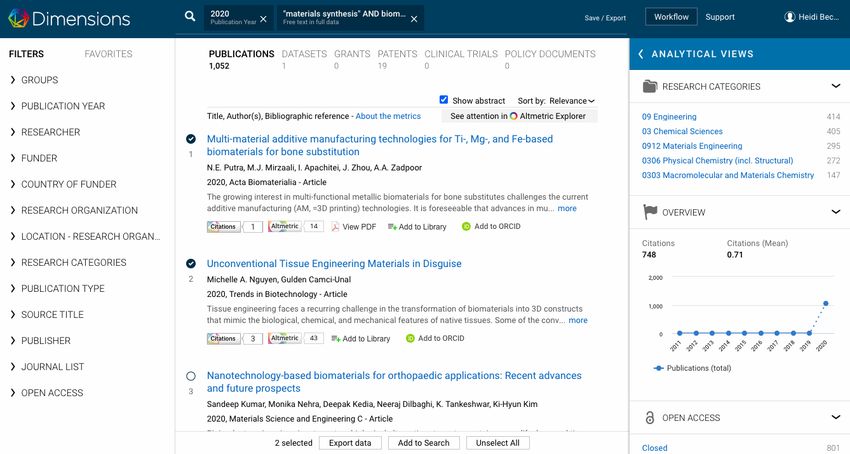
RESULTS

The middle panel in Dimensions will provide you with the resulting records from your query, across each content type as applicable.

Information on supported boolean operators can be found via the support portal.

                                                                                                                                      8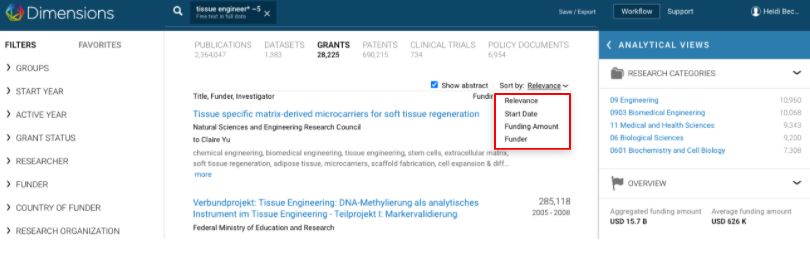
You can layer a
boolean search or
an abstract search
with filters:

If filters are applied
that are specific to a
certain content type
(eg. “Legal Status” in
patents), this will be
noted under the
other content types.

                         9
Sorting results
Results can be ordered in a number of ways:
Publications
Relevance
Publication date
RCR
FCR
Altmetric score
Datasets
Relevance
Publication date
10Grants
Relevance
Start date
Funding amount
Funder
Patents
Relevance
Filed date
Patent citations
Clinical trials
Relevance
Start year
11Policy
documents
Relevance
Publication date
12Exporting results
Results from each content type can be exported. Users are able to export metadata from records in each content type. Metadata included in
the export will vary based on content type and/or analytical view from which they were exported.
Individual records can be exported by hovering to the left of records and checking the items.
13You can also select individual records to create a new set of search results. See the bottom of your screen for both export and “add to search”
options.
Export options
Publications can be exported in three formats: .csv, .xlsx and .csv for bibliometric mapping. The bibliometric mapping export is compatible with
two free network mapping applications, Vosviewer and CiteSpace. Up to 500 publication records can be exported in either BibTex/RIS format.
All other content type results can be exported either to a .csv or .xlsx file.
You can locate your downloads by clicking on your name in the upper left corner of the screen and selecting Export Center.
14ANALYTICAL VIEWS
Analytical views provide high-level insights into your search results. Think of Analytical Views as a pivot table for the metadata in your result list.
These views provide instant insights into your results without any out-of-platform work required. In addition, you can export results from
analytical views just as you would your result set, but with more options to download, including available visualizations as images. While
available for all content types, some highlighted examples are shown below.
Publications
Here we can choose from a number of options, below is an example that surfaces the source titles with the most articles related to this search.
You can see other options including an OA overview, source titles, publishers, funders, research organizations and more.
15Grants
Similarly, we can move to another content type and avail ourselves of the aggregated data based on our search. What’s more, you can even
identify funding trends by funder, related to your search, with one click via the “open chart” hover-over link.
16The blue line plots the funder’s allocated budget over time; the green line shows their allocated amount relative to your search query.
By removing the overall budget line, you can see their funding related to your search query over time. Hovering over the dots on the timeline will
surface a link to those specific grants, should you wish to continue drilling into the data.
This is an easy way to get an at-a-glance view of funding trends in Dimensions by individual funding agencies.
17Visualizations
Timelines
Timelines are available in multiple places in Analytical Views. You can adjust the period of time it reflects, and add or remove elements shown
(eg. funders, research categories). You can also opt to view the data in a table by clicking near the top right of the timeline.
18Heatmaps
Similarly, heatmaps can be adjusted depending on what you’d like to see displayed.
Hovering over the numbers in the heatmap will surface a link to the relevant objects, again providing an easy way to drill down into your search
results.
19Export options for Analytical views
Aggregated Lists
You can select “export table” at the top right of aggregated lists in Analytical Views, and Dimensions will export the first 500 results into a .csv or
xlsx file, available to access in your export center.
Visualizations
Timelines and heatmaps can be exported in a
variety of formats, either as images or as data files
should you want to work with the data further.
Heatmaps are most readable in an image format
(versus platform view).
20FAVORITES
Any search in Dimensions can be saved as a favorite, with updated results each time you retrieve the favorite. Favorites can be accessed via the
left panel, next to Filters.
Alerts
Each time you “favorite” a search in Dimensions, you will have the option to be alerted on a weekly basis to new content matching the terms of
your search.
21GROUPS
Groups make it possible to combine multiple entities to a custom group with a custom name, which can
then be used in conjunction with other facets, groups or keywords. It allows you to create a group of
entities of the same type, for example a group of researchers (e.g. “department X”) or a group of
organizations (e.g. “peer Universities”). It is not possible to combine entities of different types (e.g.
funders and institutions) into a group.
Custom groups can be used in a search like any other entity - they can be combined with every other
facet or group, with every boolean keyword or abstract search.
To create a new group:
● Select several entities from one facet type (do not click on “limit to”).
● Click “Add to group” at the bottom of the page.
● Name and click “Save.”
The new group will now be available under “My groups” in the facet section.
Groups can be shared with fellow Analytics users across the same institution. More information on
sharing groups is available upon request.
22Customizing pre-set groups
You can also modify pre-set funder or research organization groups to suit your needs by “browsing” the groups and copying to my groups,
where you can then rename and add or remove elements (in the example below, research organizations):
23USER SETTINGS
Your account settings can be accessed by clicking on the icon next to your name in the
upper right corner of the platform. From here you can change your password and perform
other tasks.
Connect your ORCID account
You can connect your ORCID profile, enabling you to claim publications for your profile
with one easy click in the Dimensions platform.
Change currency
We obtain grant funding amounts in their original currencies. We then convert the original currencies in the background and the user can decide
in which currency they want to use in Dimensions. The conversion for each grant is based on the exchange rate at the time of the start date of
the grant. In the case that a yearly distribution of the funding amount is provided (e.g. NIH projects), the funding amount is converted for each
year's exchange rate. You can change the currency that appears in Dimensions. Currencies currently available in Dimensions include:
Australian Dollars (AUD) Japanese Yen (JPY)
British Pounds (GBP) Swiss Francs (CHF)
Canadian Dollars (CAD) New Zealand Dollars (NZD)
Chinese Yen (CNY) US Dollars (USD)
Euros (EUR)
24You can also read