Study of RBC histograms in various anemias: A six months prospective study - Perspectives in Medical Research
←
→
Page content transcription
If your browser does not render page correctly, please read the page content below
Original Article

Study of RBC histograms in various anemias: A six months
prospective study
Shifa Maqsood1, A Sharadrutha2
1
  Second year Postgraduate student, 2Professor, Department of Pathology, Prathima Institute of Medical Sciences, Nagunur,
Karimnagar, Telangana, India.
Address for correspondence: Dr. A.Sharadrutha, Professor, Department of Pathology, Prathima Institute of Medical Sciences,
Nagunur, Karimnagar, Telangana, India.
Email:drutha77@yahoo.com.

ABSTRACT                                                          curve, 1% showed bimodal curve. 2% cases of sickle cell anemia
                                                                  showed broad based curves with short peak.
Introduction: Complete blood count by automated
hematology analyzers and peripheral smear examination             Conclusion: Different patterns ofhistograms are obtained in
complement each other to provide a comprehensive report           different anemias. Histogram gives information about
on patient’s blood sample. Data displayed as visual image, can    abnormality of sample and need for follow up on peripheral
convey information with more impact than numbers. It helps        smear. Histograms can be useful to prioritize cases and help in
laboratory personnel to diagnose different anemias directly       speedy disposal of samples in laboratorybut will not identify
from automated hematology analyzer and correlate with             conditions like malarial parasites, membrane abnormalities
peripheral smear.                                                 that cause anemia.
Aims & Objectives: To know utility and advantage of red cell      Keywords: Histograms, anemias, automated hematology
histograms and to study automated histogram patterns in           analyzer.
various anemias.
                                                                  INTRODUCTION
Materials and Methods: This is prospective study conducted
                                                                           The well known coulter principle of counting and
from January 2017 to June 2017 in Prathima Institute of Medical
                                                                  sizing the cells provides basis of generating a histogram1,2. It
Sciences on 100 patients of >1year age who were anemic
                                                                  relies on change in conductance as each cell passes through
(Hb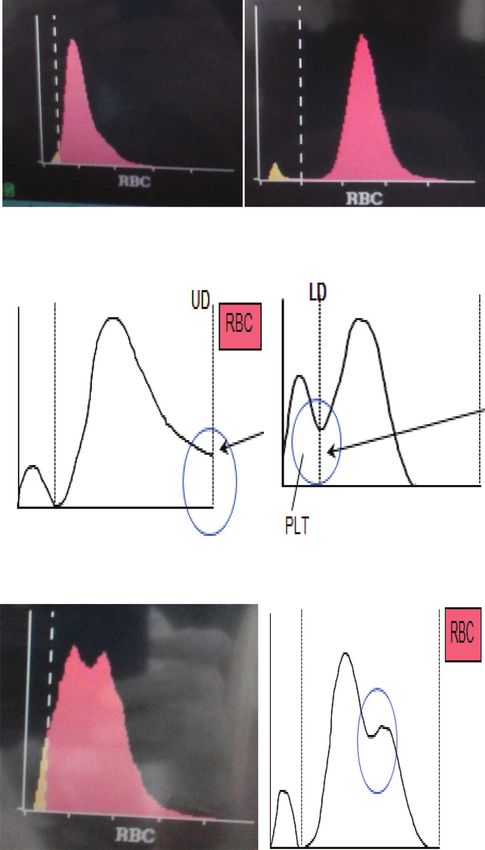
Shifa, et al

          Normalred cell histograms are symmetric, single-
peaked, and Guassian or “bell shaped”curves3 (Figure 1). The
distribution should always start and ends on base line and
should be located between the two discriminators3.
Following are the important points to consider when
reviewing/analyzing histograms
1.   Position of individual populations compared to normal/
     typical positions.
2.   Amount of separation between populations compared                FIGURE 2: MICROCYTIC RBCs FIGURE 3: MACROCYTIC RBCs
     to normal/typical separation.                                    SHOWING SHIFT TO LEFT     SHOWING SHIFT TO RIGHT

3.   Relative concentration of each population compared to
     normal/typical concentrations.
4.   Presence of unexpected or non-typical populations.
           When the distribution is not symmetric, it is referred
to as skewed2. In a normal RBC histogram, the majority of each
cell falls between 55 fL and 125 fL. The tail of the distribution
consists of coincident doublets and anomalous pulses2. The
RDW is calculated from the width of the histogram at 1 SD
from the mean divided by MCV. The normal RDW-CV is 11.5%
to 14.5%. The RDW-SD is the arithmetic width of the
distribution curve measured at the 20% frequency curve. The
normal RDW-SD is 39 to 47 fL2. Increased RDW shows a mild             FIGURE 4 : RU FLAG (Upper      FIGURE 5 : RL FLAG (Lower
broad base histogram4,5,6.                                            Discriminator Error)           Discriminator Error)

Causes of deviation from normal RBC histogram:
1.   Shift to left :If the cells are smaller than normal, the curve
     will be more to theleft (Figure2), as in untreated iron
     deficiency anemia.
2.   Shift to right: If the cells are larger than normal, the
     histogram curve will be more to right (Figure 3), as in
     megaloblastic anemia. After appropriate treatment of the
     underlying cause of an anemia, the curve should move
     toward the normal range2.
3.   RU Flag (Figure 4): When upper discriminator exceeds             FIGURE 6: RBC HISTOGRAM        FIGURE 7: RBC HISTOGRAM
     preset height by 5% RU flag is seen. Causes of RU                SHOWING MULTIPLE PEAKS         SHOWING RIGHT SHOULDER
     flagincludecold agglutination and Rouleax formation.
                                                                      MATERIALS AND METHODS
4.   RL Flag (Figure 5): When lower discriminator exceeds
     preset height by 10% RL flag is seen. Causes of RL flag             This is prospective study conducted in Prathima Institute
     includes Giant platelets, Micro-erythrocytes and                 of Medical Sciences on 100 patients of >1year age who were
     Fragmented RBCs.                                                 anemic (Hb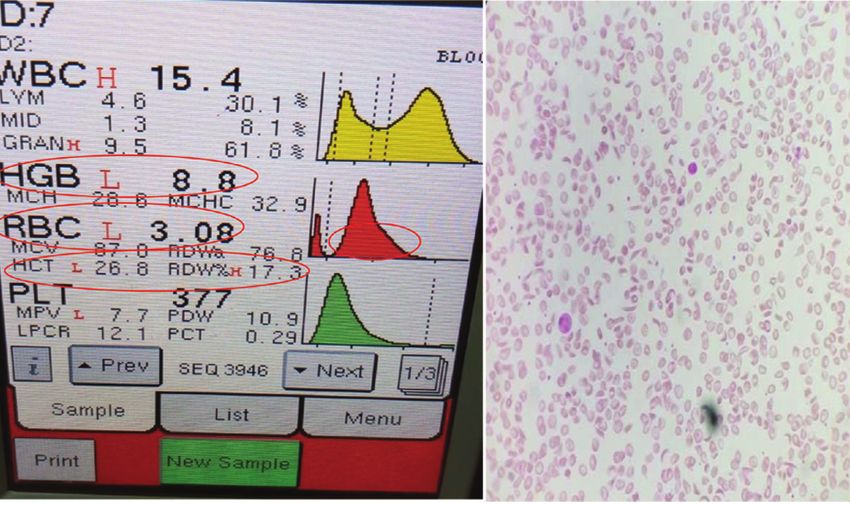
Shifa, et al
TABLE 1: DISTRIBUTION OF CASES BASED ON HEMOGLOBIN
PERCENTAGE.
DEGREE OF ANEMIA PERCENTAGE OF CASES
MILD 21%
MODERATE 60%
SEVERE 19%
TABLE 2: DISTRIBUTION OF CASES AS FOR PERIPHERAL SMEAR
DIAGNOSIS
Image 1: Rbc Histogram Showing Left Shiftand Peripheral
TYPES OF ANAEMIA PERCENTAGE OF CASES
Smear Of Microcytic Hypochromic Anemia (40x)
NORMOCYTIC 7%
MICROCYTIC HYPOCHROMIC 68%
MACROCYTIC 7%
DIMORPHIC 6%
PANCYTOPENIA 6%
THALASSEMIA 4%
SICKLE CELL ANEMIA 2%
FIGURE 8: PIE CHART REPRESENTATION OF TYPES OF
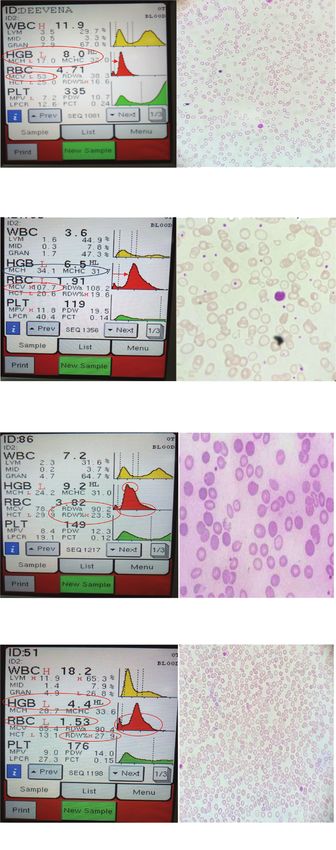
HISTOGRAM IN THE STUDY Image 2: Rbc Histogram Showing Right Shift And Peripheral
Smear Of Macrocytic Anemia (100x)
Image 3: Rbc Histogram Showing Double Peaksand Peripheral
Smear Of Dimorphic Anemia (100x)
Image 4: Rbc Histogram Not Starting At The Baseline And
Peripheral Smear Of Thalassemia (40x)
42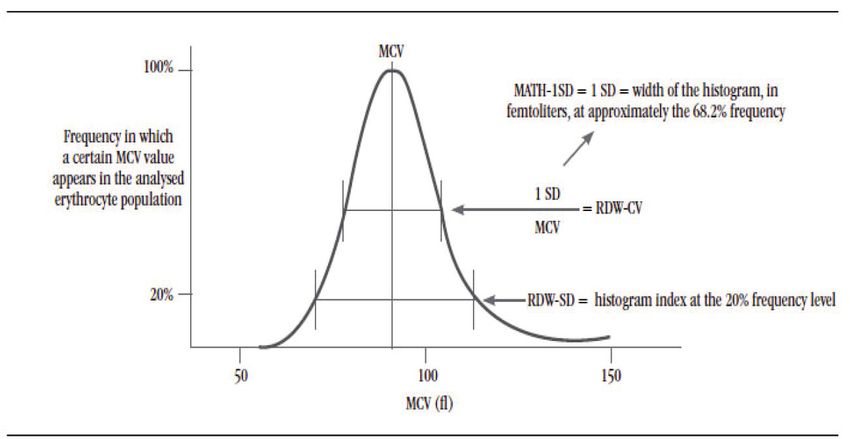
Shifa, et al

                                                                      ANALYSIS AND INTERPRETATIONS OF RBC HISTOGRAM:
                                                                              Homogenous population of RBC give narrow
                                                                      distribution curve while if more anisopoikilocytosis, then curve
                                                                      will be broad10. The curve is said to be symmetric if both sides
                                                                      of the curve coincide when folded in half or are mirror images
                                                                      to one another2.
                                                                             A histogram distribution that is bimodal can be seen in
                                                                      various situations, are usually associated with therapeutic
                                                                      transfusion and/or hematinic agent response to microcytic and
                                                                      macrocytic anemia, but they may also indicate other
                                                                      hematological disorders like cold agglutinin disease, in the
                                                                      presence of erythrocyte fragments, in IDA (microcytic) with
Image 5: Rbc Histogram Showing Short Peak, Broad Base And             recent blood transfusion, in sideroblastic anemia especially in
Peripheral Smear Of Sickle Cell Anemia (40x)                          acquired forms, and megaloblastic anemia (macrocytic anemia)
                                                                      with recent blood transfusion2,11.
A histogram can provide useful information for laboratories in:
                                                                      NORMOCYTIC ANEMIA: Out of the 7% of normocytic
1)   Monitoring the reliability of the results generated by the
                                                                      normochromic anemia 5% showed normal histogram with
     analyzer.
                                                                      short peak and 2% showed mild broad base curve histogram
2)   Investigating the potential cause(s) of the erroneous            correlating well with the increased RDW.
     automated results.
                                                                              The population of the cells would be variable in size.
3)   Arriving at the presumptive diagnosis E.g.; certain conditions   For example, some microcytic or small cells and some normal
     like the presence of fragmented red cell or red cell             size cells would result in a higher deviation and hence a higher
     agglutination that could not have been identified earlier        RDW.
     without blood film examination can now be presumably
                                                                      MICROCYTIC ANEMIA(Image 1): Out of the 68% of microcytic
     detected on the red cell histogram7.
                                                                      hypochromic anemia, 5% were normal histogram due to mild
Table 3: Histograms Variations In Various Anaemias                    anemia, 40% were left shift histogram, 21% were broad base
                                                                      curve histogram due to increase RDW and 2% with bimodal
                                                                      histogram, as here the patient was on treatment.
                                                                      MACROCYTIC ANEMIA(Image 2): Samples with macrocytic RBC
                                                                      generate histograms exhibiting a longer slope on the right 12.
                                                                             Among 7% cases of Macrocytic anemia 5% showed the
                                                                      right shift broad base curve histogram with 1% short peak
                                                                      histogram due to reduced RBC count and 1% bimodal curve as
                                                                      the patient was receiving treatment.
                                                                      DIMORPHIC ANEMIA(Image 3): In a dimorphic picture, the
DISCUSSION                                                            histogram may have two or more (multiple) red cell
                                                                      populations12.
       Histogram can be used for screening but not considered
diagnostic for any pathological condition6. A CBC report, if                 In our study Dimorphic anemia showed high
abnormal should always be correlated with clinical features           discrepencies between histogram curves and peripheral smear
and blood smear findings for meaningful conclusion3.                  examination. Out of 6% cases of dimorphic anemia 1% showed
                                                                      normal histogram, 1% showed broad base histogram, 1% right,
THE ERYTHROCYTE HISTOGRAM: The analyzer counts those                  1% left shift histogram and 2% showed bimodal curve 13-16.
cells as red cells, volume of which ranges between 36 fL and
360 fL3.Causes of lower discriminator flag include red cell           PANCYTOPENIA : Out of the 6% cases of the pancytopenia, 3%
fragments, microspherocytes, nucleated RBCs, nonlyzed RBCs,           were right shift curve due to severe megaloblastic anemia and
elliptocytosis, giant platelets, platelet clumpsand causes of         remaining 3% were short peak histogram correlating well with
upper discriminator flag are interfering substances such as           decreased RBC count 17.
cryoglobulin, cold agglutinin, and roulaex formation8. MCV is         THALASSEMIA(Image 4): Among 4% cases of thalassemia, 2%
perpendicular line from peak of curve to base9.                       showed abnormal histogram which was not starting at the

     43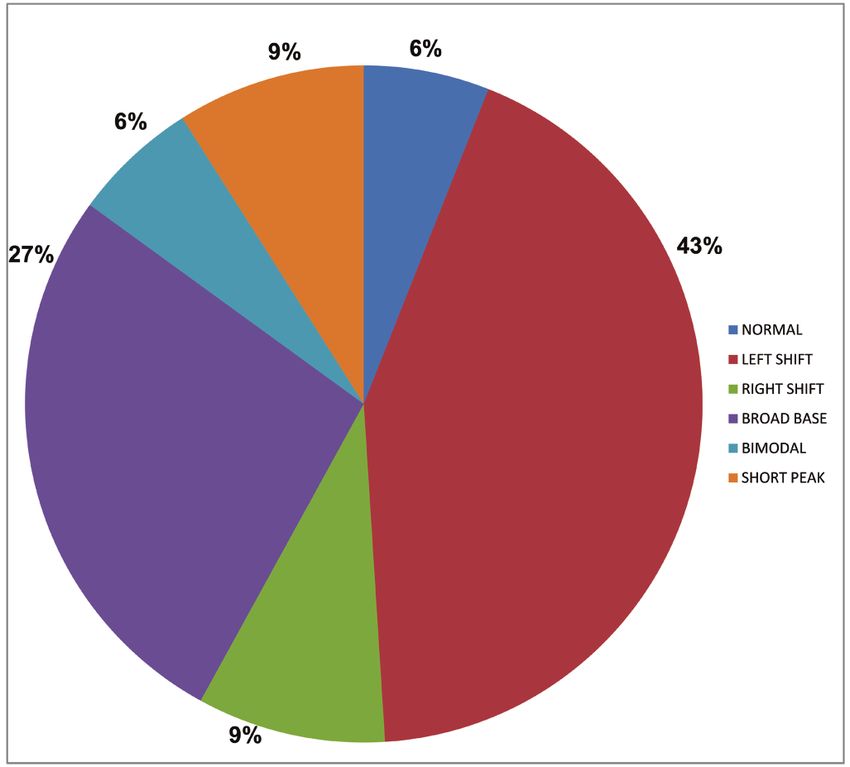
Shifa, et al

baseline with left shift, broad base curve, correlating well with    8.    E.T. Arun Thomas et al., Clinical Utility of Blood Cell
low MCV, MCH, HB and red cell count and increased RDW, 1%                  Histogram Interpretation. Journal of Clinical and
showed bimodal curve and peripheral smear also showed two                  Diagnostic Research. 2017 Sep, Vol-11(9): OE01-OE04.
populations of RBCs indicating that the patient had received
                                                                     9.    Van Hove L, T schisano, L Brace. Anaemia diagnosis,
recent blood transfusion 18,19. These results correlated well with
                                                                           classification and monitoring, using cell—Dyn technology
study conducted by Sandhya et al1.
                                                                           reviwed for the new millennium. Laboratory hematology
SICKLE CELL ANEMIA (Image 5): 2% cases of sickle cell anemia               6.93-108©2000.Carden Jennings publishing co. Ltd. L
showed broad based curve with short peak correlating well
                                                                     10.   Dr.Jitendra Chavda et al Departement of pathology,
with increased RDW and decreased RBC count20.
                                                                           Government medical college, Bhavnagar, Gujrat; RBC
CONCLUSION                                                                 Histogram as diagnostic tool in anemias; IOSR Journal of
                                                                           Dental and Medical Sciences 2015; Volume 14, Issue 10:
      Histogram can also be used in differentiating various
                                                                           PP 19-22.
types of anemia. Histogram changes correlated well with
peripheral smear findings in majority of the cases.                  11.    http://statlab.tumblr.com/post/18770587328/lab-test-
                                                                           cbc-histograms.
       Histogram analysis is often a neglected part of the
automated haemogram which if interpreted well, has                   12.   Interpretation of red blood cell rbc histograms.aspx .
significant potential to provide diagnostically relevant                   http://www.medialabinc.net/spg 579125/interpretation
information even before higher level investigations are                    of red blood cell rbchistograms.aspx.
ordered.The speed and the reliability of the modern analyzers
                                                                     13.   Munro BH. Statistical Methods for Health Care Research.
allow technologists, time to evaluate abnormal blood films,
                                                                           5th ed. New York, NY: Lippincott Williams and Wilkins;
consider diagnostic clues and correlate clinical findings to
                                                                           2005.
histograms and other hematologic parameters with greater
confidence and efficiency, all of which produce high returns in      14.   Gulati G L, Hyun B H: The automated CBC.A current
terms of patient health care.                                              perspective. Hematol Oncolcin North Am.1994; 8; 593-
                                                                           603. Medline Search Google Scholar.
References:
                                                                     15.   Bates I, Bain BJ, Lewis SM, eds. Dacie and Lewis Practical
1.    Sandhya I, Muhasin T. Study of RBC histogram in various
                                                                           Hematology. 9th ed. London: Churchill Livingstone; 2001:
      anemias. Journal of Evolution of Medical and Dental
                                                                           Basic hematological techniques. 19–46.
      Sciences 2014; Volume:3, Issue:74,; Page: 15521-15534.
                                                                     16.   Red cell distribution width (RDW). https://
2.    Benie T. Constantino, The Red Cell Histogram and The
                                                                           ahdc.vet.cornell.edu/clinpath/modules/hemogram/
      Dimorphic Red Cell Population, CML Healthcare Inc.,
                                                                           rdw.htm.
      Mississauga, Ontario, Canada, 2010.
                                                                     17.   Macrocytosis      -    Medscape         Reference
3.    Shirish M Kawthalkar, Essentials of Clinical Pathology.
                                                                           emedicine.medscape.com/article/203858-overview.
      Jaypee; Automation in hematology; First edition; 2012:
      Page 319-326.                                                  18.   Beckman Coulter LH 780 on line IB072841. Beckman
                                                                           Coulter Education Center, Miami Lakes, FL; 2007.
4.    Aroon Kamath M . Automated blood-cell analyzers. Can
      you count on them to countwell?. Doctor Lounge
      Website. Available at: http://www.doctorslounge.com/           19.   Dr. Tejender Singh. Atlas and text of Hematology. 3rd
      index.php/blogs/page/17172. September-13, 2012..                     Edition.Avichal Publishing company. 2014. Chapter 2,
5.    Dr.Poonam Radadiya et al. Automated red blood cell                   automaton in cell counts, hemoglobin estimation,
      analysis compared with routine red blood cell                        immunophenotyping. Page 54-56.
      morphology by smear review. NHL Journal of medical             20.   Coulter, WH.High speed automatic blood cell counter and
      sciences 2015; 4(1): 53-57.                                          cell size analyzer. Paper presented at National Electronics
6.    Wintrobe clinical hematology; Diagnosis and therapeutic              Conference, Chicago,1956; October 3.
      approach to hematologic problems; Lippincot Williams           How to cite this article : Shifa Maqsood, Sharadrutha A. Study
      and Wilkins; 12th edition; 2009; Volume 2 : Page 3-7.          of RBC histograms in various anemias: A six months prospective
7.    Williams LJ. Cell histograms: New trends in data               study. Perspectives in Medical Research 2019; 7(1):40-44.
      interpretation and classification. J Med Technol 1984;3        Sources of Support: Nil,Conflict of interest:None declared.
      Page:189-197.

     44
You can also read