MCLAREN VALE WINE REGION - SA WINEGRAPE CRUSH SURVEY 2020 REGIONAL SUMMARY REPORT - VINEHEALTH AUSTRALIA
←
→
Page content transcription
If your browser does not render page correctly, please read the page content below
SA Winegrape Crush
Survey 2020
Regional Summary
Report

McLaren Vale Wine
Region

Wine Australia July 2020
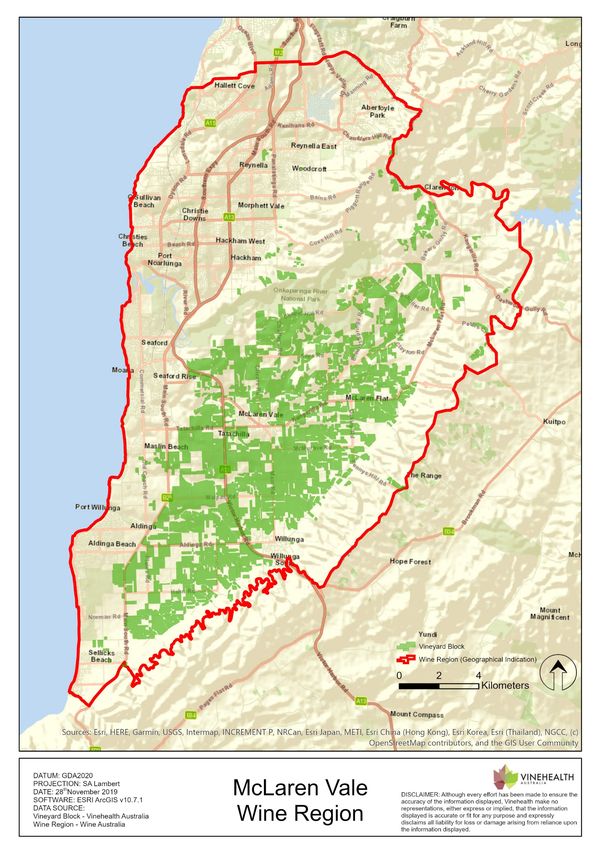
McLaren Vale
                                                                      Vintage overview

VINTAGE REPORT                                                                          OVERVIEW OF VINTAGE STATISTICS
The McLaren Vale Wine Region experienced a drier than average growing                   The reported crush of winegrapes from McLaren Vale was 28,751 tonnes in 2020,
season for the third year in a row. The continuation of dry conditions has              down by 13 per cent compared with the 2019 reported crush of 33,055 tonnes.
contributed to generally low yields across the region.                                  Over the past five years (up to 2019), the average crush for McLaren Vale has
                                                                                        been 36,590 tonnes, making this year’s crush 21 per cent below the five-year
Dry conditions during spring reduced the vigour of vines, while several days of
                                                                                        average. Compared with the other major regions in SA, McLaren Vale had a
very high winds in late November were seen to reduce the berry set of Cabernet
                                                                                        relatively small reduction and reported a larger crush than the Barossa Valley and
Sauvignon and Tempranillo which were flowering at the time.
                                                                                        Langhorne Creek for the first time since 2004, and was second largest region by
The summer of Vintage 2020 was a tale of two summers. Our “first” summer, the           volume in the state in 2020.
month of December, was the hottest on record.
                                                                                        There were 85 respondents to the survey who reported crushing grapes from
December’s hot weather had vines showing signs of water and heat stress much            McLaren Vale in 2020, compared with 84 in 2019.
earlier in the season than they would typically but also suppressed Powdery and
                                                                                        The total estimated value of winegrapes from McLaren Vale in 2020 was $56.5
Downy Mildew and there were very low levels of disease this vintage.
                                                                                        million compared with $59 million in 2019. The decrease in production was partly
Fortunately, to break the record hot weather, the northern Australian monsoon           offset by an overall increase in the average purchase value of grapes, which
season started at the start of January, and temperatures over southern Australia        increased by 10 per cent from $1771 per tonne in 2019 to $1951 per tonne.
dropped correspondingly. We had 13 consecutive days below 30°C from 15–27
                                                                                        There were increases in average prices for the three largest varieties: Shiraz up
January. This was the longest such run in January since 1992 and longest in
                                                                                        by 8 per cent to $2107 per tonne, Cabernet Sauvignon up 12 per cent to $1998
summer since December 2008. The mean average temperatures were 1.2 °C
                                                                                        per tonne and Grenache up by 16 per cent to $2156 per tonne. The average
below average.
                                                                                        value of Grenache was higher than Shiraz for the first time.
The start of February saw a monsoonal rain band move over South Australia and
                                                                                        The price dispersion data shows an upward shift in purchase prices, with 47 per
the McLaren Vale Wine Region experienced 20-30mm during three days of
                                                                                        cent of red grapes purchased at $2000 per tonne and above, compared with 26
thunderstorms. It was just enough summer rain to freshen up vineyards, without
                                                                                        per cent last year.
the unwanted side effect of berry splitting and then botrytis bunch rot.
                                                                                        According to Vinehealth Australia data, the total vineyard area in McLaren Vale
This trend of cooler weather continued through February and it proved much
                                                                                        as at 30 April 2020 is 7349 hectares, compared with 7337 hectares in 2019. The
cooler than average, with no maximum temperatures above 35°C for the first
                                                                                        total area is around 100 hectares less than it was 5 years ago.
time. February is “normally” the hottest month.
                                                                                        There were 55 hectares of new plantings (including top-working and
Grape picking took 5 weeks to complete starting at full pace in the first week of
                                                                                        replacements) in the 2019-20 planting season, the majority being Shiraz.
March and ending at the start of April. The report from winemakers on wine
quality has been good, with winemaking made easier by cool weather and lower
tonnages allowing for close attention at the winery.
James Hook, for McLaren Vale Grape, Wine and Tourism Association

 SA Winegrape Crush Survey 2020                                                     2                                                       Wine Australia July 2020
McLaren Vale
Winegrape intake summary table – red varieties
Price dispersion - number of tonnes in each price range
Total tonnes total value Average Change in Winery Share of Total Est total value
purchased $300 to $600 to $1500 to purchased purch. value
< $300 $2000+ price YoY grown fruit winery crushed ALL grapesMcLaren Vale
Winegrape intake summary table – white varieties
Price dispersion - number of tonnes in each price range
Total tonnes total value Average Change in Winery Share of Total Est total value
purchased $300 to $600 to $1500 to purchased purch. value price YoY grown fruit winery crushed ALL grapes
< $300 $2000+McLaren Vale
Historical weighted average price vs tonnes crushed
Average price
$ per tonne Shiraz Cabernet Sauvignon Chardonnay Tonnes crushed
2500 70,000
Grenache Tonnes crushed (RH axis)
60,000
2000
50,000
1500
40,000
30,000
1000
20,000
500
10,000
0 0
2005 2006 2007 2008 2009 2010 2011 2012 2013 2014 2015 2016 2017 2018 2019 2020
SA Winegrape Crush Survey 2020 5 Wine Australia July 2020McLaren Vale
Current plantings by variety and year planted
% planted
Variety Pre-2017 2017 2018 2019 Total area in 2019
Red winegrapes
Barbera 11 0 0 0 11 0%
Cabernet Franc 23 0 0 0 23 0%
Cabernet Sauvignon 1,311 25 12 13 1,361 1%
Grenache 444 5 4 2 455 0%
Mataro (Mourvedre) 88 3 0 0 91 0%
Merlot 189 0 0 0 189 0%
Petit Verdot 45 0 0 0 45 0%
Pinot Noir 47 0 0 0 47 0%
Sangiovese 43 0 0 0 43 0%
Shiraz 4,006 62 57 29 4,154 1%
Tempranillo 58 4 0 0 62 0%
Other Red 118 10 3 4 135 3%
Total red varieties 6,383 109 76 48 6,616 1%
White winegrapes
Chardonnay 281 0 2 0 283 0%
Chenin Blanc 15 0 0 0 15 0%
Marsanne 11 0 0 0 11 0%
Muscat A Petit Grains Blanc (White Frontignac) 10 0 0 0 10 0%
Pinot Gris 23 0 0 0 23 0%
Riesling 32 0 0 0 32 0%
Sauvignon Blanc 46 0 0 0 46 0%
Semillon 18 0 0 0 18 0%
Verdelho 14 0 0 0 14 0%
Vermentino 4 0 0 0 4 0%
Viognier 50 0 0 0 50 0%
Other White 43 2 0 7 52 13%
Total white varieties 547 2 2 7 558 1%
Rootstock Block 4 0 0 0 4 0%
Source:
Multi-purpose white 3 0 0 0 3 0%
Unknown variety 168 0 0 0 168 0%
Vinehealth
Total all varieties 7,105 111 78 55 7,349 1% Australia
SA Winegrape Crush Survey 2020 6 Wine Australia July 2020Explanations and definitions
INTAKE (CURRENT VINTAGE) DATA The calculated average purchase value per tonne is the average amount paid per
tonne of fruit across all wineries.
Definition of regions
Winery grown grapes are not included in the calculation of average purchase
Regions have been defined in accordance with Geographical Indication (GI)
value; nor are grapes grown by companies connected with the winery or under
boundaries. If a GI region has not been declared, or produces less than 5,000
lease arrangements.
tonnes, then the data is aggregated into the relevant GI zone. Disaggregation of
data into smaller regions such as Southern Fleurieu and Mount Benson is Average and total purchase values are not reported where there are fewer than
available on request from Wine Australia. three purchasers of a variety in a particular region. However the values are
included in the calculation of totals for each region.
Total crush
Important note on average purchase value
The total crushed is the total tonnes of grapes crushed from a particular source
region, whether processed in that region, another region in SA or interstate. All There is considerable variation in the pricing arrangements made by different
wineries in Australia are included in the survey collection process. However, not wineries. For example, some wineries make adjustment payments based on the
all wineries respond to the survey - therefore the total tonnage reported may average value per tonne reported in this survey and some pay quality bonuses
underestimate the true crush. It is estimated that the overall response rate for the based on the end use of the product. These additional payments are not included
survey is 88 per cent; however, individual regions may vary. Generally, regions in the reported figures. The average price also does not give any indication of the
will have a higher response rate when there is a high proportion of purchased distribution of prices, or variables that go into individual contracts.
winegrapes within the region.
Price dispersion data (shaded columns in Intake Summary tables)
Reported fruit is separated into fruit produced from the winery’s own or
All purchases for each variety are grouped into price segments according to the
associated vineyards (“own grown”) and from independent vineyards
price paid for that batch of fruit. The sum of tonnes in all the price segments may
(“purchased”).
not match the total tonnes purchased where there are tonnes reported without an
Calculated average purchase value associated price.
The survey requests wineries to provide the total amount paid for each parcel of Estimated total value of all grapes
fruit purchased (or the price per tonne). This is the price paid for fruit of a
The estimated total value of all grapes is calculated by multiplying the average
particular variety at the point of receival – not including specific amounts paid for
purchase value per tonne by all tonnes crushed. If there is a variety where there
freight. It includes any penalties or bonuses (eg Baumé) applied at the
are no purchases, then the average purchase value for the same variety across
weighbridge, but DOES NOT INCLUDE other bonuses or adjustments such as
similar regions, or across all other varieties of the same colour in the same region
end use quality bonuses, which are not available at the time the survey is
is used to determine an estimated value for the own grown grapes.
conducted (May-June 2020).
SA Winegrape Crush Survey 2020 7 Wine Australia July 2020Explanations and definitions - continued
PLANTING DATA
Source of planting data tables • Planting data tables are current as at 30 April 2020 and include all plantings
from the 2019–20 planting season.
Planting data is not collected by the Australian National Vintage Survey. The • Reference to “other varieties” includes rootstock, multi-purpose and table-
information is obtained from the vineyard register maintained by Vinehealth grape plantings.
Australia. • Vines planted in a particular year may include top-worked or replaced vines,
Vinehealth Australia is required under the Phylloxera and Grape Industry Act as well as new plantings in virgin ground. Where vines have been replaced or
1995 to maintain a complete and accurate register of vineyard owners in the topworked, the old variety record is removed. This explains why the area
state. Vineyard owners with plantings of 0.5 hectares or more are required to planted for earlier years may be different in the current report compared with
register with Vinehealth Australia, and provide details of any changes made to previous reports.
these vineyard plantings within three months of any such change. This • Where a zero (0) appears in a table, this may indicate the presence of a
information is kept strictly confidential and provided for this survey in a planting of less than 0.5 hectares, or it may indicate zero plantings. Rounding
deidentified and aggregated manner. may produce slight discrepancies in totals.
For more information on the planting data in this report or about registration of
vineyards, please contact the Vinehealth Australia office on (08) 8273 0550.
Explanatory notes for planting data tables
To protect confidentiality, the following rules are applied to reporting varieties:
• where there are fewer than 10 registered owners with plantings of a
particular variety across the state, that variety is not separately identified in
either the state or the regional reports but is grouped with “other
red/white”, AND
• where there are fewer than three registered owners with a particular grape
variety in a given region, that variety is not separately identified in the
regional report but is grouped with “other red/white” unless it is a white
variety listed in the top seven, or red variety in the top five by planted area
for the state for the current year.
.
SA Winegrape Crush Survey 2020 8 Wine Australia July 2020Acknowledgements
AUSTRALIAN NATIONAL VINTAGE SURVEY
Wine Australia is an Australian Commonwealth Government statutory authority,
The information for this report has been collected and analysed by Wine Australia as established under the Wine Australia Act 2013, and funded by grape growers and
part of the Australian National Vintage Survey. The SA Winegrape Crush Survey winemakers through levies and user-pays charges and the Australian Government,
Report has been prepared by Wine Australia on behalf of the South Australian Wine which provides matching funding for RDA investments and funds the ERWSP.
Industry Association, Wine Grape Growers South Australia and Primary Industries
and Regions SA.
Disclaimer
The survey publication is available on Wine Australia’s website wineaustralia.com, the
Vinehealth Australia website vinehealth.com.au and via links from the Wine Grape This information has been made available to assist on the understanding that Wine
Council SA website wgcsa.com.au and the South Australian Wine Industry Australia is not rendering professional advice. Wine Australia does not accept
Association website www.winesa.asn.au. responsibility for the results of any actions taken on the basis of the information
contained in this report, nor for the accuracy, currency or completeness of any material
Credits contained in it. Wine Australia expressly disclaims all and any liability and responsibility
Images – Wine Australia to any person in respect of consequences of anything done in respect of reliance,
GI maps – Vinehealth Australia whether wholly or in part, upon this report.
Note: data published in this report supercedes that in earlier reports. Minor variations in
reported figures can occur due to data revisions.
About Wine Australia
Any questions about the report should be directed to:
Wine Australia supports a competitive wine sector by investing in research,
Wine Australia Market Insights
development and adoption (RDA), growing domestic and international markets,
+61 8 8228 2000
protecting the reputation of Australian wine and administering the Export and Regional
Market.Insights@wineaustralia.com
Wine Support Package (ERWSP).
SA Winegrape Crush Survey 2020 9 Wine Australia July 2020You can also read