MULTI-BREED GENOMIC EVALUATIONS FOR 1 MILLION BEEF CATTLE IN IRELAND - A.R. CROMIE, R.D. EVANS, J F KEARNEY, M. MCCLURE, J. MCCARTHY AND D.P. BERRY
←
→
Page content transcription
If your browser does not render page correctly, please read the page content below
Multi-breed Genomic Evaluations for 1 million
            Beef Cattle in Ireland.

A.R. Cromie, R.D. Evans, J F Kearney, M. McClure, J. McCarthy and D.P. Berry
Overview of Talk.

• Challenges and Opportunities.
• Using to genomics/genetics to
  address GHG efficiency.
• The Irish Beef Data and Genomics
  Program.
  – Specific challenges being encountered.
• Summary.

                                             2
• Challenge 1;
  Feed 9 billion
  people by
  2050.

                   3
Challenge 2; Protect Climate &
        Environment.

                   • Ireland; To cut
                     carbon emissions
                     by 20%.
                     – Agriculture
                       currently
                       responsible for
                       almost 50% of
                       total GHG
                       emissions.

                                         4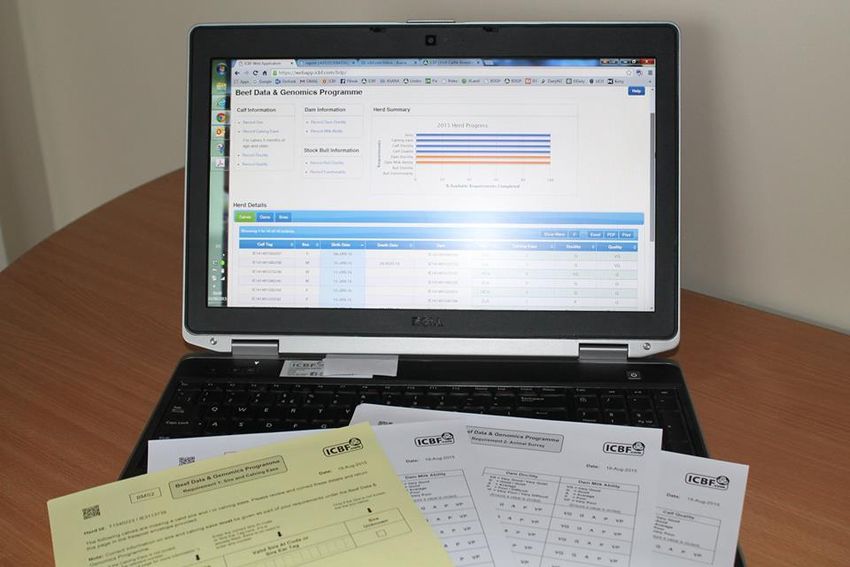
Challenge 3; The Beef Cow!

  FAO, 2013

                             5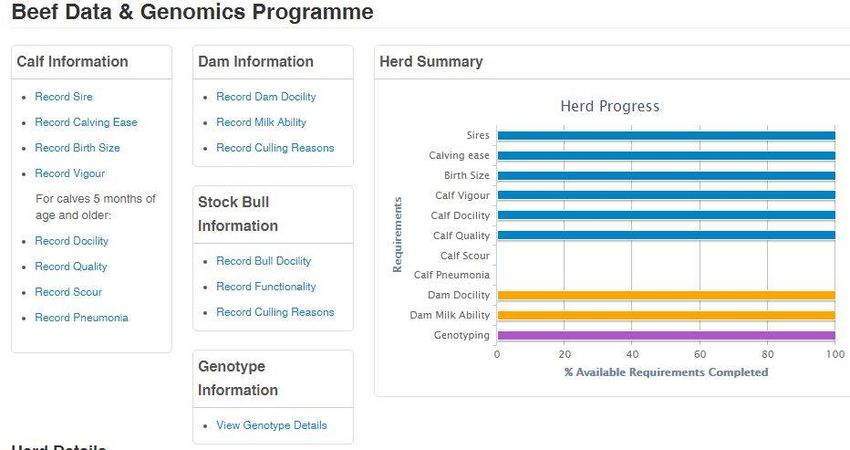
Challenge 4; Rural Infrastructure.
                • Suckler cows & beef cattle
                  are a key part of Irelands
                  rural infra-structure.
                   – Small fragmented farms,
                     marginal land etc.
                • “In the context of the food
                  versus climate challenge,
                  there is a requirement on
                  countries such as Ireland
                  to become even more
                  efficient in their beef
                  production”. Searchinger
                  2016.
                                                6
Opportunity; The Beef Cow!

              • Lots of variation in
                emissions intensity. Is
                there some genetic
                variation? Can we
                harness/improve?

  FAO, 2013

                                          7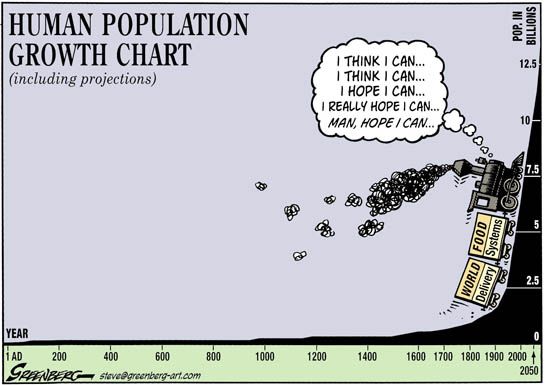
Genetic parameters in Australian Beef
Cattle (de Haas et al., JAM 2016)
Trait             σ2a         σ2p        MeP        RPM         RGM          DMI          WT
MeP              49.7       166.9         0.30        0.65        0.55        0.83        0.80
                                        (0.06)      (0.11)      (0.14)      (0.05)      (0.06)
RPM              12.9        84.7         0.71        0.19        0.98        0.04       -0.01
                                        (0.02)      (0.05)      (0.02)      (0.17)      (0.17)
RGM              11.8        96.7         0.62        0.94        0.15        0.00        0.00
                                        (0.02)      (0.00)      (0.05)      (0.18)      (0.18)
DMI               0.1          0.2        0.70        0.00       -0.10        0.39        0.98
                                        (0.02)      (0.04)      (0.03)      (0.06)      (0.01)
WT              415.4      1010.6         0.67        0.00        0.03        0.93        0.41
                                        (0.02)      (0.04)      (0.03)      (0.01)      (0.06)
* Heritabilities on diagonal, genetic correlations above diagonal, phenotypic correlations
below diagonal

• Session 50, today starting 14.00, Corallia Manzanilla-Pech.

                                                                         Animal Breeding &
                                                                          Genomics Centre8
Can we harness/improve?
                •
             • …..Genetics is not
                  seen as a
                  major
                  opportunity?
                • Why?

                                9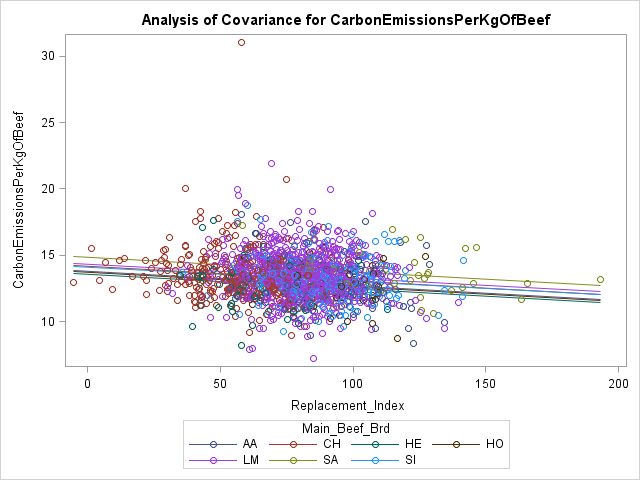
We are only now starting to focus
  on cost of production traits.

                                10
€uro-Star Replacement Index.
Trait Goal Relative wt
Calving Less 16%
Emphasis:
Feed Intake Less 18%
Carcass wt (forCow
age)traitsMore
71% 21%
Maternal milk More 18%
Calf traits 29%
Female fertility More 23%
Docility More 4%All Suckler Cows
Progeny Carcass
Cow Details Milk Performance Fertility Performance
Performance
Calf Age 1st Calving Carcass Age at
Star No. of Replacement % Still Cow Milk No. of Carcass
Weaning Calving Interval Weight Slaughter
Rating Cows Index Alive Score (1-5) Calvings Value
Weight (kg) (months) (days) (kg) (days)
33,493 €108 83% 336 4.08 30.2 403 2.69 358 €1,474 697
24,317 €76 80% 324 3.87 30.9 407 2.56 356 €1,469 712
21,644 €60 79% 319 3.74 31.3 411 2.47 356 €1,470 715
20,908 €43 76% 315 3.61 31.5 416 2.40 357 €1,475 721
23,911 €12 72% 309 3.36 32.1 423 2.25 357 €1,477 726
Difference -1.9 -20 0.44 -29
+€96 11% 27kg 0.72 0kg €-2
5 Star V's 1 Star months days calves days
Performance of all suckler females, born in 2011, when ranked on new genomic test proofsExpected Reductions in Emissions from
Genomics (Abacus Bio, NZ).
• Part 1. Impact of changes to the breeding program;
genomics, increased AI, more Irish bred animals
(Fiona Hely, EAAP 2016, Abs 1193).
– 4-fold increase in rates genetic gain => €20m/cow/yr.
• Part 2. System model developed to estimate kg CO2
emissions produced by average breeding cow
(Cheryl Quinton, ICAR Chile, 2016).
– Consequences of genetic gain on DMI for all traits in the
Replacement & Terminal Indexes => Emissions.
– Estimated reduction -0.009kg CO2/kg meat per breeding
cow per year for a €1 increase in replacement indexChanges in Emissions from Selection on Replacement Index; Key Traits.
Validation; High Genetic Merit Herds
     are More Carbon Efficient*
                      • * Herd Carbon data
                        provided from Bord Bia
                        Carbon Navigator
                        program.
                      • Outcomes from system
                        model (Quinton et al) and
                        validation work were
                        same. Phew!

                        *Breeds with at least 40 herds in data set
Results; Expected Reductions in
Emissions from Genetics/genomics.
2020 2030
% % % %
Suckler beef breeding kT of kT of
reduction reduction reduction reduction
strategy CO2e CO2e
Agri All Agri All
Current replacement
-66.14 0.4% 0.2% -529.1 2.8% 1.2%
index trend
Genomics with increased
-261.56 1.4% 0.6% -1,442.1 7.8% 3.3%
Gene Ireland AI
Genomics with best case
-385.02 2.1% 0.9% -2,270.2 12.2% 5.2%
Gene Ireland AI
• Genomics, including improvements to the breeding
program (more AI & G€N€ IR€) has potential to increase
rates of genetic gain by 400% (Hely, EAAP 2016).
• If we can achieve this rate of gain, then
genetics/genomics can reduce KT CO2e by 5.2% (IRE).The Irish Beef Data and
Genomics Program
• Focused on breeding more profitable ,
sustainable and carbon efficient cows.
• Funded from EU Rural Development Program.
– Under article 28 (Climate + Environment).
– Co-funded by Irish government (DAFM).
• €300m total funding 6 years (2015-2020)
– Farmers paid ~€90/cow/year to complete key
actions re: the scheme.
– ~500k animals genotyped to-date. ~2.5m animals
will be genotyped during period of scheme.
17Key Project partners.
• DAFM/EU; Scheme “owners” and
responsible for scheme delivery.
• ICBF; Data collection, genotyping, delivery
of genetic/genomic evaluations & reports.
– Role of Scientific Advisory Committee (Amer,
Garrick, Mantysaari, Meuwissen & Veerkamp).
• Teagasc; Research, extension & training.
• Illumina; Delivery of IDB 54k cust chip.
• Weatherby’s/Eurofins; Lab services.
• Bord Bia; Carbon Navigator.
18Key Actions; Tagging
• Started with tagging cows (for reference population),
now moving more toward female calves => potential
female replacements.
• Pedigree males prioritised.
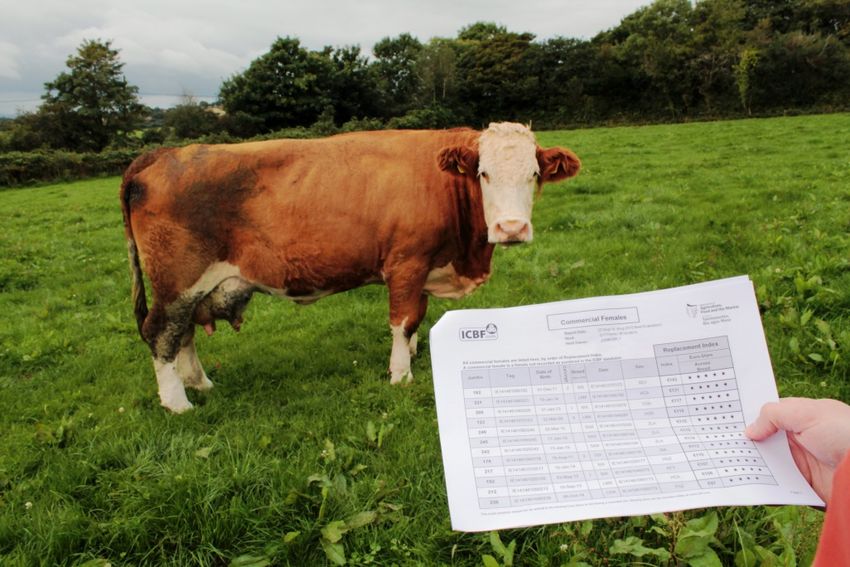
19Key Actions; Data Recording
• Farmers receive forms regularly re: data recording
(including any animals that are missing data).
• Paper based and electronic recording.
20Key Actions; Data recording
Very good h2 estimates for farmer
recorded traits, e.g., 0.25 for cow milk
score with an rg of 0.8 with maternal
weaning weight 21Key Actions; % 4 & 5 star
females.
Farmers must have a minimum of 20% of breeding females as 4
or 5 stars by 2018 and 50% by 2020.
At least one breeding male must be 4 or 5 star by 2019.
22Evolution of ICBF Beef Evaluations.
Within Across New 39 million pedigrees
breed breed. fertility and Calving 10m recs
muscle and New cow milk- Live-weight 4m recs
skeletal for calving ability Calf Quality 2m recs
LM, CH, SI (200k recs) evaluations Carcass 7m recs
(40k) and carcass First Fertility 4m recs
evaluations overall beef 50,000 foreign ebvs
(100k recs) profit
530,000 genotypes
indexesRange of breeds & cross-breeds.
• 533,093 animals
with genotypes.
• 30 different breeds.
• 791 different sire
breed * dam breed
combinations.
• ~68% of data is from
cross-bred animals.
24Approach to Genomic Evaluations.
• Two step (SNP BLUP with blending) applied
successfully in dairy cattle since 2009.
• Mix99 software used (Luke, Finland).
• Preference to use Single Step (SS) GBLUP.
– Multiple breeds including cross-breds, cows & calves.
• “Hard” deadline of August 2016 for delivery of
“official” genomic evaluations.
• After ~12 months intensive R&D, took a decision in
May 2016 to proceed with 2-step, NOT 1-step.
• Farmers needed proofs to make decisions ahead
of 2018 and 2020 replacement deadlines.
25Experience with ssGBLUP.
• Existing evaluations were developed to utilise all
available data.
– Beef performance evaluation was a 29 trait
model with 7m records, to predict 6 goal traits.
– Models needed to be simplified to incorporate
genomics.
• Some traits were not converging as well as others,
e.g. cow survival & maternal weaning weight.
• Computer resource quickly became a problem
– RAM (Random Access Memory) to create H-Inv
– Hard disk space: huge temporary files
26Solutions investigated.
• Short term.
– Purchase more computer resource.
• Running SSGBLUP with up to 200k genotyped animals.
Needed 500k. Considered splitting evaluation into
multiple runs with core group of genotypes in each
run. NOT a satisfactory technical solution.
• Medium to long term
– Use the SAC to investigate other options.
• LUKE: Application of APY method.
• WUR and Iowa State University: Variations of Single
Step Bayesian Regression.
• NMBU: ssGBLUP by genotype imputation.
27Computer requirements for ICBF
evaluations Cerus x 2
Ram 6,000 GB
Disk 40,000 GB
I phone 5
1 GB RAM lgen2
Ram 760 GB
198 Disk 4,000 GB
Ram 356 GB
Disk 1,500 GB
151
Ram 120GB
143 Disk 1,800GB
109 Ram 64GB
163 Ram 16GB Disk 698GB
Ram 2GB Disk 279GB
Disk 80GB2-Step Genomic Evaluation
Univariate IDB Genotypes
Deregression
evaluations
n = 16 goal traits Impute to 50k
SNP
BLUP
7 conventional multi-trait Direct PA from subset of
evaluations Genomic genotyped ancestors
63 traits Value using traditional
relationships
Blending by selection index
GEBVs
(Van Raden et al. 2009)
Official from Aug 2016
29Validation; Docility as an example.
• Based on 48k animals with phenotypes &
genotypes from more recent years.
• Regression of phenotype on different evaluations.
– “Single trait” conventional evaluation = 0.62 (0.03).
– Direct Genomic Value = 0.77 (0.03).
– “Blended” genomic/genetic evaluation = 0.86 (0.03).
• Genomics is moving us in right direction.
• Should we derive genomic predictions from
univariate or multivariate analysis?
– “True” biological trait, versus the benefits of predictors.
• Using validation to inform switch to SS GBLUP.
30Can we use information from one
breed to predict another breed?
• “Test” evaluations based Carcass Calving
on 218k in SNP BLUP (all Breed Calving Docility Weight Interval
breeds + cross-breds). Angus 0.95 0.89 0.95 0.98
Charolais 0.99 0.94 0.98 0.99
• Drop all LM animals from Hereford 0.95 0.94 0.94 0.96
the “Test” evaluation => Simmental 0.96 0.94 0.97 0.98
100k in SNP BLUP. Limousin 0.33 0.25 0.47 0.27
• Correlate the DGV’s => • Evidence that we can use
Correlation with remaining one breed to predict a
breeds? second breed.
• Correlation with pure-bred – ~10-15% genes in common
LM breed (28k animals)?? across main cattle breeds.
31Parentage Optimise management
assignment
Traceability Increase accuracy
of genetic
Based on a largeevaluations
database of genotyped
Mating animals Breed
advice composition
Inbreeding Lack of strong data to support
Monitoring lethal
GHG mitigation
Monitoring major strategies;
genes
animal, herd, environment =>
genes
animal breeders.5. Conclusions.
• Genomics/genetics can contribute positively to
profitability and GHG efficiency.
– A significant “tool in the box” to address GHG mitigation.
• At present, 2-step methods are best to deliver a
stable genomic evaluation service.
– 1-step methods are better. How soon? The focus of the
remainder of this session and others during EAAP.
• The BDGP has had a huge impact on the
uptake/interest in genetic gain in Ireland.
• Strongly encourage ALL other countries to consider
such programs for their countries, e.g., future RDP’s.
– Will help address GHG, but many other long term benefits.
33We can use Genomics to
address GHG efficiency.
• …..
Genomics
34Acknowledgement.
• Irish Department of Agriculture, Food and
Marine (DAFM) & EU for the “Beef Data and
Genomics Program”.
– For more information, please see ICBF and DAFM
websites.
– Contact myself acromie@icbf.com.
• All partners involved in the Irish Beef Data
and Genomics Project.
35You can also read