Developing a Spatial Risk Profile: Assessing Building Vulnerability to Extreme Coastal Inundation Hazard - by Dr. Lauren Williams 15 April 2021 ...
←
→
Page content transcription
If your browser does not render page correctly, please read the page content below
Developing a Spatial Risk Profile: Assessing
 Building Vulnerability to Extreme Coastal
 Inundation Hazard

 by
 Dr. Lauren Williams

 15 April 2021

Supervisor: Dr. Melanie Lück-Vogel Co-supervisor: Dr. Robyn Pharoah
Background
 Atmospheric processes
 The coast is a dynamic space
your knowledge partner

 Ocean processes

 Developments

 Coastal processes

 Natural environment 2
Background
your knowledge partner

 Source: UN/CRED (2019) 3
Real world problem • Coastal inundation is regarded as one of the most dangerous, harmful and your knowledge partner destructive natural hazards (Douben 2006; Balica 2012; Williams & Lück-Vogel 2020). • Coastal developments continue to proliferate. • Number of buildings along the coast has doubled 2011 – 2016 (CSIR 2019). • The absence of adequate spatially explicit assessments indicating risk at local level, particularly in developing countries (Appelquist, Balstrøm & Kirsten 2016). The demand for reliable data and information is becoming increasingly important to manage these risks (Doukakis 2005; Eurostat 2018; IPCC 2019). 4
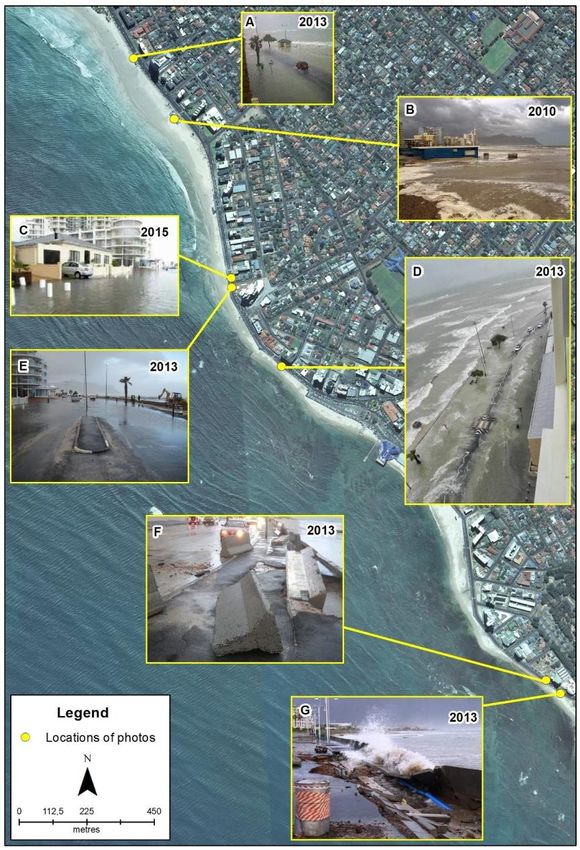
Inundation impact on South Africa’s coast

 Supermoon event
your knowledge partner

 (2016), coinciding
 with a spring tide

 5
Available solutions

 National Oceans and Coastal
 Information Management
your knowledge partner

 System (OCIMS)
 – www.ocims.gov.za

 To make information
 accessible to inform decisions

 6
Available solutions: GIS
 https://www.ocims.gov.za/coastal-flood-hazard-tool/

 Disadvantages of the
your knowledge partner

 Bathtub model:
 - Simplistic model
 - Hydrological
 disconnect
 - Overestimation of
 inundated areas
 - Excludes tidal and
 atmospheric forces

 7
Available solutions: Numerical modelling

 Disadvantages: Numerical modelling software:
 - Data hungry
your knowledge partner

 - Computationally expensive
 - Too coarse for local applications
 - Specialised

 CSIR (2016)
 http://marine.weathersa.co.za/ 8
Available solutions

 Comprehensive Spatial Risk
your knowledge partner

 Profiles

 Disadvantage:
 - Do not adequately capture localised
 events
 - Coastal processes are lost

 Map credit: Western Cape Government: Disaster
 Management 9
Research gaps

 There is a need for:
your knowledge partner

 1. An inundation model that is not too
 sophisticated, nor too simplistic and
 able to provide information at a
 local level

 2. A locally relevant building
 vulnerability assessment framework

 3. A local level spatial risk profile for
 building vulnerability to coastal
 inundation hazard

 10
your knowledge partner

 The study sites

11
Methods
your knowledge partner

 Co-development Process

 Stakeholder Coastal Vulnerability Spatial Risk
 engagements inundation assessment Profile
 model
 development
 • Written survey: • Indicator • Scaling
 coastal and development
 disaster • Inundation • Weighting
 management hazard limits
 • Building
 officials (40 assessments
 respondents) • Building hazard
 exposure
 • Field work
 • Semi-
 structured
 interviews and
 consultations:
 technical
 experts (16
 respondents)

 12
Technical expertise consulted

 Local Provincial National Tertiary International
your knowledge partner

 government government government institutions
 & entities & Private
 sector

 13
Written survey results:
 Access to technology:

 ► GIS is the most widely used and accessible technology
your knowledge partner

 ► All consulted institutions are using ESRI’s ArcGIS software

 Access to technical expertise:

 ► Dedicated GIS expertise is mostly available within institutions

 ► Specialised services e.g. hydrodynamic modelling are outsourced on a project basis

 Coastal inundation risk assessment requirements:

 ► easily repeatable and structured;

 ► does not require advanced specialised expertise;

 ► implementable over a large area;

 ► quickly executable; and

 ► able to be undertaken without the need for sophisticated technologies e.g. high-
 performance computing. 14
The eBTM input data
your knowledge partner

 Question Input data Derivatives

 How to ensure hydrological Vector coastline “water Coastline
 connectivity to the coast? source”

 How to include water LiDAR derived 1m resolution Surface structures;
 movement ‘influencers’ DSM
 Elevation;
 Slope; and
 Aspect.
 How much water will cause User defined inundation water Inundation water level
 inundation? level
 How to include bottom friction Surface roughness coefficient Surface roughness
 in a GIS environment? (FEMA 2007)

 15
The eBTM Model Development
your knowledge partner

 Legend

 Input data

 Processing step

 Intermediate
 output

 Final
 output

 16
eBTM Tool Development Packaging the model into a user friendly plug & play solution for ArcGIS your knowledge partner 17
eBTM Tool Development User friendly plug & play solution for ArcGIS developed your knowledge partner 18
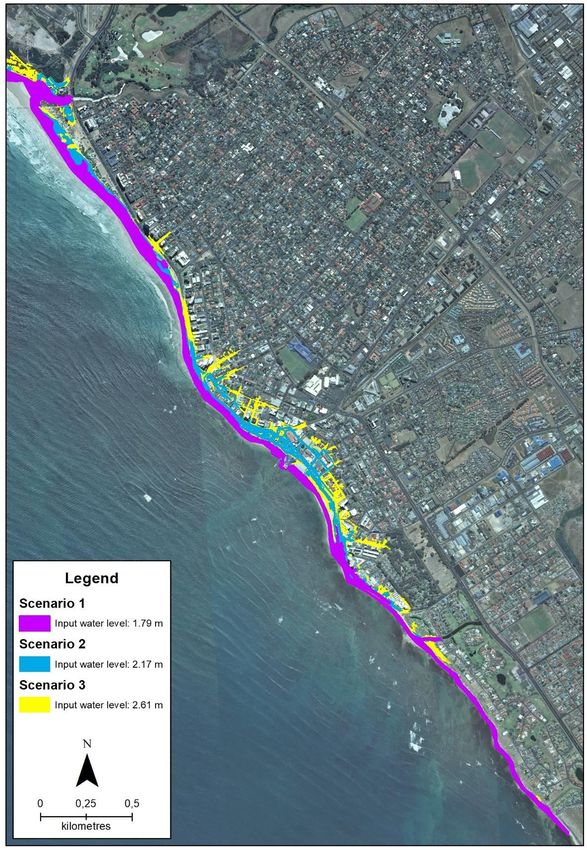
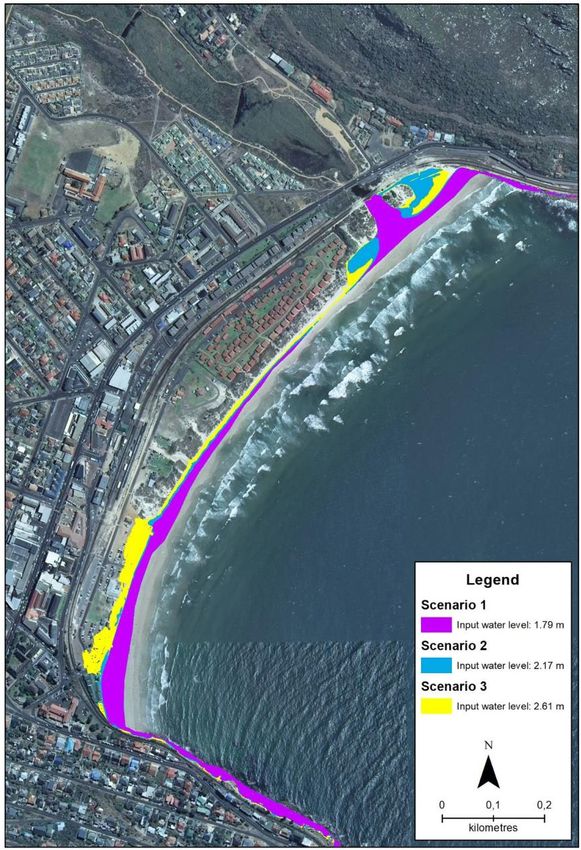
Model scenarios and parameters
 Water levels
 Scenario Return period Storm surge Spring tide IPCC AR5 Sea Hazard scenario
your knowledge partner

 number (m) water level (m) level rise water levels (m)
 projection (m)
 1 Once per 100 years 0.84 0.95 None 1.79
 2 Once per 100 years 0.84 0.95 0.38 2.17
 3 Once per 100 years 0.84 0.95 0.82 2.61

 30 August 2008 storm saw a maximum tide water level of 2.3m (SANHO 2008)

 Roughness coefficient

 FEMA 2007

 19
Sensitivity testing Comparison between sBTM vs. eBTM your knowledge partner The eBTM model’s response to a DTM vs. DSM under the same input parameters; Varying the following parameters: DSM resolutions i.e. 1m, 5m and 10m DSMs Beach slope; and Surface roughness 20
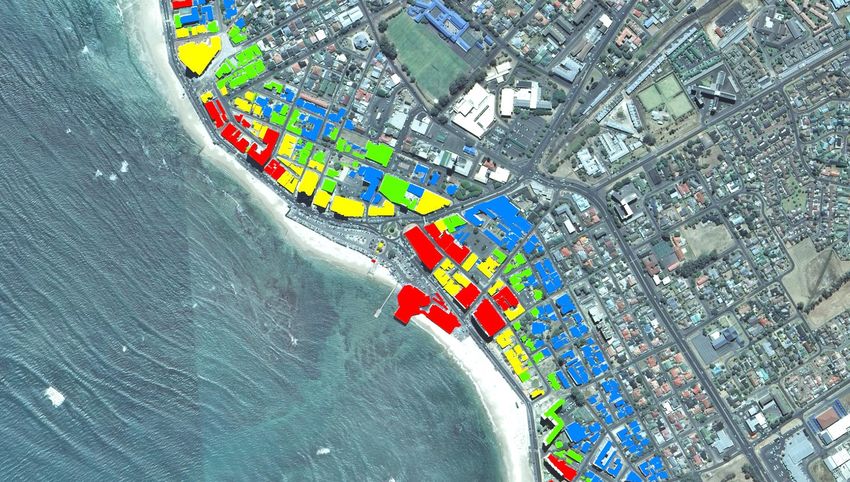
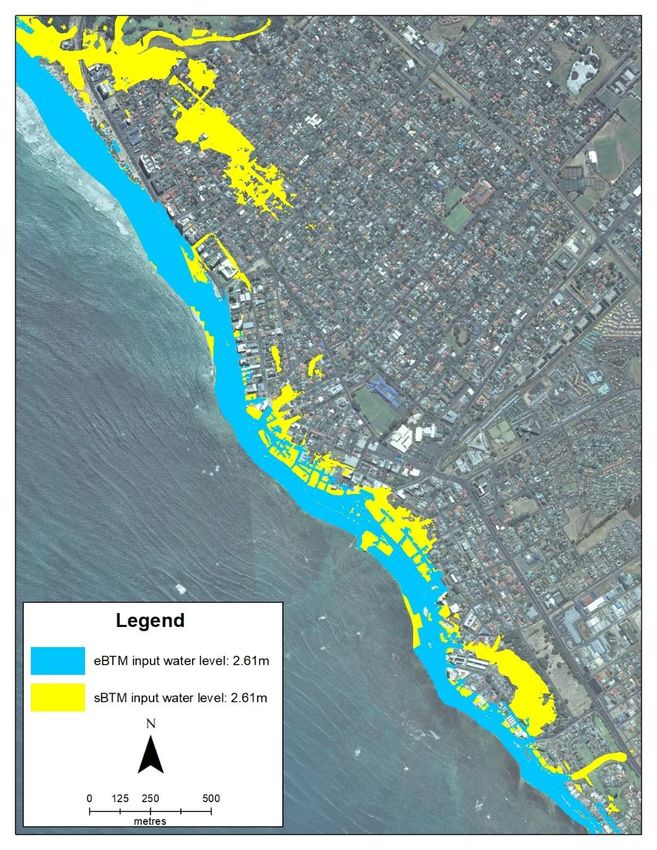
Test 1: sBTM vs. eBTM Yellow: your knowledge partner sBTM 1m DTM Water level = 2.61m Blue: eBTM 1m DSM Water level = 2.61m 21
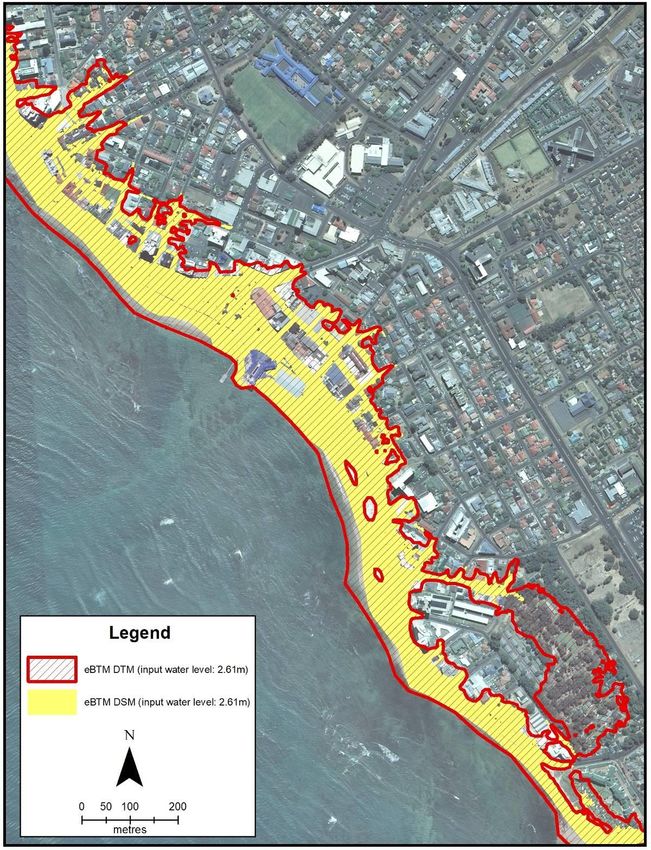
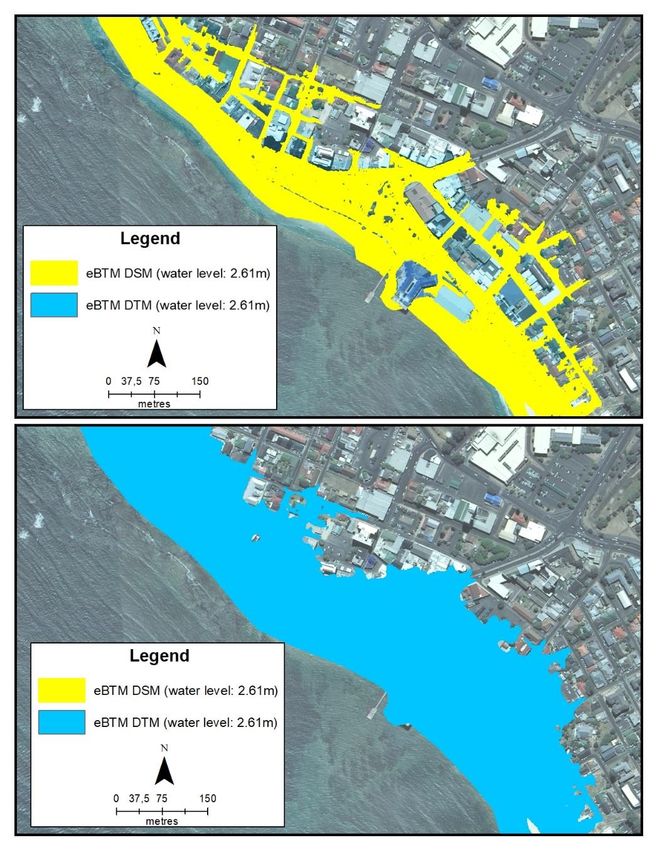
your knowledge partner

 Test 2: DSM vs. DTM

22
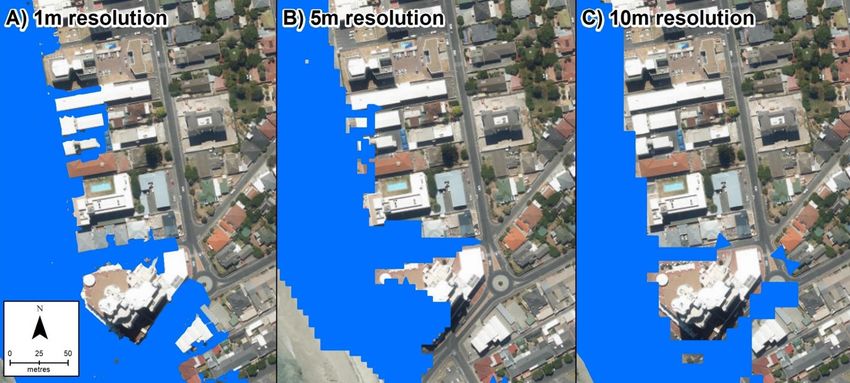
Test 3: DSM Resolution
your knowledge partner

 Test Parameters Outcome
 Study site Strand
 1m resolution DSM Model run time = 50 mins, 4 secs;
 5m resolution DSM Model run time = 1 min, 37 secs;
 23
 10m resolution DSM Model run time = 37.88 secs,
Test 4: Varying Beach Slope Strand has a gentle beach slope your knowledge partner What about steeper beaches e.g. Fish Hoek’s dune? 24
Test 4: Varying Beach Slope What about areas with sea walls e.g. Sea Point? your knowledge partner Input water level was 5m, the approximate height of the sea wall 25
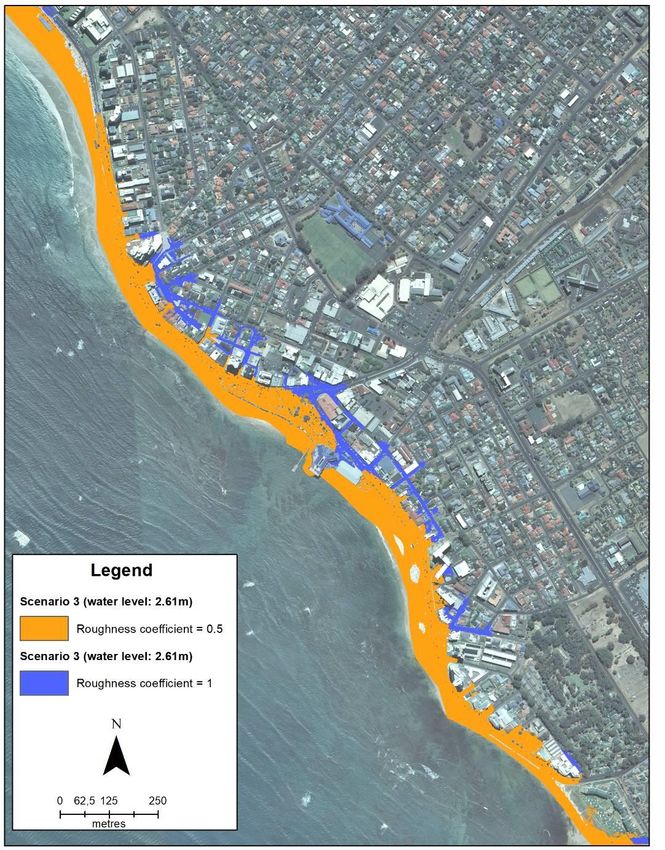
Test 5: Roughness Coefficient 1m DSM your knowledge partner Water level: 2.6m RC values based on FEMA (2007) RC is between 0 (rough) and 1 (smooth) RC = 1 (blue) RC = 0.5 (orange) 26
eBTM Validation Data points from 2008 storm Water level = 2.3m your knowledge partner 27
Inundation Hazard Results
your knowledge partner

 28
Hazard Exposure
your knowledge partner

 Buildings

 +
 Inundation
 hazard

 +

 Water
 depth

 29
Hazard Exposure
your knowledge partner

 Hazard exposure
 Inundation depth Fish Hoek Strand
 score

 0m 0 (not exposed) 202 524

 0.1 m to 0.3 m 1 (low) 3 96

 0.31 m to 0.6 m 2 (moderate) 1 59

 > 0.61 m 3 (high) 0 37

 FEMA (2013)

 30
Building vulnerability assessment Indicators developed through consultation Vulnerability your knowledge partner Indicators are hazard specific Weight = 100% Scoring mechanism (1 – 3) Each building assessed individually Physical Occupancy - Number of floors - Ground level usage - Ground floor relative to - Peak occupancy period ground level - Relative age of population - Building orientation - Presence of a solid wall around the building - Building construction Weight = 40 % material Weight = 60% 31
Impact of a solid wall
your knowledge partner

 32
Building vulnerability assessment

 = (( 1 + 2 + 3 + 4 + 5) ∗ 0.6) + ((O1 + O2 + O3) ∗ 0.4)
your knowledge partner

 Indicators Building roofprints Inherent vulnerability

 33
Building vulnerability assessment
your knowledge partner

 Vulnerability Fish Hoek Strand

 Slightly vulnerable 13 254

 Moderately vulnerable 163 354

 Highly vulnerable 30 108

 34
Spatial risk profile Conventional risk equation: your knowledge partner = ∗ ∗ Adaptation includes: Scaling - presenting data according to a particular scale (in the context of this thesis: dividing a continuous data range into discrete classes) Weighting - introducing an adjustment to the weight of individual input data and is applied to accommodate specific circumstances. Modified risk equation: = ∗ ∗ Weightings: = 1 = 0.75 = 2 35
Spatial risk profile

 Spatial Risk Profile = Inundation Hazard * Building Hazard Exposure * Building Vulnerability
your knowledge partner

 36
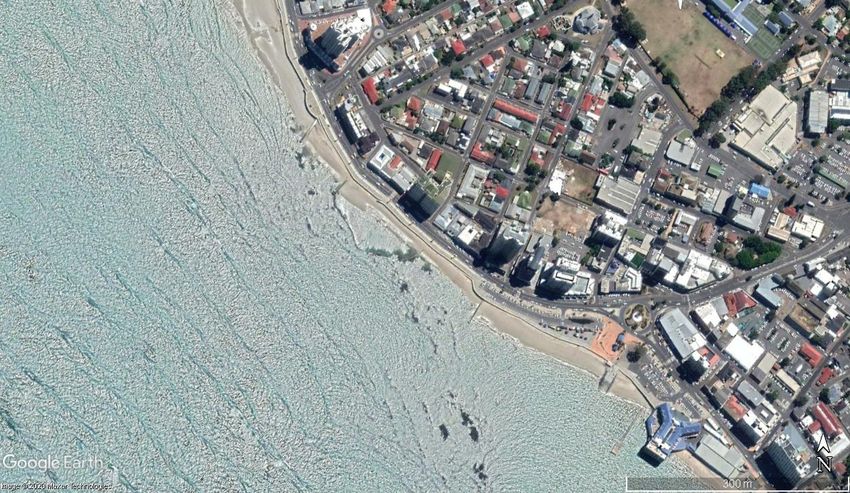
Data considerations Dependency on high resolution DEMs Preferred for coastal applications - resolution test your knowledge partner Outdated data LiDAR is expensive, but necessary, especially where the landscape has changed 37
Data considerations

 January 2016
your knowledge partner

 38
Data considerations

 February 2019
your knowledge partner

 39
Contributions Contribution to knowledge in the GIS application, disaster management and coastal management fields. your knowledge partner Individual assessment of risk components (i.e. hazard, hazard exposure and vulnerability) at a locally relevant scale. 1. Improved GIS based coastal inundation approach. 2. Framework for building vulnerability developed. 3. Cross-disciplinary and co-developed risk assessment approach. 4. Providing a method for generating geospatial risk information at levels relevant for local management. 5. Tool to empower local municipalities, disaster management and coastal practitioners to conduct local inundation assessments by packaging the eBTM model in a GUI tool. 40
Current work and future opportunities Current work: The eBTM is currently being used in the Department of Forestry and your knowledge partner Fisheries and the Environment, projects, including: Coastal Climate Change Vulnerability Assessment Project Updating Coastal Flood Hazard Decision Support Tool on OCIMS The ArcCoastTools toolbox was requested by the Western Cape Government for use in a climate change vulnerability assessment project Future opportunities: Improvements to the eBTM to incorporate a surface roughness raster (paper submitted) Promote data capture during inundation events, capturing inundation limits to assist in model validation Develop the eBTM using open source solutions for wider use Couple eBTM with more sophisticated models for improved scenario based outputs 41
Thesis outputs eBTM development and testing: Williams, L.L. & Lück-Vogel, M. 2020. Comparative assessment of the GIS based Bathtub Model your knowledge partner and an Enhanced Bathtub Model for coastal inundation. Journal of Coastal Conservation 24, 23. [online]. Available from: https://doi.org/10.1007/s11852-020-00735-x ArcPy script: Williams, L. L. 2019. Coastal Inundation (Enhanced Bathtub Model (eBTM)). Department of Environment, Forestry and Fisheries. https://doi.org/10.15493/DEFF.10000002 ArcCoastTools Williams, L. L. 2019. ArcCoastTools. Department of Environment, Forestry and Fisheries. https://doi.org/10.15493/DEFF.10000001 Guidelines for Coastal LiDAR: Lück-Vogel, M., Macon, C., Williams, L.L. 2018. Guidelines for Coastal Lidar. PositionIT, 21 May 2018, EE Publishers. Online: http://www.ee.co.za/article/guidelines-for-coastal-lidar.html National Guideline Towards the Establishment of Coastal Management Lines: Department of Environmental Affairs. 2017. National Guideline Towards the Establishment of Coastal Management Lines. Centre for Environmental Rights. Online: https://cer.org.za/wp- content/uploads/2009/12/National-guideline-towards-the-establishment-of-coastal-management- lines.pdf 42
your knowledge partner

 Thank You

43
You can also read