Refining the Impacts: Handling Uncertainty for Adaptation Planning - John Sweeney - EPA

Page created by Jeanne Patel
 
CONTINUE READING
Refining the Impacts: Handling Uncertainty for Adaptation Planning - John Sweeney - EPA
Refining the
 Impacts: Handling
  Uncertainty for
Adaptation Planning
                     John Sweeney

     NUI MAYNOOTH
Ollscoil na Éireann Má Nuad         NATIONAL DEVELOPMENT PLAN
Refining the Impacts: Handling Uncertainty for Adaptation Planning - John Sweeney - EPA
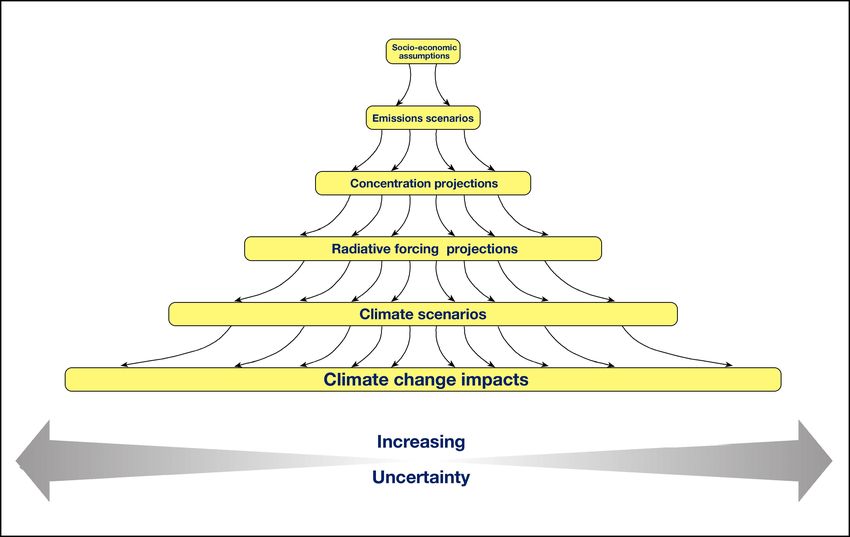
Adaptation has been identified by the Department of the Environment Heritage and Local
Government as an important component of Ireland response to climate change (NCCS, 2007).
Adaptation planning requires robust analyses of future climate conditions in the context of models.
Scenarios for policy need to be based on realistic impact assessments and climate stabilisation for
the present century. This process is informed by the EU policies and near term targets.

Where are we with the scientific understanding of climate change
                          in Ireland ?

                                                                                Source: Trenberth (2005)
Refining the Impacts: Handling Uncertainty for Adaptation Planning - John Sweeney - EPA
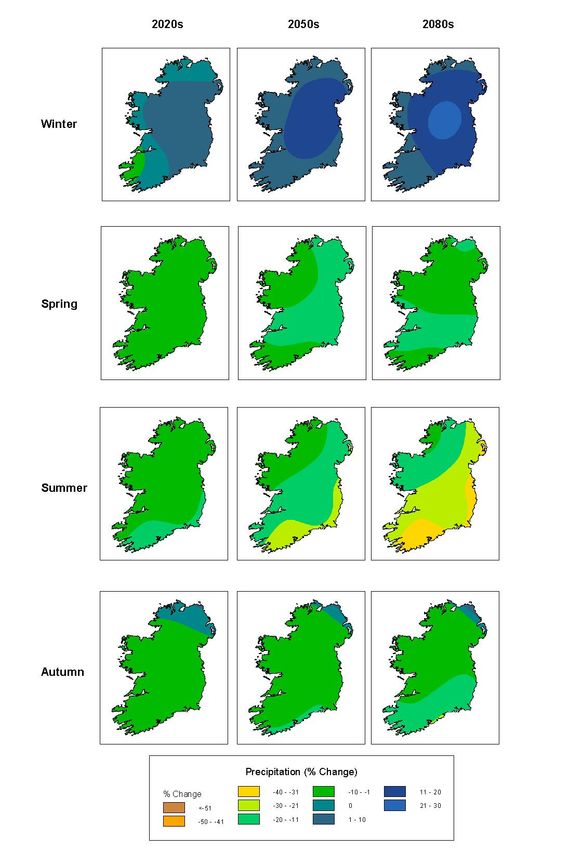
Mean Temperature Projections using different methodologies show good consistencies
                                             HadCM3+SD
                                             (ICARUS)          ECHAM+RCA (C4I)

                                                                   January 2021-2060

                                                                  July 2021-2060
Refining the Impacts: Handling Uncertainty for Adaptation Planning - John Sweeney - EPA
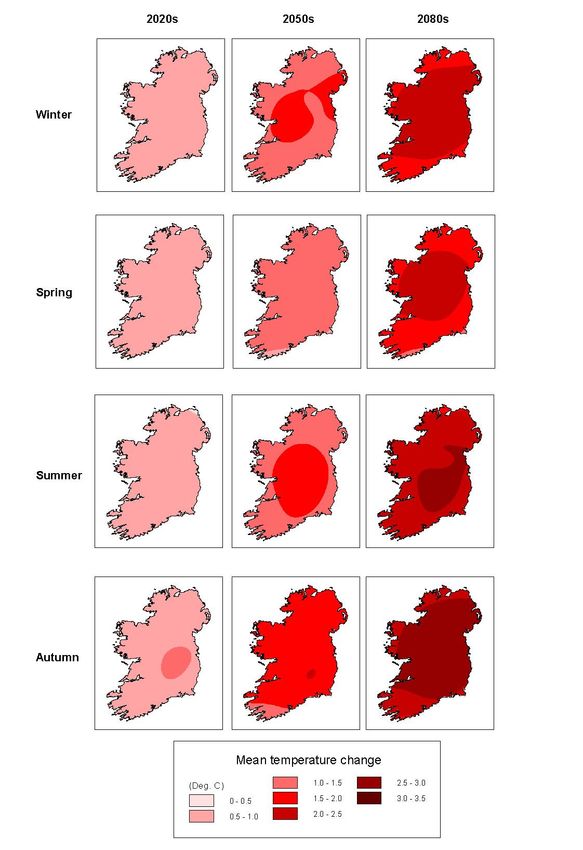
Confidence in Mean Temperature Change
         Projections is Robust
 • Warming relative to the 1961-90 period of 1.5oC
   by mid century and 3-4oC by end century
 • Summers warming slightly more than winters
 • Regional warming greatest away from coastal
   areas, especially Atlantic coasts.
 • Current decadal warming of 0.42oC/decade
   unlikely to be continued, but overall warming
   trend in Ireland likely to correspond closely to
   the global figure.
Refining the Impacts: Handling Uncertainty for Adaptation Planning - John Sweeney - EPA
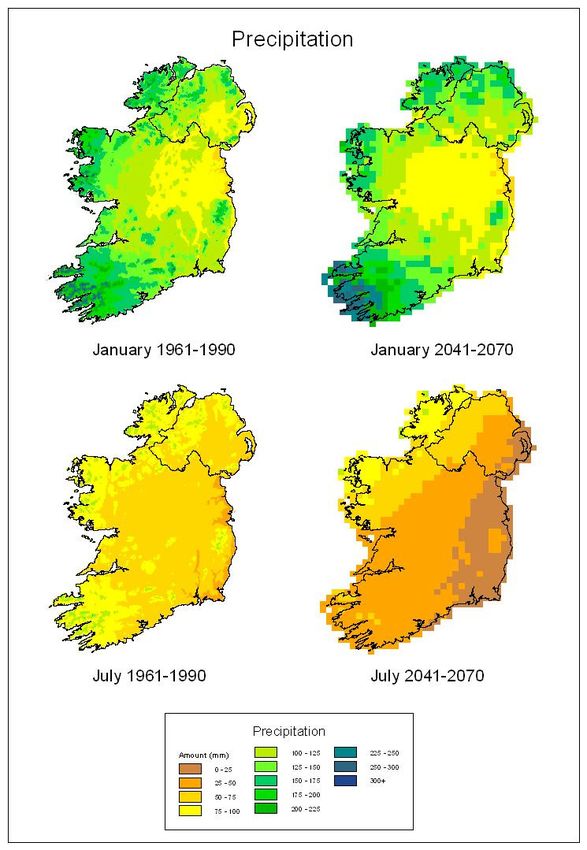
Uncertainties in Temperature
             Projections

• Different scenario models give slightly different
  regional patterns
• Extremes of temperature have as yet not been
  well tied down

• These problems can best be tackled by a
  diversity of approaches, multiple model runs
  strongly grounded in observational data and
  understanding of how the Irish climate works
Refining the Impacts: Handling Uncertainty for Adaptation Planning - John Sweeney - EPA
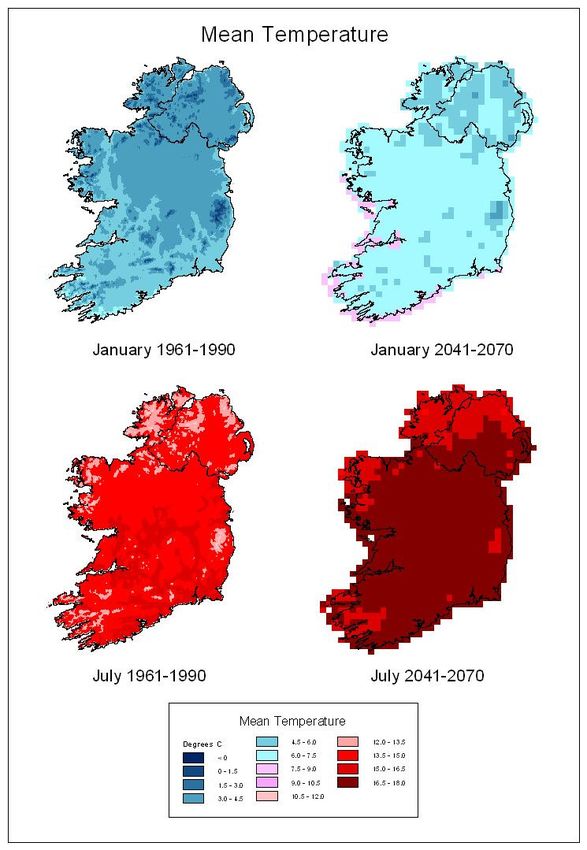
Precipitation Projections exhibit greater uncertainties, especially regionally
                                        HadCM3+SD
                                        (ICARUS)                 ECHAM+RCA (C4I)

                                                                    January 2021-2060

                                                                   July 2021-2060
Refining the Impacts: Handling Uncertainty for Adaptation Planning - John Sweeney - EPA
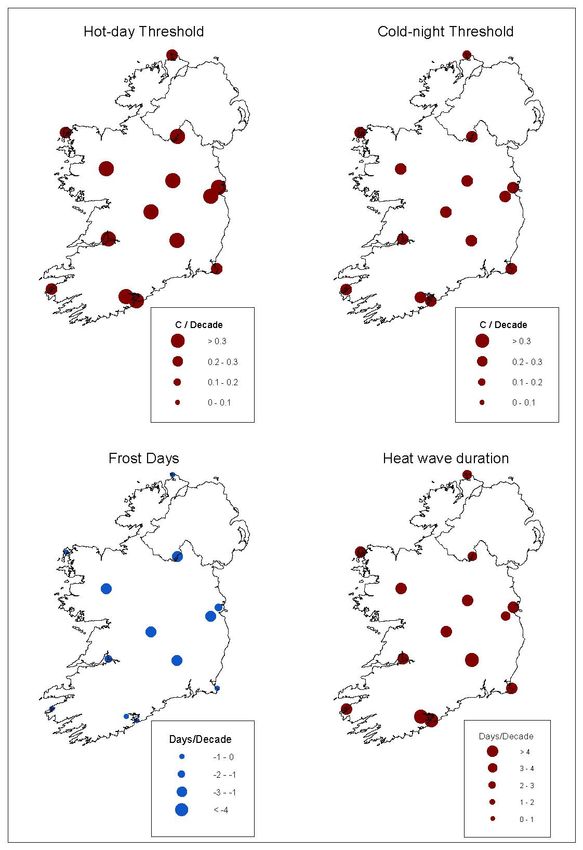
Confidence in Mean Precipitation Change
          Projections is lower
• Winters will become wetter throughout
  Ireland by approximately 10-15% by mid
  century
• Summers will become drier by
  approximately 10-25% by mid century
• Regional modelling does not identify a
  marked spatial trend, though Statistical
  Downscaling suggests a pronounced NW-
  SE trend, especially in summer.
Refining the Impacts: Handling Uncertainty for Adaptation Planning - John Sweeney - EPA
Uncertainties in Precipitation
               Projections
• Different global climate models give
  substantially different seasonal regional
  patterns across Ireland. These in turn produce
  uncertainties in Irish regional climate model
  outputs.
• Extremes of rainfall are likely to become more
  pronounced, requiring higher resolution
  temporal and spatial research
Refining the Impacts: Handling Uncertainty for Adaptation Planning - John Sweeney - EPA
Global Climate Models used in
   daily statistical downscaling for
        Irish synoptic stations
• HadCM3         UK
• CGCM2          Canada
• CSIRO Mark 2   Australia

• A2 and B2 SRES Emissions Scenarios
Refining the Impacts: Handling Uncertainty for Adaptation Planning - John Sweeney - EPA
Seasonal weights derived from the CPI score for each
    of the GCMs to produce the weighted ensemble mean

0.600

0.500

0.400
                                                     CCCM
0.300                                                CSIRO
                                                     HadCM3
0.200

0.100

0.000
          djf       mam         jja        son
20.0
            18.0
            16.0                                                                                         Comparison of observed and
            14.0                                                                                         modelled maximum
            12.0                                                                                         temperatures from Valentia,
Degrees C

            10.0                                                                                         for the independent
             8.0                                                                                         verification period 1979-1993.
             6.0
             4.0
             2.0
             0.0
                   1   2   3   4   5     6   7     8               9          10       11       12
                                       Obs   Mod

                                                                       25.0

                                                                       20.0

                                                                       15.0
                                                       Degrees C

                                                                       10.0

Comparison of observed and
modelled maximum                                                        5.0

temperatures from Kilkenny,
for the independent verification                                        0.0
                                                                                   1        2        3   4   5         6   7     8   9   10   11   12
period 1979-1993.                                                                                                Obs       Mod
Ensemble mean temperature for the 2050s produced from the weighted
ensemble of all GCMs and emissions scenarios (bars). Upper and lower ranges
   (lines) are the results from the individual GCMs and emissions scenarios.

                    Ensemble A2 scenario (■) and B2 scenario (▲)

                  Ensemble mean with GCM and SRES ranges 2050s
            3.0

            2.5
Degrees C

            2.0

            1.5

            1.0

            0.5

            0.0
                  djf             mam              jja             son
Hot Day           Cold night
threshold= 10th   threshold= 10th
hottest day per   coldest night per
year              year
Modelling Precipitation
• Daily precipitation data is rarely, if ever, normally
  distributed, resulting from a high frequency
  occurrence of low fall events and a low
  frequency of high fall events.
• Modelling precipitation requires a two-step
  procedure:
• First, precipitation occurrence must be modelled.
• Then a model is fitted to precipitation amounts
  which describes the rainfall distribution for days
  on which precipitation occurs.
Precipitation Occurrence Model
  • For the purposes of the present study, logistic
    regression, which is a particular type of generalised
    linear model (GLM), was employed to model wet and dry
      day sequences of precipitation.

                P      B   + B x  + .... B n +1 x n +1
                    =e   o    1 1

               1− P

P=probability of an event
x= independent variable
B0, B1= coefficients estimated from the data
Precipitation amounts model
• A Generalised Linear Model (GLM) was
  employed to model precipitation amounts
  conditional on a range of atmospheric variables.
• GLMs do not require the dependent variable to
  be normally distributed.
• GLMs have the added advantage in that they fit
  probability distributions to the variable being
  modelled
• Fitting probability distributions, in this manner,
  should also improve how extreme values in the
  tails of the distributions are handled within the
  modelling framework.
Comparison of observed and modelled precipitation from
       Valentia, a west coast station with high annual receipts, for
             the independent verification period 1979-1993.

       3000

       2500

       2000
(mm)

       1500

       1000

        500

          0
              1    2   3    4    5         6   7     8   9   10   11   12
                                     Obs       Mod
Comparison of observed and modelled precipitation from
Dublin Airport, an east coast station with low annual receipts,
      for the independent verification period 1979-1993
       1600

       1400

       1200

       1000
(mm)

        800

        600

        400

        200

          0
              1   2   3   4   5         6   7     8   9   10   11   12
                                  Obs       Mod
Interannual variability for observed and model precipitation from Shannon Airport,
(top) and Casement Aerodrome, (bottom) for the independent verification period
1979-1993

       1200

       1100

       1000
(mm)

       900

       800

       700

       600
              1979   1981   1983     1985      1987     1989      1991     1993
                                     obs       mod
Comparison of mean daily radiation
                                     derived from sun hours from
                                     Rosslare and modelled radiation for
                                     an independent verification period
                                     of 1961-1970

Comparison of observed mean
daily potential evapotranspiration
from Kilkenny and modelled
potential evapotranspiration for
an independent verification period
of 1991-2000
Ensemble mean precipitation for the 2050s produced from the weighted
 ensemble of all GCMs and emissions scenarios (bars). Upper and lower ranges
    (lines) are the results from the individual GCMs and emissions scenarios.
                  Ensemble A2 scenario (■) and B2 scenario (▲).

                   Ensemble mean with GCM and SRES ranges 2050s
           30.0

           20.0

           10.0
% change

             0.0
                     djf           mam            jja             son

           -10.0

           -20.0

           -30.0

           -40.0
The Uncertainty Cascade
PRECIPITATION
                                          POTENTIAL EVAPOTRANSPIRTION
                                                POTENTIAL MELT

 The HYSIM
   Model - a            SNOW                                            EVAPOTRANSPIRATION

  Conceptual
Rainfall-Runoff                                  INTERCEPTION

    Model                      IMPERMEABLE AREA

                                 OVERLAND FLOW

                                                  UPPER SOIL
                                                   HORIZON

                                                  LOWER SOIL
                                                   HORIZON

                                                 TRANSITIONAL
                                                 GROUNDWATER

                                                                           GROUNDWATER
                                                 GROUNDWATER
                                                                           ABSTRACTIONS

                       MINOR                                                HYDRAULICS
                      CHANNELS                                              SUBROUTINES

                     SEWAGE FLOW /
                                                                            RIVER FLOW
                  RIVER ABSTRACTIONS
Changes in Runoff as a % of 1961-90 averages
Percent change in simulated monthly Streamflow
                                         Boyne Mean Ensemble

            40
             40
            40
                                                  2080s
                                                   2020s
                                                  2050s

            20
             20
            20

             000
                   11   22   333   44   55   66            777   888   999    10
                                                                             10
                                                                              10    11
                                                                                   11
                                                                                    11    12
                                                                                         12
                                                                                          12
   Change
  Change
%%Change

            -20
             -20
             -20

            -40
             -40
             -40

            -60
             -60
             -60

            -80
             -80
             -80
Boyne                                                  Ryewater
                                 40                                                     50
                                                                               2020s                                                   2020s
                                 20                                                     30
                                                                                        10
                                   0
                                                                                        -10
% Change in monthly streamflow

                                 -20

                                                                                                                                               Irish Climate Analysis and Research Units
                                                                                        -30
                                 -40
                                                                                        -50
                                 -60                                                    -70

                                 -80                                                    -90
                                       j   f   m   a   m   j   j   a   s   o   n    d         j   f   m   a   m    j   j   a   s   o   n   d

                                 40                                                     50
                                                                               2050s                                                   2050s
                                 20                                                     30

                                                                                        10
                                   0
                                                                                        -10
                                 -20
                                                                                        -30
                                 -40
                                                                                        -50
                                 -60                                                    -70

                                 -80                                                    -90
                                       j   f   m   a   m   j   j   a   s   o   n    d         j   f   m   a   m    j   j   a   s   o   n   d

                                 40                                                     50
                                                                               2080s                                                   2080s
                                 20                                                     30
                                                                                        10
                                  0
                                                                                        -10
                                 -20
                                                                                        -30
                                 -40
                                                                                        -50
                                 -60                                                    -70

                                 -80                                                    -90
                                       j   f   m   a   m   j   j   a   s   o    n   d         j   f   m   a    m   j   j   a   s   o   n   d
Suir                                                  Brosna
                                  30                                                   40
                                  20                                           2020s   30                                            2020s

                                  10                                                   20
                                   0                                                   10
                                 -10                                                     0
% Change in monthly streamflow

                                 -20                                                   -10
                                 -30                                                   -20
                                 -40                                                   -30
                                 -50                                                   -40
                                 -60                                                   -50
                                       j   f   m   a   m   j   j   a   s   o   n   d         j   f   m   a   m   j   j   a   s   o   n    d

                                 30                                                    40
                                                                               2050s                                                 2050s
                                 20                                                    30
                                 10                                                    20
                                   0                                                   10
                                 -10                                                    0
                                 -20                                                   -10
                                 -30                                                   -20
                                 -40                                                   -30
                                 -50                                                   -40
                                 -60                                                   -50
                                       j   f   m   a   m   j   j   a   s   o   n   d         j   f   m   a   m   j   j   a   s   o    n      d

                                 30                                                    40
                                                                               2080s                                                 2080s
                                 20                                                    30
                                 10                                                    20
                                  0                                                    10
                                 -10                                                    0
                                 -20                                                   -10
                                 -30                                                   -20
                                 -40                                                   -30
                                 -50                                                   -40
                                 -60                                                   -50
                                       j   f   m   a   m   j   j   a   s   o   n   d         j   f   m   a   m   j   j   a   s   o   n    d
Barrow B'water   Boyne   Brosna   Inny   Moy    R'water   Suck   Suir
           20s     1.8    1.8      1.9      2.1     2.5   1.6      1.6      1.5    1.8
      A2   50s     1.6    1.5      1.4      1.5     1.4   1.5      1.4      1.4    1.7
           80s     1.3    1.4      1.2      1.3     1.2   1.3      1.5      1.2    1.5
T2
           20s     1.8    1.5      1.4      1.8     1.6   1.4      1.4      1.4    1.8
      B2   50s     1.6    1.5      1.4      1.4     1.3   1.4      1.7      1.4    1.8
           80s     1.5    1.5      1.3      1.3     1.3   1.4      1.6      1.4    1.6
           20s     4.8    3.6      7.1     13.9    12.7   4.2      3.4      4.4    4.4
      A2   50s     4.8    4.2      3.4      3.4     4.5   4.4      3.3      4.5    6.9
           80s     3.4    3.4      1.8      2.0     2.0   2.2      4.1      2.1    3.2
T10
           20s     3.7    2.6      2.3      4.0     4.1   2.2      3.5      2.4    4.1
      B2   50s     4.0    2.6      3.5      3.0     3.5   4.6      5.5      5.5    4.1
           80s     2.9    3.8      2.2      2.1     2.3   3.9      5.4      4.6    2.8
           20s     8.3    5.1      15.1    39.3    26.4   7.7      5.3      8.8    6.5
      A2   50s    10.1    7.3      5.6      4.9     7.5   8.5      5.5      9.7   16.9
           80s     6.7    5.3      2.3      2.8     2.7   3.1      6.9      3.0    4.7
T25
           20s     5.5    3.2      3.0      5.6     6.6   3.0      6.4      3.5    5.8
      B2   50s     7.7    3.4      6.9      4.5     6.1   10.3    11.0     14.2    5.8
           80s     4.6    6.6      3.2      2.6     3.2   8.2     12.8     13.8    3.7

Changes in the frequency of floods of a given magnitude for each future time period.
Results are based on the HADCM3 GCM using both A2 and B2 emissions scenarios.

                         Irish Climate Analysis and Research Units
Impacts of Climate Change on Irish Agriculture
•        Drive crop models with high
         spatial resolution monthly
         climate scenario data

•        Drive farm management
         systems with low spatial
         resolution daily climate scenario
         data

    Modelling Assumptions

•    Increase in CO2 to 581ppm by
     2055
•    Allowance for increased growth
     rates due to enhanced CO2 (1.05-
     1.2 for barley, 1.02-1.08 for potato)
•     No pest/disease effects
•    No limitations in field access or
     planting dates
•    Dominant soil type at each location
     used
•    Models: Decision Support System
     for Agricultural Technology
     Transfer (DSSAT)
Adaptation lessons
• Water stress avoidance will enable reductions in fertiliser
  use for key crops. Application rates could be halved by
  2055. For most areas, barley yields will increase in the
  medium term, even without irrigation.
• Potato growing areas in Donegal and Cork will only be
  able to maintain yields in the absence of irrigation by
  increasing fertiliser inputs to high levels. Wexford and
  the drier SE appears increasingly unsuited to potato
  cultivation. Even with 310mm of irrigation in the north
  Co. Dublin area soil conditions will limit yields
  considerably.
• Infrastructure to store winter rainfall will be needed in
  areas of the SE where irrigation is profitable.
Adaptation lessons
• Summer soil moisture deficits pose the greatest threat for future
  Irish agricultural production, especially in western parts

•   Where water is available and needed, substantial reductions in fertiliser use can be
    achieved. Water stress avoidance will enable reductions in fertiliser use for key
    crops. Application rates could be halved by 2055. For most areas, barley yields will
    increase in the medium term, even without irrigation.
•   Where water is unavailable and needed, yields may be partially maintained by
    increased fertiliser application. Infrastructure to store winter rainfall will be needed in
    areas of the SE where irrigation is profitable.
Impacts currently being researched by
     ICARUS and ICARUS-led projects
• Water resources (flooding, drought,
  supply)
• Agricultural pests/diseases
• Soils/soil degradation
• Human Health
• Biodiversity
• Aquatic ecosystems/salmon survival
• Residential Energy Consumption/Planning
3.2
                                       Total mortality per
                                       100,000
                                       Maximum
                                       temperature
                        3.0            divided by 10

                        2.8
                                    Maximum temperatures
                                    (Kilkenny) and total
Mortality per 100,000

                        2.6
                                    mortality in Ireland on
                                    the hottest day in
                                    recent decades (13th
                        2.4         July 1983)

                        2.2

                        2.0

                        1.8
                              4
                              2

                              20
                              21
                              22
                              23
                              24
                              25
                              26
                              27
                              28
                              29
                              5
                              6

                              8
                              9
                              3

                              7

                              30
                              31
                              1

                              10
                              11
                              12
                              13
                              14
                              15
                              16
                              17
                              18
                              19

                              Day

                                           Source: E. Cullen
Modelling Research currently being
        developed by ICARUS
• Downscaling for biodiversity modelling
• Regional Climate Development (WRF)
• Regional Climate Model-Ocean Model Coupling
  (WRF-ROMS)
• Regional Model Comparison studies to aid
  addressing uncertainty
Adaptation Projects Recently
             Commenced
•   Water Resource Management
•   Tourism
•   Construction
•   Biodiversity
•   Planning
What do we need for Adaptation
           Planning?
• Improved spatial and temporal resolution of
  model scenarios, especially with respect to
  extremes
• Access to spatial datasets necessary for
  calibration/verification purposes, especially
  climate, soils, biodiversity,health,pests, energy
  demand etc.
• Incorporation of best practice adaptation into
  national, regional and local decision making in
  order to provide climate-change-proofed
  roadmaps for current and future investments.
You can also read