Adelaide Hills Wine Region - SA Winegrape Crush Survey 2020 Regional Summary Report - The Wine Grape Council of SA
←
→
Page content transcription
If your browser does not render page correctly, please read the page content below
SA Winegrape Crush
Survey 2020
Regional Summary
Report

Adelaide Hills Wine
Region

Wine Australia July 2020
Adelaide Hills
                                                                 Vintage overview

VINTAGE REPORT                                                                     OVERVIEW OF VINTAGE STATISTICS
Vintage 2020 was marked by weather extremes and the Cudlee Creek                   The reported crush of Adelaide Hills winegrapes was 12,049 tonnes in
bushfire which impacted on 761 ha of vineyard plantings in the region.             2020, down 25 per cent on the 2019 crush of 16,021 tonnes, and the
However, the benefit of cool climate viticulture won through for the rest of       lowest reported crush since 2002. Over the past five years (up to 2019),
the district with winemakers crafting crisp white wines and stunning reds.         the average crush for the Adelaide Hills has been 24,809 tonnes, making
                                                                                   this year’s crush 51 per cent below the five-year average.
The grape growing season began well then faced unseasonably cold
conditions in the final stages of flower development and flowering. This           There were 72 respondents to the survey who reported crushing grapes
meant that grapes failed to set and for the second consecutive season              from the Adelaide Hills in 2020, compared with 76 in 2019.
yields were below 60% of the average crops of the mid-2010s. Unlike its
                                                                                   The total value of winegrapes in 2020 decreased by $5 million to $19.5
neighbours, the Adelaide Hills had just two heatwaves during the growing
                                                                                   million as a result of the lower production, although this was partly offset
season. The first, over 5 days, resulted in the Cudlee Creek bushfire
                                                                                   by an overall increase in the average purchase value of grapes, which
which broke out on December 20. The second heatwave, over the last
                                                                                   increased by 7 per cent from $1520 to $1626 per tonne.
four days of December, caused minimal damage as grape berries were
still hard and green and resistant to heat damage. The remainder of                There were increases in average prices for the three largest varieties:
summer included several heat spikes meaning that vine canopies                     Pinot Noir up by 16 per cent to $1865 per tonne, Sauvignon Blanc up 4
remained undamaged, fully protecting berries as they ripened.                      per cent to $1440 per tonne and Chardonnay up by 3 per cent to $1689
                                                                                   per tonne.
The ripening period, in contrast to December, was cool. February was the
coldest since the 1990s and January, March and April were mild.                    The price dispersion data shows a big upward shift in prices paid, with 72
Welcome rains (80 – 110 mm) in late January / early February were                  per cent of red grapes being sold at $1500 per tonne or above compared
timely in breaking a run of unseasonably dry weather and setting up                with 50 per cent in 2019, and 61 per cent of whites being sold in the same
perfect ripening conditions. Disease pressure was low as spring was dry            price range compared with 47 per cent in 2019.
and the rains were at a time of the season that caused minimal damage.
                                                                                   There were 18 hectares of new vines planted in the region in the 2019-20
Richard Hamilton – Hamilton Viticulture                                            season compared with 56 hectares in the previous season. The plantings
                                                                                   were predominantly split between the major varieties Pinot Noir,
On behalf of Adelaide Hills Wine Region
                                                                                   Sauvignon Blanc and Chardonnay.
                                                                                   The total vineyard area in the Adelaide Hills as at 30 April 2020 is 3760
                                                                                   hectares – a small net reduction since 2019 (3830 hectares) and 100
                                                                                   hectares below the total area five years ago.

 SA Winegrape Crush Survey 2020                                                2                                                   Wine Australia July 2020
Adelaide Hills
Winegrape intake summary table
Price dispersion - number of tonnes in each price range
Total tonnes total value Average Change in Winery Share of Total Est total value
purchased $300 to $600 to $1500 to purchased purch. value price YoY grown fruit winery crushed ALL grapes
< $300 $2000+Adelaide Hills
Historical weighted average price vs tonnes crushed
Average price
$ per tonne Sauvignon Blanc Pinot Noir Tonnes crushed
2500 Chardonnay Tonnes crushed (RH axis) 40,000
35,000
2000
30,000
25,000
1500
20,000
1000
15,000
10,000
500
5,000
0 0
2005 2006 2007 2008 2009 2010 2011 2012 2013 2014 2015 2016 2017 2018 2019 2020
SA Winegrape Crush Survey 2020 4 Wine Australia July 2020Adelaide Hills
Current plantings by variety and year planted
%
planted
Variety Pre-2017 2017 2018 2019 Total area in 2019
Red winegrapes
Cabernet Franc 8 0 0 0 8 0%
Cabernet Sauvignon 196 18 0 0 214 0%
Grenache 2 0 0 0 2 0%
Merlot 140 0 0 0 140 0%
Meunier (Pinot Meunier) 21 0 0 0 21 0%
Nebbiolo 11 0 2 1 14 7%
Pinot Noir 642 7 14 5 668 1%
Sangiovese 13 0 1 0 14 0%
Shiraz 362 4 14 0 380 0%
Tempranillo 30 2 0 0 32 0%
Other Red 35 1 4 2 42 5%
Total red varieties 1,460 32 35 8 1,535 1%
White winegrapes
Chardonnay 800 11 4 4 819 0%
Gruner Veltliner 18 1 0 0 19 0%
Pinot Gris 245 5 5 0 255 0%
Riesling 53 1 1 0 55 0%
Sauvignon Blanc 902 11 0 4 917 0%
Semillon 35 0 0 0 35 0%
Traminer (Gewurztraminer) 20 0 0 0 20 0%
Viognier 21 0 0 0 21 0%
Other White 39 3 3 2 47 4%
Total white varieties 2,133 32 13 10 2,188 0%
Rootstock Block 2 0 0 0 2 0% Source:
Unknown variety 27 0 8 0 35 0% Vinehealth
Total all varieties 3,622 64 56 18 3,760 0% Australia
SA Winegrape Crush Survey 2020 5 Wine Australia July 2020Explanations and definitions
INTAKE (CURRENT VINTAGE) DATA The calculated average purchase value per tonne is the average amount paid per
tonne of fruit across all wineries.
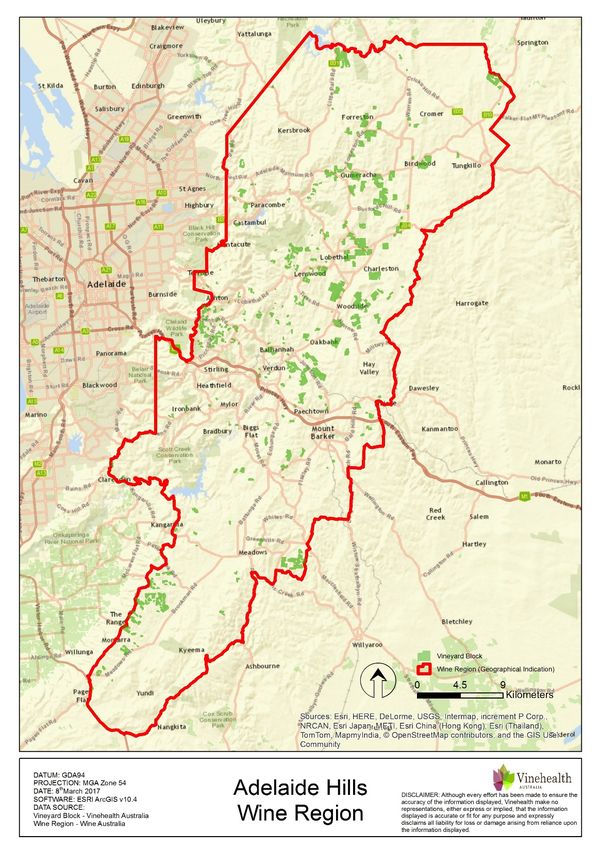
Definition of regions
Winery grown grapes are not included in the calculation of average purchase
Regions have been defined in accordance with Geographical Indication (GI)
value; nor are grapes grown by companies connected with the winery or under
boundaries. If a GI region has not been declared, or produces less than 5,000
lease arrangements.
tonnes, then the data is aggregated into the relevant GI zone. Disaggregation of
data into smaller regions such as Southern Fleurieu and Mount Benson is Average and total purchase values are not reported where there are fewer than
available on request from Wine Australia. three purchasers of a variety in a particular region. However the values are
included in the calculation of totals for each region.
Total crush
Important note on average purchase value
The total crushed is the total tonnes of grapes crushed from a particular source
region, whether processed in that region, another region in SA or interstate. All There is considerable variation in the pricing arrangements made by different
wineries in Australia are included in the survey collection process. However, not wineries. For example, some wineries make adjustment payments based on the
all wineries respond to the survey - therefore the total tonnage reported may average value per tonne reported in this survey and some pay quality bonuses
underestimate the true crush. It is estimated that the overall response rate for the based on the end use of the product. These additional payments are not included
survey is 88 per cent; however, individual regions may vary. Generally, regions in the reported figures. The average price also does not give any indication of the
will have a higher response rate when there is a high proportion of purchased distribution of prices, or variables that go into individual contracts.
winegrapes within the region.
Price dispersion data (shaded columns in Intake Summary tables)
Reported fruit is separated into fruit produced from the winery’s own or
All purchases for each variety are grouped into price segments according to the
associated vineyards (“own grown”) and from independent vineyards
price paid for that batch of fruit. The sum of tonnes in all the price segments may
(“purchased”).
not match the total tonnes purchased where there are tonnes reported without an
Calculated average purchase value associated price.
The survey requests wineries to provide the total amount paid for each parcel of Estimated total value of all grapes
fruit purchased (or the price per tonne). This is the price paid for fruit of a
The estimated total value of all grapes is calculated by multiplying the average
particular variety at the point of receival – not including specific amounts paid for
purchase value per tonne by all tonnes crushed. If there is a variety where there
freight. It includes any penalties or bonuses (eg Baumé) applied at the
are no purchases, then the average purchase value for the same variety across
weighbridge, but DOES NOT INCLUDE other bonuses or adjustments such as
similar regions, or across all other varieties of the same colour in the same region
end use quality bonuses, which are not available at the time the survey is
is used to determine an estimated value for the own grown grapes.
conducted (May-June 2020).
SA Winegrape Crush Survey 2020 6 Wine Australia July 2020Explanations and definitions - continued
PLANTING DATA
Source of planting data tables • Planting data tables are current as at 30 April 2020 and include all plantings
from the 2019–20 planting season.
Planting data is not collected by the Australian National Vintage Survey. The • Reference to “other varieties” includes rootstock, multi-purpose and table-
information is obtained from the vineyard register maintained by Vinehealth grape plantings.
Australia. • Vines planted in a particular year may include top-worked or replaced vines,
Vinehealth Australia is required under the Phylloxera and Grape Industry Act as well as new plantings in virgin ground. Where vines have been replaced or
1995 to maintain a complete and accurate register of vineyard owners in the topworked, the old variety record is removed. This explains why the area
state. Vineyard owners with plantings of 0.5 hectares or more are required to planted for earlier years may be different in the current report compared with
register with Vinehealth Australia, and provide details of any changes made to previous reports.
these vineyard plantings within three months of any such change. This • Where a zero (0) appears in a table, this may indicate the presence of a
information is kept strictly confidential and provided for this survey in a planting of less than 0.5 hectares, or it may indicate zero plantings. Rounding
deidentified and aggregated manner. may produce slight discrepancies in totals.
For more information on the planting data in this report or about registration of
vineyards, please contact the Vinehealth Australia office on (08) 8273 0550.
Explanatory notes for planting data tables
To protect confidentiality, the following rules are applied to reporting varieties:
• where there are fewer than 10 registered owners with plantings of a
particular variety across the state, that variety is not separately identified in
either the state or the regional reports but is grouped with “other
red/white”, AND
• where there are fewer than three registered owners with a particular grape
variety in a given region, that variety is not separately identified in the
regional report but is grouped with “other red/white” unless it is a white
variety listed in the top seven, or red variety in the top five by planted area
for the state for the current year.
.
SA Winegrape Crush Survey 2020 7 Wine Australia July 2020Acknowledgements
AUSTRALIAN NATIONAL VINTAGE SURVEY
Wine Australia is an Australian Commonwealth Government statutory authority,
The information for this report has been collected and analysed by Wine Australia as established under the Wine Australia Act 2013, and funded by grape growers and
part of the Australian National Vintage Survey. The SA Winegrape Crush Survey winemakers through levies and user-pays charges and the Australian Government,
Report has been prepared by Wine Australia on behalf of the South Australian Wine which provides matching funding for RDA investments and funds the ERWSP.
Industry Association, Wine Grape Growers South Australia and Primary Industries
and Regions SA.
Disclaimer
The survey publication is available on Wine Australia’s website wineaustralia.com, the
Vinehealth Australia website vinehealth.com.au and via links from the Wine Grape This information has been made available to assist on the understanding that Wine
Council SA website wgcsa.com.au and the South Australian Wine Industry Australia is not rendering professional advice. Wine Australia does not accept
Association website www.winesa.asn.au. responsibility for the results of any actions taken on the basis of the information
contained in this report, nor for the accuracy, currency or completeness of any material
Credits contained in it. Wine Australia expressly disclaims all and any liability and responsibility
Images – Wine Australia to any person in respect of consequences of anything done in respect of reliance,
GI maps – Vinehealth Australia whether wholly or in part, upon this report.
Note: data published in this report supercedes that in earlier reports. Minor variations in
reported figures can occur due to data revisions.
About Wine Australia
Any questions about the report should be directed to:
Wine Australia supports a competitive wine sector by investing in research,
Wine Australia Market Insights
development and adoption (RDA), growing domestic and international markets,
+61 8 8228 2000
protecting the reputation of Australian wine and administering the Export and Regional
Market.Insights@wineaustralia.com
Wine Support Package (ERWSP).
SA Winegrape Crush Survey 2020 8 Wine Australia July 2020You can also read